PSYC3010 EXAM
 Call Kai
 Learn
Learn Practice Test
 Spaced Repetition
 Match
Match Flashcards
 Knowt Play
1/419

There's no tags or description
Looks like no tags are added yet.
Name | Mastery | Learn | Test | Matching | Spaced | Call with Kai | Chat |
|---|
No analytics yet
Send a link to your students to track their progress
420 Terms
Interaction
Effect of one variable changes with another variable.
Boundary Conditions
Conditions under which effects vary or reverse.
Factorial Design
Examines effects of multiple independent variables simultaneously.
Main Effects
Individual effects of each factor on the dependent variable.
Two-Way Design
Design with two independent variables affecting a DV.
Levels of Factors
Different conditions or categories within each factor.
Economical Design
More efficient use of participants in experiments.
Generalisability
Effect remains consistent across levels of another factor.
Conditional Effect
Effect depends on the level of another factor.
Research Questions
Questions addressed in factorial design experiments.
Main Effect of Factor A
Overall effect of Factor A on the DV.
Main Effect of Factor B
Overall effect of Factor B on the DV.
Interaction Effect (A x B)
Effect of Factor A varies by levels of Factor B.
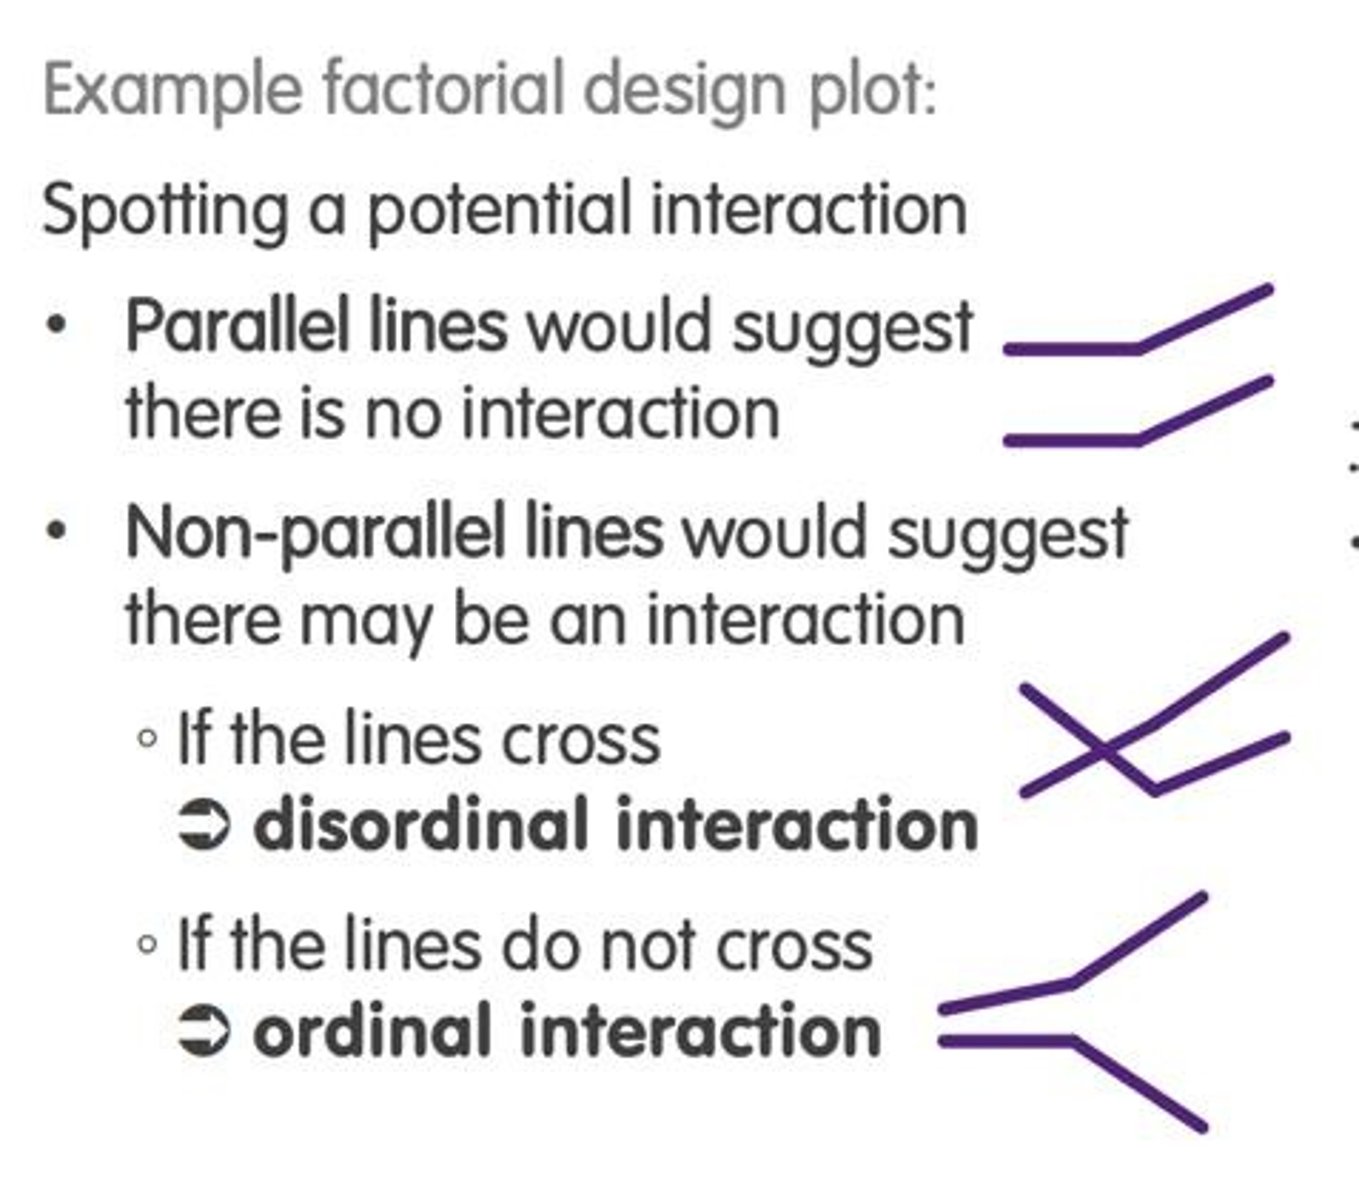
Significant Interaction
Indicates main effect interpretation depends on another factor.
Marginal Means
Average scores at each level of a factor.
Two-Way ANOVA
Statistical test for main and interaction effects.
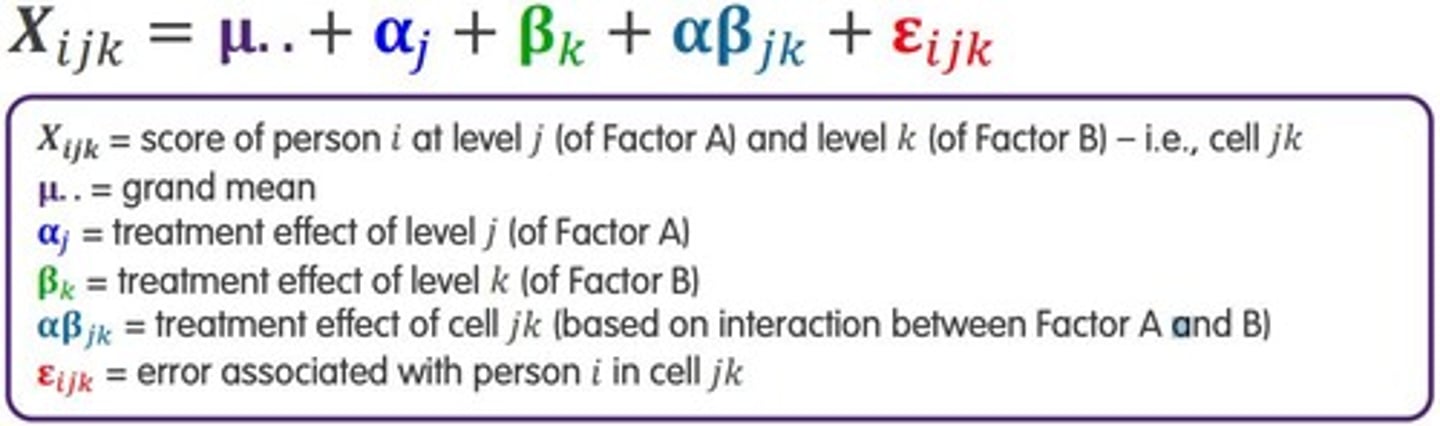
Simple Effects
Effects examined at specific levels of another factor.
Independent Variables (IVs)
Variables manipulated to observe effects on the DV.
Dependent Variable (DV)
Outcome measured in response to IV manipulation.
Comprehensive Understanding
Deeper insight into complex variable relationships.
Power of Detection
Ability to identify true effects with sufficient sample size.
Nuance in Effects
Subtle variations in how effects manifest.
Experimental Conditions
Specific setups under which experiments are conducted.
Cell Means
Averages of scores at each factor level.
Main Effect
Overall effect of one independent variable on the DV.
Line Graphs
Used to plot two-way interactions visually.
Main Effect Identification
Average across cell means to detect differences.
Interaction Identification
Non-parallel lines indicate an interaction between factors.

Simple Effect Identification
Differences along a single line or vertical differences.
Fully Between-Participants Design
Different groups for each level of independent variables.
Between-Groups Variance
Variance due to differences between participant groups.
Treatment Variance
Variance attributed to different treatment conditions.
Research Question for One-Way ANOVA
Tests mean differences across levels of one IV.
Independent Variable (IV)
Factor manipulated to observe effects on the DV.
Factorial Design Notation
Expressed as A x B for two factors.
Levels of a Factor
Different conditions or categories of an independent variable.
Converging Lines
Indicate that one factor's effect changes with another.
Diverging Lines
Show that the effect of one factor increases with another.
Crossing Lines
Suggest a complex interaction between factors.
Overall Trend
Average height of lines indicates main effects.
Vertical Separation
Distance between lines indicates main effects presence.
One-way ANOVA
Statistical test for comparing means across groups.
Within-groups variance
Random variation within each group, unexplained by IV.
SStreatment
Sum of squared differences between group means and grand mean.
SSerror
Sum of squared differences within groups from their means.
MStreatment
Variance index among treatment means, calculated from SStreatment.
MSerror
Variance index within groups, calculated from SSerror.
F ratio
Ratio of between-groups variance to within-groups variance.
Factor A x Factor B Interaction
Effect of one factor varies by levels of another factor.
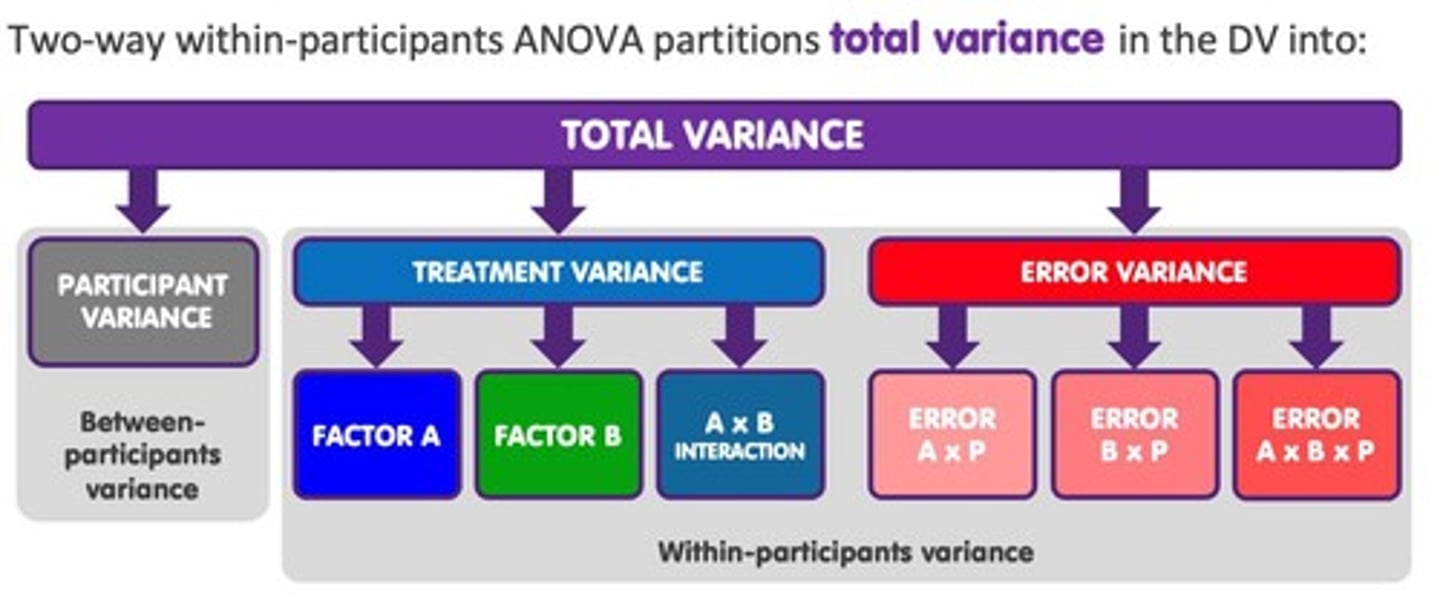
Total variance
Overall variability in dependent variable scores.
Variance due to Factor A
Variance attributed to the main effect of Factor A.
Variance due to Factor B
Variance attributed to the main effect of Factor B.
Interaction Effect A x B
Variance due to interaction between Factors A and B.
Degrees of freedom
Number of independent values in a statistical calculation.
Random error
Unmeasured influences causing variability in scores.
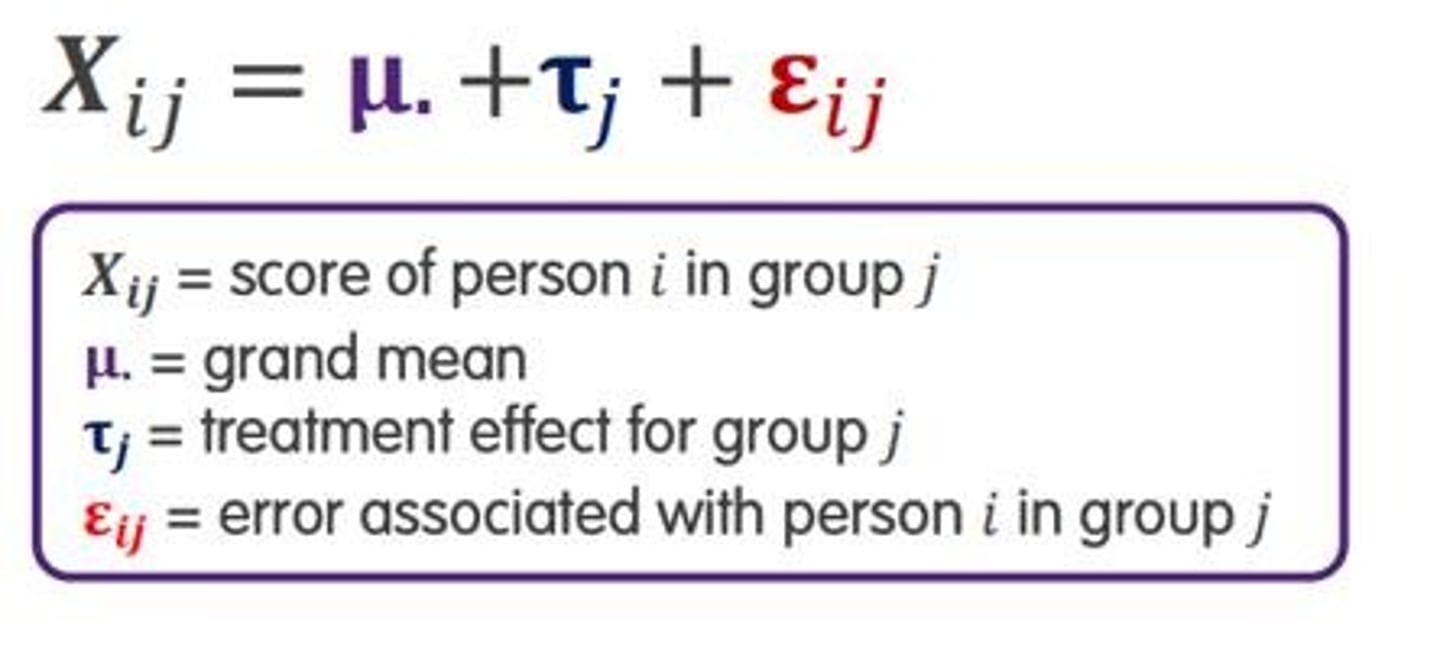
Treatment effect
Impact of independent variable on dependent variable scores.
Conceptual model
Framework explaining participant scores in ANOVA.
Systematic variance
Variance explained by the treatment or independent variable.
Unexplained variance
Variance not accounted for by the independent variable.
Pooled within-cell variance
Combined variance from multiple groups in ANOVA.
ANOVA
Analysis of variance, comparing means across groups.
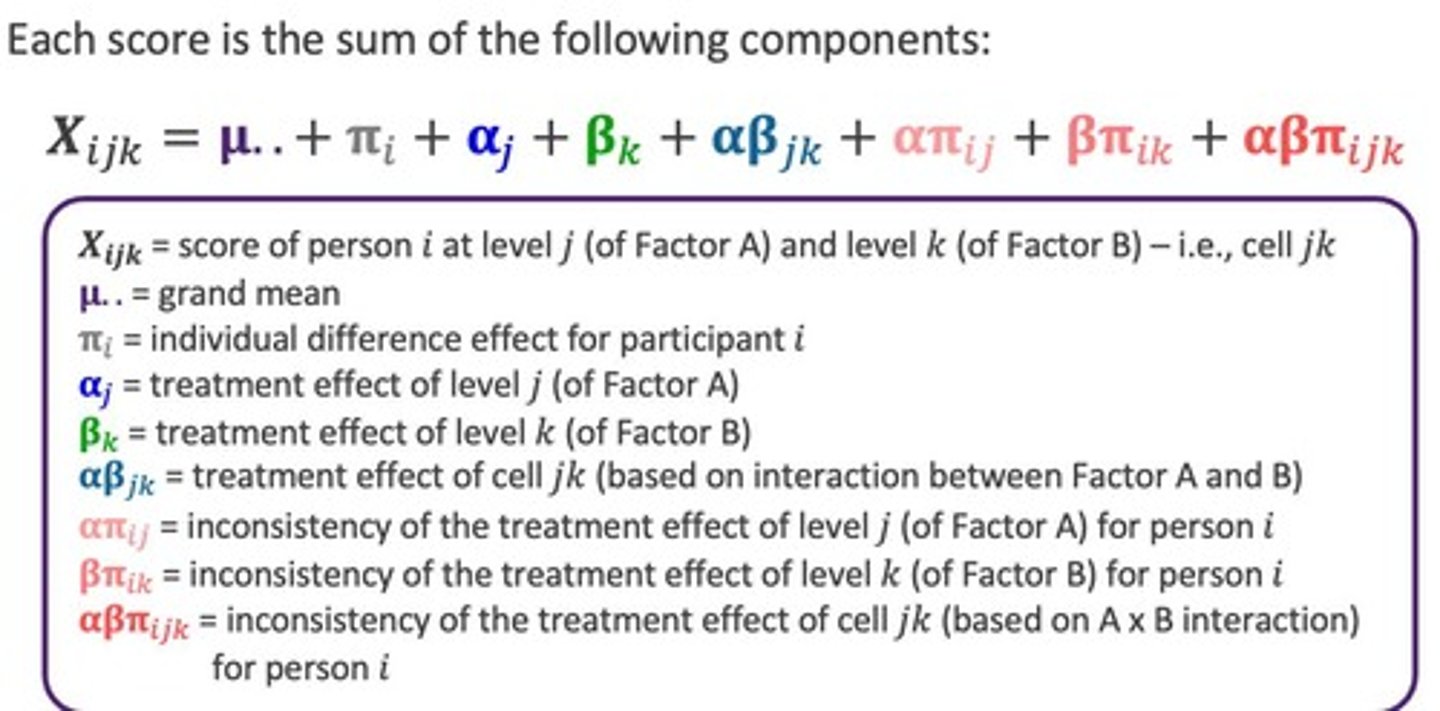
SS for main effect
Variability due to a specific main factor's influence.
SS for interaction
Variability from combined effects of factors.
SS error
Unexplained variability within each group or cell.
Significant F test (Factor A)
Indicates significant differences in Factor A's levels.
Significant F test (Factor B)
Indicates significant differences in Factor B's levels.
Significant F test (A x B interaction)
Shows Factor A's effect varies across Factor B's levels.
Omnibus test
Detects overall differences among factor levels.
Population Normality
Assumes group populations are normally distributed.
Homogeneity of variance
Assumes equal variances across group populations.
Independence of observations
No repeated measures from the same participant.
Continuous DV
Dependent variable measured on continuous scale.
Follow-up tests
Identify specific differences after omnibus tests.
Simple effect
Effect of one factor at specific level of another.
Mean Square (MS)
Average of squared deviations from the mean.
MS error
Mean square of the unexplained variability.
Preliminary partitioning of variance
Initial breakdown of variance in ANOVA.
Statistical significance
Indicates likelihood that results are not due to chance.
Omnibus F-test
Initial test assessing overall significance across groups.
Significant Main Effect
Indicates differences among marginal means of factors.
Pairwise Comparisons
Comparing two means at a time for significance.
Linear Contrasts
Comparing one mean or set of means to another.
Significant t-test
Indicates significant difference between two marginal means.
Dependent Variable
Outcome measured in an experiment or study.
Type I Error
Incorrectly rejecting a true null hypothesis.
Simple Comparison
Further tests needed after significant F-test for simple effects.
Hypotheses Testing
Process of determining the validity of a hypothesis.
Control Group
Group not exposed to treatment, used for comparison.
Experimental Groups
Groups exposed to different treatments in a study.
Weights in Linear Contrasts
Values defining specific comparisons in mean analysis.
Significance of Simple Effects
Determines if one factor's effect varies across levels.
Maximum Simple Effects
Determined by the number of levels in the other factor.
F-test for Simple Effect
Tests significance among cell means for one factor.
Significant Simple Effect
Requires follow-up if more than two levels exist.
Simple Comparisons
Compare means within a specific level of another factor.
Pairwise Simple Comparisons
Compare two cell means at one factor level.
Linear Simple Contrasts
Compare specific means within one factor level.
Repartitioning Variance
Focuses on variability of one factor within another.
Simple Effects of Factor A
Variance of Factor A analyzed at each level of Factor B.
Simple Effects of Factor B
Variance of Factor B analyzed at each level of Factor A.