Supply and Demand
 Call Kai
 Learn
 Practice Test
 Spaced Repetition
 Match
 Flashcards
 Knowt Play
1/58

There's no tags or description
Looks like no tags are added yet.
59 Terms
How many sides does a market have?
two sides—buyers and sellers
Which market is an example of a market for goods?
apple market
Which market is an example of a market for services?
tennis lessons market
In which of the following markets is a factor of production traded?
computer programmer market
What is the name for a market in which a seller or buyer cannot set the price?
a competitive market

Refer to Table 1.1.1. In 2018, what was the relative price of a cup of coffee in terms of a cup of tea?
The relative price was
1.07.

Refer to Table 1.1.1. In 2019, what was the relative price of a cup of coffee in terms of a can of cola?
The relative price was
1.25.

Refer to Table 1.1.1. In 2020, what was the relative price of a can of cola in terms of a cup of tea?
The relative price was
0.91.

Refer to Table 1.1.1. How did the following relative prices change between 2018 and 2019? The price of a cup of coffee relative to the price of a cup of tea ________ while the price of a cup of coffee relative to the price of a can of cola ________
rose; did not change

Refer to Table 1.1.1. How did the following relative prices change between 2019 and 2020? The price of a cup of coffee relative to the price of a cup of tea ________, while the price of a cup of coffee relative to the price of a can of cola ________.
fell; fell
What is the quantity demanded of a good or service?
The quantity demanded of a good or service is
the amount that consumers plan to buy during a given time period at a particular price.
What is the law of demand?
Other things remaining the same,
when the price of a good rises, less of the good is demanded.
How does the rise in the price of tuition influence the market for university education?
The tuition price rise creates
both a substitution effect and an income effect.
When the price of a latte is $3, Eric buys 5 lattes a week. When the price of a latte rises to $5, Eric buys 3 lattes a week and starts to drink tea. What is Eric's substitution effect and income effect?
Eric buys more tea and fewer lattes, which is the substitution effect. And faced with a tighter budget Eric buys even fewer lattes, which is the income effect.
When does the demand curve for services slope downward to the right?
When the price rises relative to income and people can't afford to buy as much of the service as they previously bought.
Which of the following statements is correct?
If a rise in the price of ground beef
increases the demand for chicken, then chicken is a substitute for ground beef.

Refer to Figure 1.2.1. Which of the following options would shift the demand curve for pizza from D1 to D2?
a rise in the price of spaghetti, a substitute for pizza
People buy more of good 1 when the price of good 2 rises. What is the relationship between good 1 and good 2?
They are substitutes.
Oatmeal is a normal good, raisins are a complement of oatmeal, and cold cereal is a substitute for oatmeal. Which of the following events increases the demand for oatmeal?
an increase in the price of cold cereal
Which of the following statements is correct?
A turnip is an inferior good if
an increase in income decreases the demand for turnips.
What is the law of supply?
Other things remaining the same, as the
price of chocolate falls, the quantity of chocolate supplied decreases.
Why does a higher price increase the quantity supplied?
The quantity supplied increases if
the marginal cost of producing the good is less than the price.
A fall in the price of a good results in a decrease in the quantity of the good supplied.
What does this fact illustrate?
the law of supply
What is a recent, real-world example of the law of supply?
The price of hand sanitizer increased so firms produced more hand sanitizer.
How can the supply curve be interpreted?
As a ________ that shows ________.
minimum-supply-price curve; the lowest price at which someone is willing to sell
A factory can use its factors of production to produce either good A or good B. If the price of good A rises, how does the factory respond?
It decreases the supply of B.
Which of the following events will shift the supply curve of good X leftward?
an increase in the cost of machinery used to produce X
Which of the following events will increase the supply of good X?
a decrease in the wages of workers employed to produce good X
A business uses its factors of production to produce either good A or good B. What do you know about good A and good B?
They are substitutes in production.
If the market for Twinkies is in equilibrium, which of the following statements is correct?
The equilibrium quantity of Twinkies equals the quantity demanded.
What is the equilibrium price?
The equilibrium price is the price at which
the quantity demanded equals the quantity supplied.

Refer to Table 1.4.1. The table shows the demand and supply schedules for shampoo. Which of the following statements is correct?
The equilibrium price is $8 a bottle.
When will a shortage of services occur?
When the price is below the equilibrium price.
When does a shortage of a good occur?
When the quantity of the good demanded
exceeds the quantity supplied at the market price.

Refer to Table 1.4.2. What is the situation in the market if the price is $3 a unit?
A 180-unit shortage exists, and the price will rise.

Refer to Figure 1.4.1. Which of the following statements is incorrect at price P2?
The quantity demanded is Q1.

Refer to Figure 1.4.1. What is the situation in the market at price P1?
A shortage equal to the amount of Q4 - Q2 exists.

Refer to Figure 1.4.1. What is the situation in the market at price P1?
Producers can sell all they plan to sell.

Refer to Figure 1.4.1. What is the situation in the market at price P3?
A surplus equal to the amount of Q5 - Q1 exists.
When the number of working mothers increases, what happens in the market for childcare services?
Demand increases, and the price of childcare services rises.

Refer to Figure 1.5.1. If the demand curve is D2, what is the situation in the market?
The equilibrium price is P2 and the equilibrium quantity is Q2.
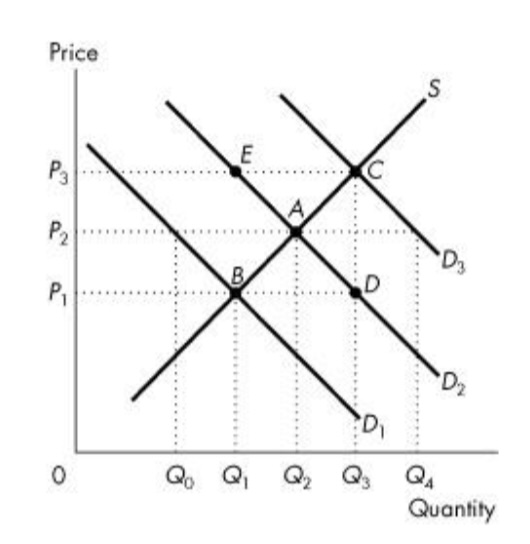
Refer to Figure 1.5.1. Initially, the demand for good A is curve D2. The price of good B, a substitute for good A, falls. Which of the following events will occur?
A surplus of good A will be created at P2.

Refer to Figure 1.5.1. Initially, the demand for good A is curve D2. If shoppers' incomes increase and A is a normal good, what would we expect?
We would expect to see a movement from point A to
point C
When the demand for good A increases, what happens in the market for the good?
The equilibrium price rises, and equilibrium quantity increases.

Refer to Table 1.5.1. Which of the following statements is correct?
Potatoes and rice are
substitutes in both regions.
Consumers view turnips as an inferior good. What change occurs in the market for turnips when consumers' income increases?
The equilibrium price falls, and the quantity decreases.
When the supply of good A decreases, what happens in the market for the good?
The equilibrium price rises, and the equilibrium quantity decreases.

Refer to Table 1.5.2. What is the market equilibrium?
The equilibrium price is $________ per heater and the equilibrium quantity is ________ heaters per month.
60; 400

Refer to Table 1.5.3. What is the market equilibrium?
The equilibrium price is $________ per cup and the equilibrium quantity is ________ cups a day.
1.10; 800
The demand curve for knobs is P = 75 – 6QD and the supply curve for knobs is P = 35 + 2QS. What is the equilibrium price of a knob
$45
The y- axis intercept of the supply curve is 40 and the slope is 6. What is the equation of the supply curve?
P = 40 + 6QS
The y- axis intercept of the demand curve is 60 and the slope is –8. What is the equation of the demand curve?
P = 60 - 8QD
The demand curve is P = 700 – 10QD. The supply curve is P = 400 + 5QS. What are the quantity and price at the market equilibrium?
The equilibrium quantity is ________ and the equilibrium price is ________.
20; 500
The demand curve is P = 700 – 20QD. The supply curve is P = 300 + 20QS. What are the quantity and price at the market equilibrium?
The equilibrium quantity is ________ and the equilibrium price is ________.
10; 500
The demand curve is P = 800 - 25QD. The supply curve is P = 500 + 25QS. What are the quantity and price at the market equilibrium?
The equilibrium quantity is ________ and the equilibrium price is ________.
6.0; 650
he price at which sellers are not willing to supply a good is $700 per unit. If the supply curve passes through the point (3,718), what is the equation of the supply curve?
P = 700 + 6QS
The price at which sellers are not willing to supply a good is $70 a unit. As the quantity supplied of the good increases by one unit, the minimum price at which someone is willing to sell that unit increases by $5. What is the equation of this supply curve?
P = 70 + 5QS
The price at which buyers are not willing to buy a good is $80 a unit. As the quantity demanded of the good increases by one unit, the maximum price at which someone is willing to buy that unit decreases by $5. What is the equation of the demand curve?
P = 80 – 5QD
A demand curve has a y-axis intercept of 100 and passes through the point (5,20). What is the equation of the demand curve?
P = 100 – 16QD