Statistics Units #1 - #4 : Midterm
 Call Kai
 Learn
 Practice Test
 Spaced Repetition
 Match
 Flashcards
 Knowt Play
1/161

There's no tags or description
Looks like no tags are added yet.
162 Terms
Statistics
Set of methods for obtaining, organizing, summarizing, presenting and analyzing data
Where does data come from?
Characteristics measured on individuals or units
ex: People, animals, things, etc.
Population
The totality of individuals about which we want information.
Sample
A subset of the units in a population that we actually examine in order to gather information.
Variable
A characteristic or property of an individual
ex: Time, distance, color, grade, etc.
Categorical Data
Represent values of categorical variables that place individuals into one of several groups.
What are the two types of categorical data?
Categorical and ordinal & Categorical and nominal
Categorical and ordinal
Ordering that makes sence for the values of a categoircal variable
Some examples:
Placing of a race (1st, 2nd, 3rd..)
Service rating at a restaurant
Letter grade in a course
Categorical and nominal
Categories with no natural order
Some examples:
Eye color (blue, green, brown…)
Blood type
gender
Quantitate Data
Represent values of quantitive variables for which arithmetic operations such as adding and averageing make sence.
The distribution of data tells us what?
What values a variable takes and how often it takes these values
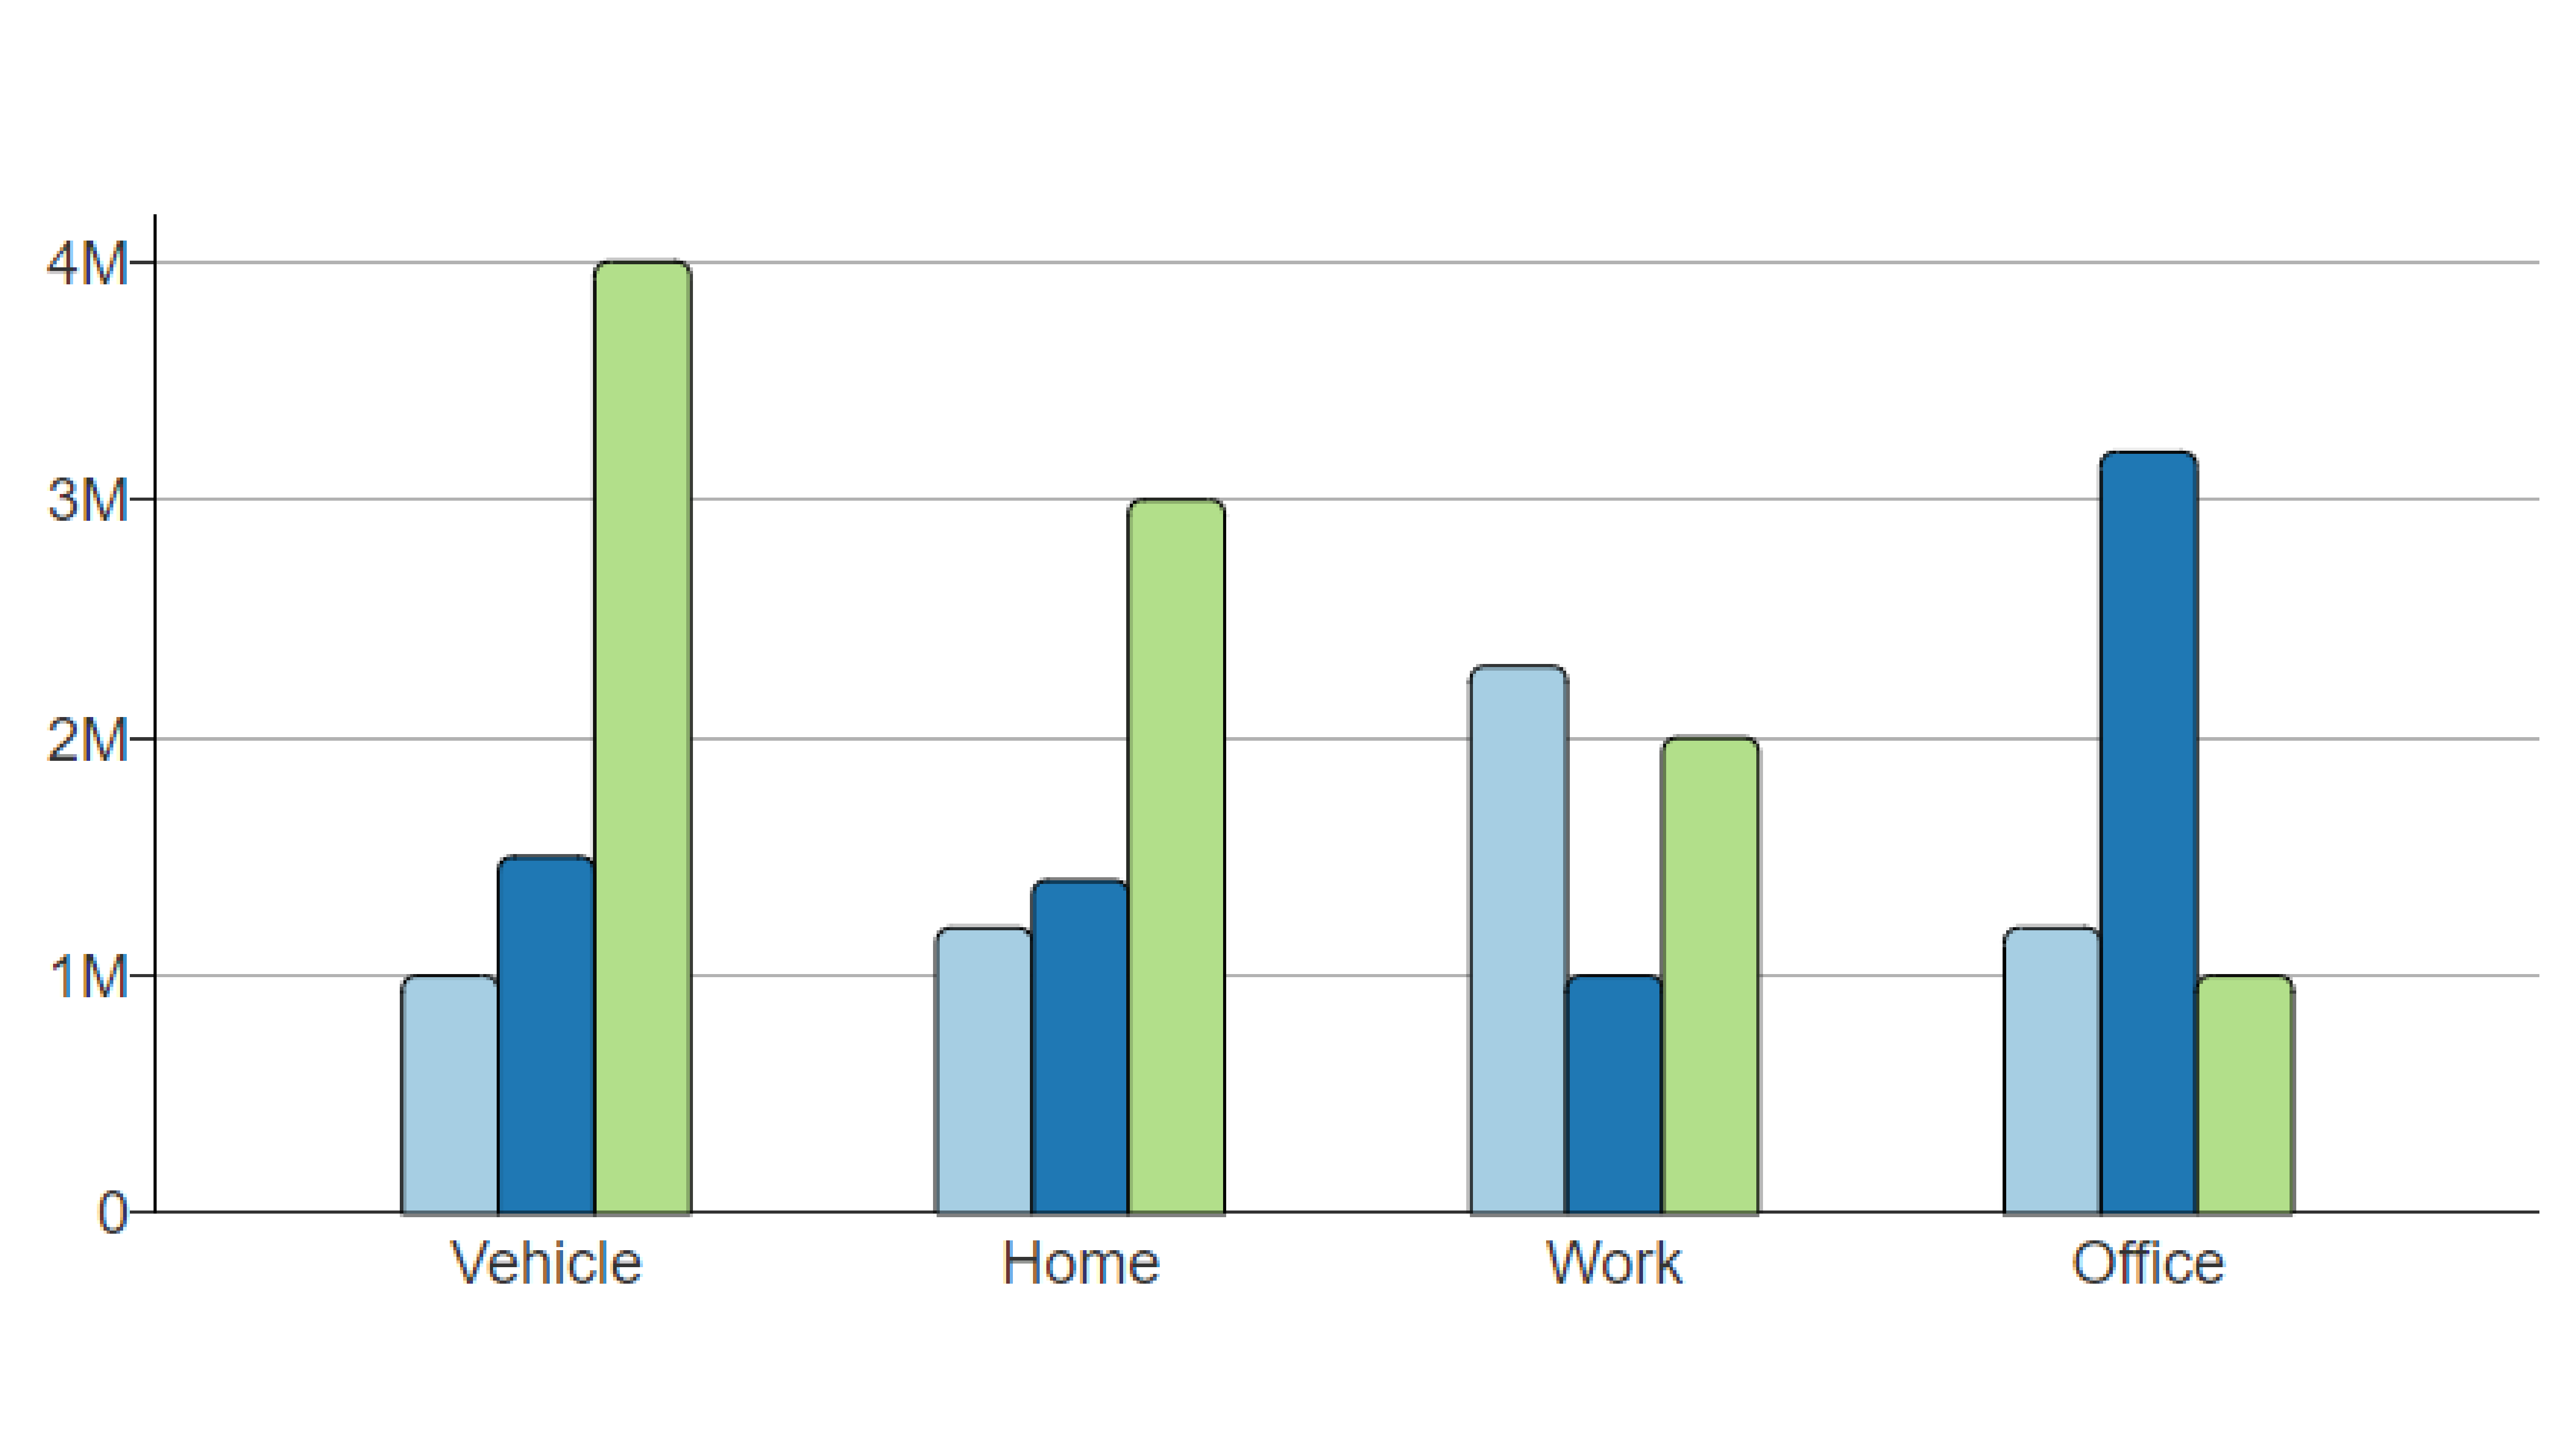
What type of data display is this?
Bar Chart
Bar chart definition
Display categorical variable values on one axis and frequencies on the other.

What type of data displace is this?
Pie chart
Pie Chart definition
Give a visual representation of the relative frequency of the observed values for a categorical variable.
Frequency Distribution
A count of how many of the data values fall into various predetermined classes or intervals.
What must the frequency distribution contain?
The first interval must include the minimal
The last interval must include the maximum
All intervals should be of equal length
Have continuity of data ( making sure there can be a data point in the variables)
What are the types quantitative variables?
Continuous and Discrete variable
Continuous variable
Can take any value within a given range
ex: weight, height, age, distance
Discrete variable
Can only take certain values
ex: number of children in a family, number of days of rain in a month, etc.
Relative frequency/ Proportions
Are the values between zero and one, inclusive, and are decimal representations of fractions, which convert to percentages.
It can be found by dividing the number of data values in each interval by the total number ofdata values.
Histogram
Graph that shows the count or proportion of quantitative data values within different intervals.
Used when we need to work with a large amount of data
Form of bar graph
Vertical axis is the frequency where the horizontal axis is the number
What does the base of each rectangle of the histogram represent?
Represents the length of the interval (all have to be of equal length).
What does the height of each rectangle of the histogram represent?
Represents the frequency of data values falling in the corresponding interval.
Symmetric distribution
If the center divides into two approximate mirror images
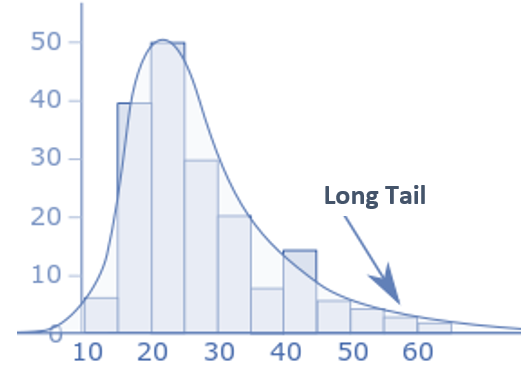
Skewed to the right
If the right side of the histogram extends much further out than the left side.
What is the long end of the graph called?
(hint its the opposite of the head of the coin)
The tail
The direction of the skewness is the direction of the tail (horizontal)
Tail falls on the left side - left skewedness
Tail falls on the right side - right skewedness

Skewed to the left
If the Left side of the histogram extends much further out than the right side.

For vertical histograms
Tail goes high - right skewedness
Tail goes low - left skewedness
Time Plots
Used for plotting time series data
Time is plotted on the x-axis
Variable values are plotted on the y-axis
Data values are represented by points, which are connected to better illustrate the pattern or trend
Trend
The overall pattern of a time plot
What two important features of a data set?
Location and variability
Location
Determined by where the center of the data falls.
Mode
Most frequently observed data value (the most common)
Median
The middle value in an ordered data set.
resistant to the effect of outliers
Outliers
Extreme values in a data set
Mean
Also known as the average
Is found by adding all of the data values then dividing by n
Not resistant to outliers
Doesn’t account for outliers; therefore accounting for all data
In a symmetric distribution what are the mean and median?
The mean and median are equal.
In a skewed distribution where is mean ?
The mean is closer to the tail
Skewed right - mean is greater than the median
Skewed left - the mean is less than the median
Weighted mean
A mean where some data values are given more importance than others
Variablility
How spread out the data values are.
What are the measures of variability?
Range and Interquartile range
Range
The maximum - the minimum of a data set
Interquartile Range
Measures the length of an interval which covers the middle 50% of the ordered observations.. it doesn’t consider outliers
First quartile (Q1)
The ordered observation such that at least 25% of the data are small or smaller
At least 75% of the values are as large or larger
25th precentile
Third quartile (Q3)
The ordered observation such that least 75% of the data values are as small or smaller
At least 25% of the values are large or larger
75th precentile
Second quartile (Q2)
The median of a data set
Precentile
Ordered observation that at least p% of the data values are as small or smaller and at least (100-p%) of the values are as large or larger
The Five-Number Summary
The minimum, Q1, the median, Q3, and the maximum
Divides the data into four equal parts
Describes the center, shape, and spread of data

Quantile boxplot
Consists of
a line at the median
a box that covers the IQR
Lines (“Whiskers”) that extend from the box to the minimum and maximum
Side-by-Side Boxplots
plotting the same variable for samples representing different populations
enable us to compare the distributions with respect to center, shape and spread
must be constructed to scale to legitimize the comparison
Outlier boxplots
A modified boxplot that takes extreme observations into account
The five lines correspond to the values in the five-number summary
the middle three lines (the box are the same for a regular boxplot
The lines coming out from the box (whiskers) don’t extend out to the minimum and maximum values
anything beyond the fences is an outlier (the “new” max and min values)
Sample variability
Loosely thought of the “average squared deviation” from the mean
Standard Deviation
The positive square root of the variance
The units are the same as the units for individual observations
easy to interpret
It is NOT the average deviation from the mean
When we are interested in in examining relationships the relationship between two variables, what two situations might we find ourselves?
Might be interested in the nature of the relationship
One of the variables may be thought to explain or predict the other
Response variable
Takes values representing the outcome of the study
Denoted by y
Explanatory variable
Helps explain the outcome of the study
denoted by x
Scatterplot
Display the values of two different quantitate variables measured on the same variables
The data for each individual appear as a single point
What is the best way to display the relationship between two quantitative variables?
With a scatterplot
Four things to look at when examining a scatterplot:
Direction
Form
Strength → Strength (count's)
Outliers
Direction of a scatterplot
Positive association → dots generally go from left to right.
as one variable increases, the other does too
Negative association → dots generally go down from left to right
Form of a scatterplot
Linear line would show the relationship between the variables
the more linear, the stronger the relationship
Strength of a scatterplot
Determined by how close the points lie to a simple form such as a straight line
The closer the points fall to the line, the stronger the relationship
Outliers of a scatterplot
Dots that stand appart or dont fit witithin a pattern
In the x direction → the dot is unusually far left or right
In the y direction → the dot is unusually high or low
General direction → the dot doent follow the patter of the other dots, even if the x and y values aren’t unusualy high or low
Correlation
A numerical measure that will give a concrete description of the strength of a linear relationship between two quantitative variables
A function of several measures that are affected by outliers → r is strongly affected by outliers
Correlation coefficient
r measures the direction and strength of a linear relationship between two quantitative values
Association does______ imply causation!!!
NOT
Lurking variable
A variable that helps explain the relationship between variables in a study, but is not itself included in the study.
Properties of correlation
Positive values of r = positive association
Negative values of r = negative association
r falls between -1 and 1 → inclusive
r close to -1 or 1 → strong linear association
r close to 0 → weak linear relationship
Does r (correlation) have units?
No it does not, it is just a number
changing the units has no effect on it
What does r (correlation) measure?
It measures only the strength of a linear relationship
Regression line
A straight line that describes how a response variable Y changes as an explanatory variable X changes.
Used to predict values of Y for given values of X. The line should lie as close to the points as possible in the vertical direction
What do we always have in regression?
An explanatory vairable X and a response variable Y

What is this?
The predicted value of Y for a given value of X
b0
The intercept of the line and b1 is the slope
Least squares regression line
Minimizes the sum of squared deviations in the vertical direction
The slop of a regression line (b1)
The predicted change in y when x increases by one unit
The intercept of the regression line (b0)
The predicted value of y when x = 0
Coefficient of determination r2
It is the fraction of variation in Y that is accounted for by its regression on X → a precentage
is between 0 and 1
if r = -1 or 1 → r2 = 1
if r = 0 → r2 = 0
r2 can also be called…
Fraction of variation or precent variation

The predicted value of Y
Is the prediction using the line and equation to uptrain a predicted value
Residuals
The sum of squared residuals that is minimized in calculation the least squares regression line
For an observation reflects the error of our prediction
= actual value of y - predicted value of y
Positive → a point falls above the regression line
Negative → a point falls below the regression line
Extrapolation
The process of predicting a value of y for a value of x outside the range of data
Outliers affect on the regression line
In the y-direction → don’t typically have a strong effect
Not an outlier in either the x or y-direction but falls outside the pattern of points → typically don’t have a strong effect - a bivariate outlier
In the x-direction → strong effect
Influential observations
It is if removing it from the data set would dramatically alter the position of the regression line and the value of r2
What is the best way to avoid lurking variables?
To preform a randomized experiment rather than an observational study

Categorical variables on a scatterplot
Though data plotted on the scatterplot is not linear, but groups can be made from it
ex male and female golfers
Sampling
The process of collecting data form a sample to draw conclusions about a problem
Voluntary response sample
Sampling method used where individuals choose to participate in a study
ex: An anchorman on the 6:00 news asks a question that individuals can answer via Facebook
Are voluntary response samples reliable?
No! They are almost always unreliable and should be avoided if possible.
Convenience sample
Type of sample chooses individuals whoever is easiest to reach
ex: interviewer asking questions in a mall
both voluntary response samples and convenience samples are
Biased
The design of a study is biased if it…
Systematically favors certain outcomes over others or the methodology used systematically favors certain outcomes
Simple random sampling (SRS)
Size n consists of n individuals from a population chosen in such a way that every group of n individuals has an equal chance of being the sample actually selected
Each individual has an equal chance of being selected into the sample
Choosing a sample to “put names into a hat” and choose a n of them
Without replacement is one where we don’t put someone’s name back into the hat after each draw
A process is called random if…
If it has two or more possible outcomes with a known probability of being observed
A computer software is used to randomly select a sample if and when what?
A population is very large → not being realistic to put everone’’s name in a hat
Stratum
A group of individuals who are similar i ways expected to affect their response
Within each of the strata, we take an SRS of size ni
Stratification
Ensure we get diversification but also select how many individuals are wanted from each group
We need to select some individuals from each stratum → not required to select the same sample size from each stratum
Stratified random sampling
The population is divided into strata, and a random sample is taken from each group, often in proportion to the group’s size