EEMB 120 Midterm 2 Terms
 Call Kai
 Learn
 Practice Test
 Spaced Repetition
 Match
 Flashcards
 Knowt Play
1/84

Earn XP
Description and Tags
UCSB
85 Terms
age distribution
calculated difference in proportion of individuals in each age class; assumes difference in mortality
birthrate
number of young produced per female in period of time
clutch size
amount of offspring per reproductive cycle
cohort
group of animals of the same species, identified by a common characteristic
cohort life table
identify individuals born of same time & keep records from birth
colonization cycle
dynamic interplay between dispersal of two or more locations within an environment, inclusive of reproductive trends that may affect populations
drift
active or passive downstream movement of stream organisms
fecundity schedule
tabulation of birth rates for females in different ages in a population
geometric rate of increase (λ)
the ratio of the population size at two points in time; λ = Nt+1/Nt
metapopulation
group of subpopulations connected by exchange of individuals
net reproductive rate (R0)
the average number of female offspring produced by an individual female in a population during her lifetime
per capita rate of increase (r)
equals per capita birth rate minus per capita death rate; r = lnR0/T or r = b-d
population dynamics
concerned with factors influencing expansion, decline, and maintenance of populations
stable age distribution
birth rate and death rate are equal

static life table
record age at death of individuals
subpopulation
portion of a larger population, with which it sustains a connection through immigration and emigration
survivorship curve
summarizes pattern of survival in population; patterns vary between species
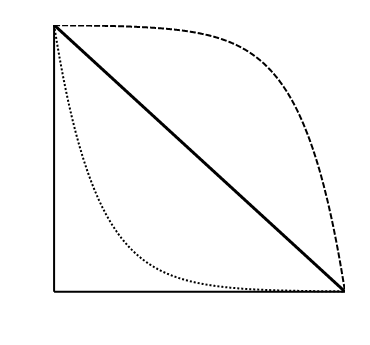
type I survivorship curve
convex curve; late loss, high surivorship throughout life, majority reaches maturity, typical of k-selected species (i.e. elephants, humans, annual plants)
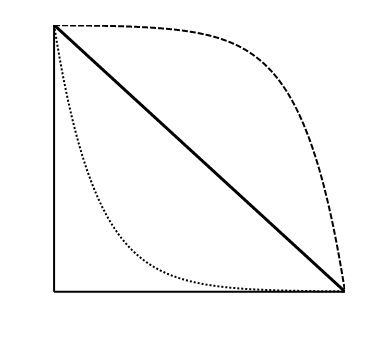
type II survivorship curve
diagonal curve; constant loss, independent of age (i.e. birds, rodents, Hydra, perennial plants)

type III survivorship curve
concave curve; early loss, low mortality rate after maturity, typical of r-selected species (i.e. oysters, small fishes, trees)
carrying capacity (K)
maximum number of individuals area is able to support
density-dependent factor
affected by population density, often biotic factors
density-independent factor
not affected by population density, often abiotic factors
exponential population growth
population growth that produces a J-shaped pattern of population increase; the change in numbers with time is the product of the per capita rate of increase, r, and population size, N
geometric population growth
population growth in which generations do not overlap and in which successive generations differ in size by a constant ratio
intrinsic rate of increase
per capita rate of increase attained when birthrates, death rates, and age structures are stable; rmax
logistic equation
equation for sigmoidal population growth; dN/dt = rmaxN (K − N|K)
logistic population growth
pattern of growth that produces a sigmoidal, or S-shaped, population growth curve; population size levels off at carrying capacity
sigmoidal population growth curve
an S-shaped pattern of population growth, with population size leveling off at the carrying capacity of the environment
allopatric
two species occur apart from each other
amensalism
one organism harmed with no impact on other (-/0); rare because usually energetic cost of borth organisms
character displacement
two species differing more in areas where they co-occur than in areas where their distributions do not overlap
competition coefficients
coefficient expressing the magnitude of the negative effect of individuals of one species on individuals of a second species
commensalism
one species benefits from association, other neither benefits nor harmed (+/0)
competitive exclusion principle
proposes that two species with identical niches cannot coexist indefinitely, which leads to the prediction that coexisting species will have different niches
granivore
rodents that feed chiefly on seeds
interference competition
direct interactions between individuals; can occur in cases of resource limitation (i.e. aggressive territory defense, production of chemical toxcins, reducing access to recources, etc)
interspecific competition
competition between individuals of two species; reduces fitness of both
intraspecific competition
competition with members of own species
isoclines of zero population growth (ZPG)
curves that show all combinations of two species’ population sizes where one species’ population does not change (growth = 0)
-2/3 thinning rule
a rule resulting from the observation that plotting the average weight of individual plants in a stand against density often produces a line with an average slope of approximately −3/2
mutualism
association between organisms of two different species in which each benefits (+/+)
niche partitioning
an evolutionary process whereby organisms decrease direct competition by differentiating in their use of resources by altering which, how, or when resources are used
parasitism
symbiotic association in which one species benefits at expense of other
resource competition
individuals compete through their dependence on the same limiting resources
resource limitation
limitation of population growth by resource availability
self-thinning
reduction in population density as a stand of plant increases in biomass, due to intraspecific competition
sympatric
describes the condition in which populations or species have overlapping geographic ranges
combined response
combined effect of functional and numerical responses by consumers on prey populations; determined by multiplying the number of prey eaten per predator times the number of predators per unit area, giving the number of prey eaten per unit area; generally expressed as percentage of total number of prey
exploitation
interaction that enhances fitness of one individual while reducing fitness of exploited individual
negative phototaxis
movement of an organism away from light
parasite
organism that lives in or on another organism (host) deriving benefits from it; reduces host fitness, generally does not kill
parasitoid
an insect whose larva consumes its host and kills it in the process; functionally equivalent to predators
pathogen
any organism that induces disease (debilitating condition) in their hosts (i.e. viruses, bacteria, protozoans)
positive phototaxis
organism moves towards the light
predator
organism that consumes another organism
predator satiation
defensive tactic in which prey reduce individual probability of being eaten by occurring at very high densities; can only eat so many prey
prey-dependent functional response
functional response in which rate of feeding by a predator is a function of prey population size only
ratio-dependent functional response
functional response in which the rate of feeding by a predator is a function of the ratio of prey population size to predator population size, that is, the number of prey per predator
arbuscular mycorrhizal fungi
fungus inside the plant
arbuscule
exchange site of fungus
balanced growth
cell growth in which all cell constituents, such as nitrogen, carbon, and DNA, increase at approximately the same rate
commensalism
interaction between two species in which one species is benefited and other is neither benefited nor harmed (+/0)
ectomycorrhizae
outside of the plant/roots
extrafloral nectar
sugar-rich liquid from nectaries
facultative mutualism
species can live without its mutualistic partner
mutualism
interactions between individuals of different species that benefit both partners
hyphae
fungal filaments
mycorrhizae
mutualistic association between fungi and the roots of plants
obligate mutualism
species dependent on mutualistic relationship
selection coefficient
relative selective costs associated with being a successful mutualist, or an unsuccessful mutualist, or a nonmutualist
vesicle
energy storage organs in fungi
community
association of interacting species inhabiting some defined area
community structure
attributes such as the number of species, the relative abundance of species, and the kinds of species comprising a community
DNA barcoding
genetic analysis tool that involves sequencing the same small region of DNA across many individuals
equilibrium
when environmental conditions remain relatively stable
guild
group of organisms that all make their living in similar way
intermediate disturbance hypothesis
predicts that intermediate levels of disturbance foster higher levels of diversity
life-form
combination of structure and growth dynamics of plant (similar to guild)
lognormal distribution
distribution of relative abundances of species produced by plotting the abundance of species as a frequency distribution in which each abundance interval is twice the preceding one, 1, 2, 4, 8, etc.; the result follows an approximately normal distribution
rank-abundance curve
portray relative abundance and species diversity within community by plotting relative abundance of species against their rank in abundance
species diversity
measure of diversity that increases with species evenness and species richness
species evenness
relative abundance of species
species richness
number of species in a community
species rarefaction
type of model that defines the number of samples likely needed to record all or almost all species at a location of interest