FS 254 Test 2
 Call Kai
 Learn
Learn Practice Test
 Spaced Repetition
 Match
Match Flashcards
 Knowt Play
1/15

There's no tags or description
Looks like no tags are added yet.
Name | Mastery | Learn | Test | Matching | Spaced | Call with Kai | Chat |
|---|
No analytics yet
Send a link to your students to track their progress
16 Terms
Census
Data gathered from entire population (complete enumeration)
Very expensive, a lot of time, not always practical, even biased
Census only on small or highly available populations
Scale complexity

Bias, accuracy & precision
Bias is the difference between the mean of the measured values & the true value
Accuracy is how close the measured values are to the true value
Precision is how close the the measured values are to their own mean
Biased estimate can be precise but not accurate
Statistical inference & sampling
the theory, methods, and practice of forming judgments about population parameters and statistical relationships, typically based on random sampling
Sampling has confidence limits, which describes how precise the estimate is to the entire population
goal of sampling is to acquire required amount of info about a population at minimum cost
Sampling design & sampling frame
method of selecting sample units
list of all possible units to be included in sample
Standard deviation & variance
s2 = Σ(x-x̄)2 / n-1
Variance is standard deviation squared
variance = s2 AKA σ2
t-value formula
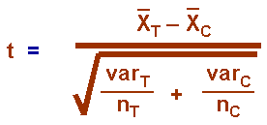
Absolute error t-value formula
CM = t * sqrt( VM / n )
CM is absolute error, t is t-value given, VM is sample variance given (s2), n is sample size given
Solving question: Calculate CM of each t-value (which is related to respective confidence level), then write as “sample mean + CM m3” and check if each respective abs error has the actual mean in its bounds
Improving t-value
Larger sample size
Use more efficient sampling technique
Sampling error & sampling observation error
inherent inability of sample to provide totally accurate information about population parameter of interest
sample size or design reduces this error
errors in the measurements made
sample size and design not relevant
Simple random sampling
selecting units entirely at random without being influenced by any other unit
Calculating mean DBH from SRS: x̄ = Σx / n
simple mean
n = (ts / E)2, minimum sample size
sx̄ = sqrt( s2 / n )
Systematic sampling
selects sample units in a predictable way, such as on a regular grid pattern, but it requires a truly random start point to be effective
if pattern coincides with natural periodicity then large errors can occur
Stratified random sampling
population sub-divided into homogeneous strata to minimize variation within those strata relative to total population variance
Calculating mean DBH from stratified sample: each strata’s mean given a weighting, then x̄ = Σpix̄i
multiply each mean by its weight then sum
StratRS optimal plot allocation
Optimal plot allocation involves allocating more plots to strata that are highly variable & fewer to uniform stratum:
ni = (Aisi / ΣAisi) * n, where Ai is plot area, si is plot sd, n is total sample size
calculates weight of each strata, where variable stratum recieve higher weight
Standard error of stratified mean
sx̄ = sqrt( ΣAi2 sx̄i2 / A2 )
area of plot squared times standard area of mean of plot, summed, then divided by total area squared, then square-rooted
Cluster sample mean
400-row segments of equal tree number, but different mortality rate. Census impractical so 20 random rows selected. Simple mean then calculated.
True average number trees per row (cluster) not known it is estimated simply by dividing sampled trees by number of sample rows