ECON 101 - Midterm Exam #1
 Call Kai
 Learn
Learn Practice Test
 Spaced Repetition
 Match
Match Flashcards
 Knowt Play
1/197

There's no tags or description
Looks like no tags are added yet.
Name | Mastery | Learn | Test | Matching | Spaced | Call with Kai | Chat |
|---|
No analytics yet
Send a link to your students to track their progress
198 Terms
(Lesson 1 Lecture Notes) Economics is a ______ _______ that studies ___ ________ ______ ____ in order to _______ _____ ____/_____, given ______ __________.
social science
the choices people make
satisfy their needs/want
scarce resources
(Lesson 1 Lecture Notes) The two branches of economics are…
Microeconomics
Macroeconomics
(Lesson 1 Lecture Notes) The Two Branches of Economics
What is MICROECONOMICS?
the study of how households and businesses make choices, how they interact in markets, and how the government attempts to influence their choice
(Lesson 1 Lecture Notes) The Two Branches of Economics
What is MACROECONOMICS?
the study of how the individuals, firms and markets, or the economy, function together as a whole
(Lesson 1 Lecture Notes) Four Core Principles of Economics
What is the OPPORTUNITY COST PRINCIPLE (or what?)?
People must make choices and therefore face tradeoffs because resources are scarce.
The true cost of something includes: its opportunity cost (the value of one’s next best alternative)
(Lesson 1 Lecture Notes) Four Core Principles of Economics
What is the COST-BENEFIT PRINCIPLE (does the benefit outweigh the cost?)?
Costs and benefits are incentives that shape decisions. You should always:
Evaluate the full set of costs and benefits associated with a choice
Pursue a choice only if the benefits outweigh the costs (these are rational choices)
(Lesson 1 Lecture Notes) Four Core Principles of Economics
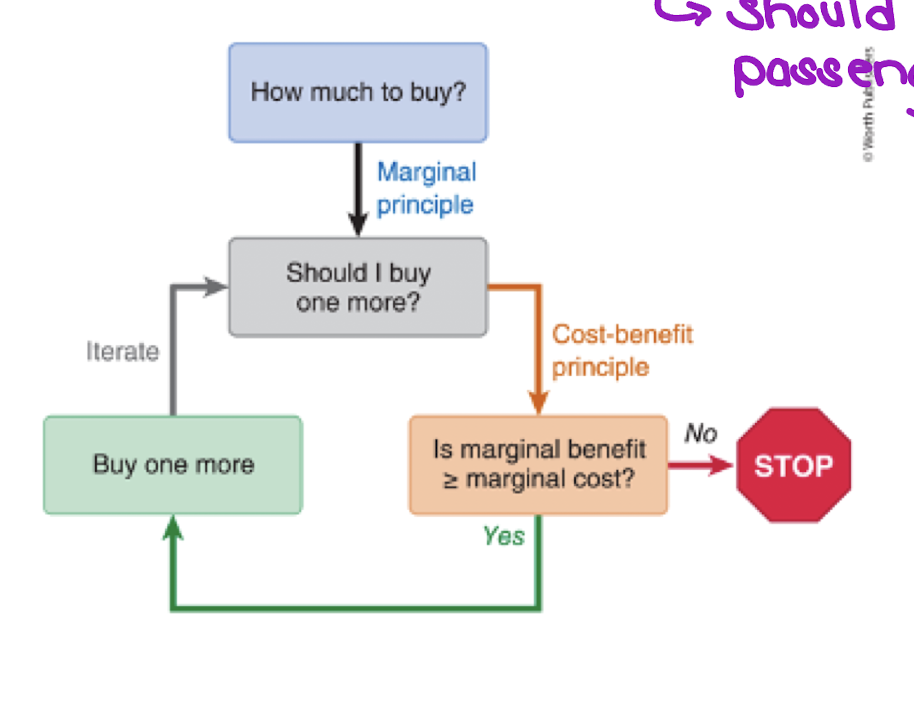
What is the MARGINAL PRINCIPLE (one more?)?
Optimal “how much” decisions are made at the margin.
Rational Rule: keep doing something until your marginal benefit equals your marginal cost
Ex> Should American Airlines offer to fly one more passenger to Dallas?
(Lesson 1 Lecture Notes) Four Core Principles of Economics
What is the INTERDEPENDENCE PRINCIPLE (what else?)?
Your best choice depends on:
your other choices
the choices others make
developments in other markets
expectations about the future
(Lesson 1 Lecture Notes) Economic Models
What is an ECONOMIC MODEL?
simplified representations of a real situation that is used to better understand real-life situations
(Lesson 1 Lecture Notes) Economic Models
What is one key component of an economic model?
simplifying assumptions
(Lesson 2: The PPF, Comparative Advantage, and Trade) Production Possibilities Frontier (PPF)
What is the PRODUCTION POSSIBILITIES FRONTIER (PPF)?
A curve showing the maximum amount one can produce given their resources and technology
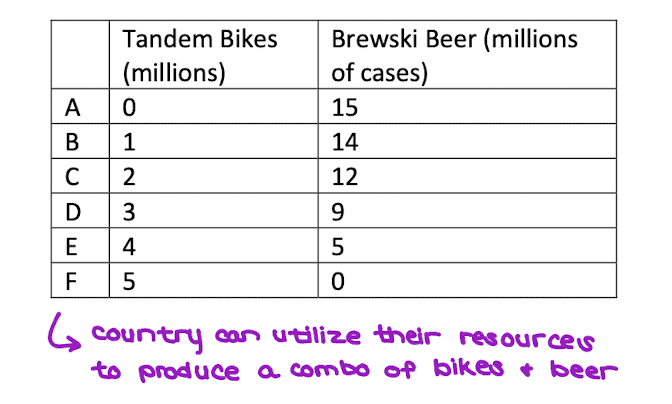
(Lesson 2: The PPF, Comparative Advantage, and Trade) Production Possibilities Frontier (PPF)
Draw the PPF for this table.

(Lesson 2: The PPF, Comparative Advantage, and Trade) Opportunity Cost
What is OPPORTUNITY COST?
The opportunity cost of producing one more unit of good x is the amount of good y you have to give up to get one more unit of good x.

(Lesson 2: The PPF, Comparative Advantage, and Trade) Extend Your Understanding
Can you calculate the opportunity cost of a bike between points A and B? What is the opportunity cost of a case of beer?
(Lesson 2: The PPF, Comparative Advantage, and Trade) The Shape of the PPF
Why does the PPF typically bow outward?
the opportunity cost of producing one more unit of any good typically inreases the more you have of that good already
(Lesson 2: The PPF, Comparative Advantage, and Trade) The Shape of the PPF
What would it mean if the PPF were linear?
Oc = constant
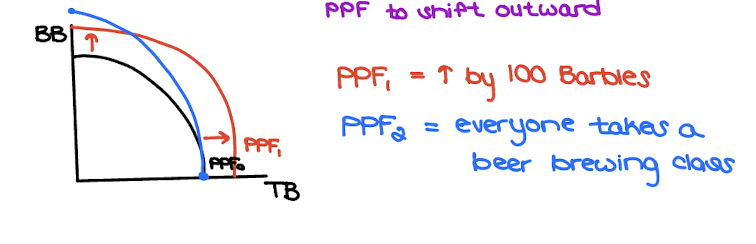
(Lesson 2: The PPF, Comparative Advantage, and Trade) Economic Growth and the PPF
Draw the effect on a PPF if there was an increase by 100 barbies and if everyone took a beer brewing class. Explain why this occurs.
Changes in technology or increased resources will cause the PPF to shift outward
(Lesson 2: The PPF, Comparative Advantage, and Trade) Theory of Comparative Advantage
What is ABSOLUTE ADVANTAGE?
the ability to produce more of a good or a service than competitors when using the same amount of resources OR the ability to produce the same amount of output using fewer inputs
(Lesson 2: The PPF, Comparative Advantage, and Trade) Theory of Comparative Advantage
What is COMPARATIVE ADVANTAGE?
the ability to produce a good or service at a lower opportunity cost than competitors
the theory of comparative advantage is one of task allocation: who should be doing what?
(Lesson 2: The PPF, Comparative Advantage, and Trade) Example
Step 1: Draw Production Possibilities Frontiers for you and your roommate.


(Lesson 2: The PPF, Comparative Advantage, and Trade) Example
Step 2: Calculate your opportunity costs and your roommates opportunity costs of baking pies and washing dishes.

(Lesson 2: The PPF, Comparative Advantage, and Trade) Example
Who has the Absolute Advantage in washing dishes? Baking pies?
Me!
(Lesson 2: The PPF, Comparative Advantage, and Trade) Example
Who has the Comparative Advantage in washing dishes? Baking pies?
Washing Dishes: roommate
Baking Pies: me
(Lesson 2: The PPF, Comparative Advantage, and Trade) Example
Assume that without trade, you decide to bake 2 pies in an hour and wash 20 dishes. Your roommate decides to bake 1 pie and wash 15 dishes. Without trade you can consume…
what you produce → production = consumption w/o trade
(Lesson 2: The PPF, Comparative Advantage, and Trade) Example
Step 3: Specialization → One should specialize in producing the good in which one has the ___________ advantage. Production with trade is when one specializes in producing one good.
comparative
(Lesson 2: The PPF, Comparative Advantage, and Trade) Example
Step 4: Trade → If two parties decide to trade, they will set the price of good x _______ _____ _ ___________ ______ (____ __ __________ ___ ____ _____ __ ____ ____ ___ _____).
between their 2 opportunity costs (must be beneficial for each party or they will not trade)
(Lesson 2: The PPF, Comparative Advantage, and Trade) Prices
To avoid having to barter, we use _____ as a ____ __ _______. For instance, if your time is worth $20 per hour and a pie costs $20, you would not be willing to buy that pie since you can bake 4 pies per hour, but if a pie costs $4, you will buy one.
money
unit of account
(Lesson 2: The PPF, Comparative Advantage, and Trade) Prices
Prices serve as… which allows…
Messages to buyers/sellers
Incentives to buyers/sellers
Bundles of info
→ This allows resources to be allocated to their most valuable uses and creates gains for all involved.
(Lesson 3 Notes: Demand, Supply, and Markets) Perfectly Competitive Markets
What are the assumptions we make about perfectly competitive markets?
All firms are selling identical goods/services (same Twix bar everywhere)
No barriers to entry (everyone can sell/buy)
Many rational buyers and sellers → everyone is a price-taker
(Lesson 3 Notes: Demand, Supply, and Markets) Perfectly Competitive Markets
What are the 2 sides of the market?
CONSUMERS/BUYERS (demand)
SELLERS/PRODUCERS/FIRMS (supply)
(Lesson 3 Notes: Demand, Supply, and Markets) Building a Demand Curve Activity
Draw a demand curve for this table.


(Lesson 3 Notes: Demand, Supply, and Markets) Demand Vocabulary
What is QUANTITY DEMANDED?
the amount of a good or service that customers are willing and able to buy at a particular price
(Lesson 3 Notes: Demand, Supply, and Markets) Demand Vocabulary
What is DEMAND?
the entire relationship between price and quantity demanded
(Lesson 3 Notes: Demand, Supply, and Markets) Demand Vocabulary
What is a DEMAND SCHEDULE?
a table that shows the relationship between the price and quantity demanded
(Lesson 3 Notes: Demand, Supply, and Markets) Demand Vocabulary
What is a DEMAND CURVE?
a curve that graphically represents the relationship between price and quantity demanded
(Lesson 3 Notes: Demand, Supply, and Markets) Demand Vocabulary
What is MARKET DEMAND?
The demand by all the consumers of a given good or service
(Lesson 3 Notes: Demand, Supply, and Markets) Demand Vocabulary
What is THE LAW OF DEMAND?
Ceteris Paribus (holding everything constant), as price increases, quantity demanded decreases
P↑ Q↓: negative relationship between p and q demanded or the demand curve is downward sloping
(Lesson 3 Notes: Demand, Supply, and Markets) Demand Vocabulary
The Law of Demand: This is due to the substitution effect and the income effect. What is the SUBSTITUTION EFFECT?
as price increases, people switch to consume relatively cheaper goods
(Lesson 3 Notes: Demand, Supply, and Markets) Demand Vocabulary
The Law of Demand: This is due to the substitution effect and the income effect. What is the INCOME EFFECT?
as price increase, people can afford less with the same amount of money
(Lesson 3 Notes: Demand, Supply, and Markets) If the price of a good changes, then ________ ________ changes / we ____ _____ the demand curve.
quantity demanded
move along

(Lesson 3 Notes: Demand, Supply, and Markets) Rational Rule for Buyers (price is given)
Explain the RATIONAL RULE FOR BUYERS.

(Lesson 3 Notes: Demand, Supply, and Markets) Changes in Demand
Draw the effect on the demand curve when demand increases and when demand decreases.

(Lesson 3 Notes: Demand, Supply, and Markets) Determinants of Demand
What are the determinants of demand?
Income
Prices of Related Goods
Tastes / Preferences
Expectations
Network Effects / Congestion Effects
# & Type of Customers
(Lesson 3 Notes: Demand, Supply, and Markets) Determinants of Demand
Explain INCOME.
if income increases, ability to pay increases
Normal Good: income increases → demand increases (Ex> restaurant Ramen)
Inferior Good: income increases → demand decreases (Ex> packet Ramen)
(Lesson 3 Notes: Demand, Supply, and Markets) Determinants of Demand
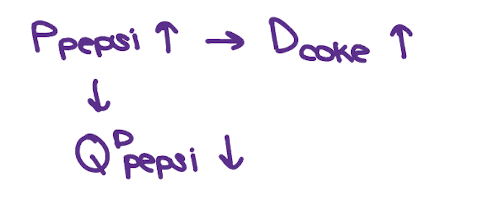
Explain PRICES OF RELATED GOODS.
Complements in Consumption:
Ex> Rum + Cake

Substitutes in Consumption:
Ex> Pepsi + Coke
(Lesson 3 Notes: Demand, Supply, and Markets) Determinants of Demand
Explain EXPECTATIONS.

(Lesson 3 Notes: Demand, Supply, and Markets) Determinants of Demand
Explain NETWORK EFFECTS / CONGESTION EFFECTS.
Network Effects: the more valuable the more people use them (Ex> Twitter → X; iPhones (less popular, less usage))
Congestion Effects: less valuable the more people use them (Ex> long amusement park line → willingness to pay to go to park decreases)
(Lesson 3 Notes: Demand, Supply, and Markets) Determinants of Demand
Explain # & TYPE OF CUSTOMERS.
more consumers = higher demand (less consumers = lower demand)
(Lesson 3 Notes: Demand, Supply, and Markets) Individual Versus Market Demand
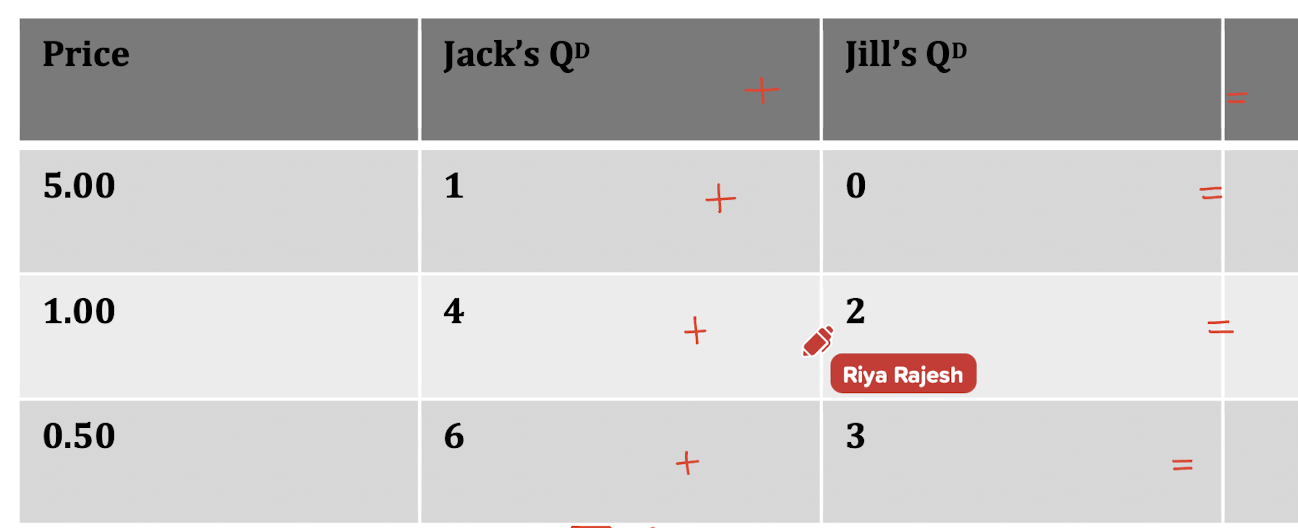
Assume there are only 2 consumers in the market for candy bars. The table below represents their individual demand for candy bars. Determine the market quantity demanded and draw the individual and market demand curves.

(Lesson 3 Notes: Demand, Supply, and Markets) Extend Your Understanding
When Apple released the iPhone 5, prices for iPhone 4 and below decreased drastically. How might this change in price of the iPhone 4 affect demand for iPhone 30-pin chargers that are only compatible with the iPhone 4 and below?
Since the price of the iPhone 4 is cheaper, its demand will increase and since the iPhone 4 and the iPhone 30-pin chargers are complementary goods, the demand of the chargers will increase too.
(Lesson 3 Notes: Demand, Supply, and Markets) Labor Supply Activity
Explain what the graph shows. Given your current class schedule and other commitments (there are 40 hours in a typical workweek, about 110 hours in a week if you sleep 8 hours per day, and 168 hours in a week maximum):

$ goes up, you’re willing to work more
(Lesson 3 Notes: Demand, Supply, and Markets) Labor Supply Activity
Explain what the graph shows.

# of people willing to sing song decreases as price goes down
(Lesson 3 Notes: Demand, Supply, and Markets) Supply Vocabulary
What is QUANTITY SUPPLIED?
The amount of a good or service that a firm is willing and able to supply at a given price
(Lesson 3 Notes: Demand, Supply, and Markets) Supply Vocabulary
What is SUPPLY?
the entire relationship between price and quantity supplied
(Lesson 3 Notes: Demand, Supply, and Markets) Supply Vocabulary
What is a SUPPLY SCHEDULE?
a table that show the relationship between the price and quantity supplied
(Lesson 3 Notes: Demand, Supply, and Markets) Supply Vocabulary
What is a SUPPLY CURVE?
the graphical representation of the relationship between price and quantity supplied
(Lesson 3 Notes: Demand, Supply, and Markets) Supply Vocabulary
What is MARKET SUPPLY?
the quantity supplied by all firms at each price
(Lesson 3 Notes: Demand, Supply, and Markets) Supply Vocabulary
Explain the RATIONAL RULE FOR SELLERS.
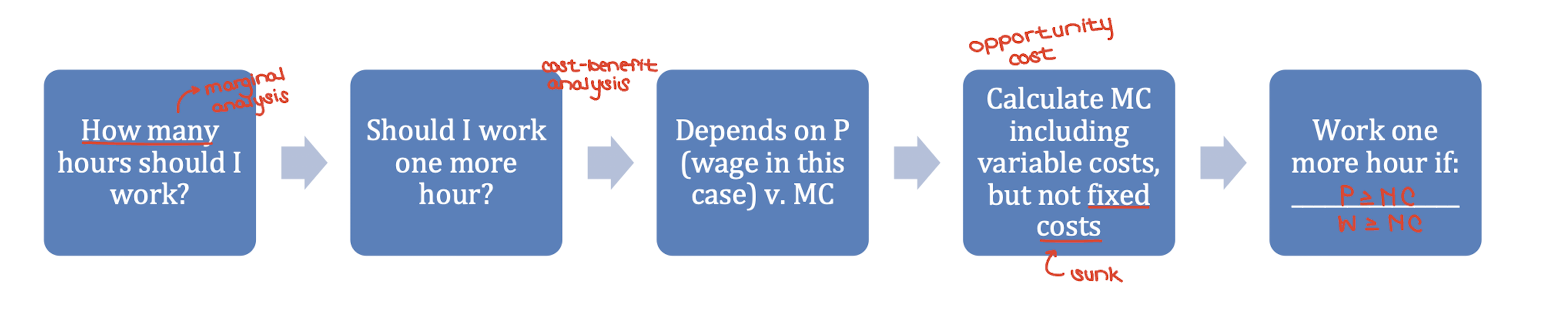
(Lesson 3 Notes: Demand, Supply, and Markets) Supply Vocabulary
What is the LAW OF SUPPLY?
Ceteris Paribus (holding everything constant), as price increases, quantity supplied increases
P↑ Qs↑: positive relationship between price and quantity or supply curve slopes upward
(Lesson 3 Notes: Demand, Supply, and Markets) Supply Vocabulary
Law of Supply: Why does supply slope upward?
higher market prices give produces a stronger incentive to make and sell more of a good to maximize their profit
(Lesson 3 Notes: Demand, Supply, and Markets) If the price of a good changes, then ________ ________ changes/we ____ _____ the supply curve.
quantity supplied
move along
(Lesson 3 Notes: Demand, Supply, and Markets) Changes in Supply
Draw the effect on the supply curve when supply increases and when supply decreases.
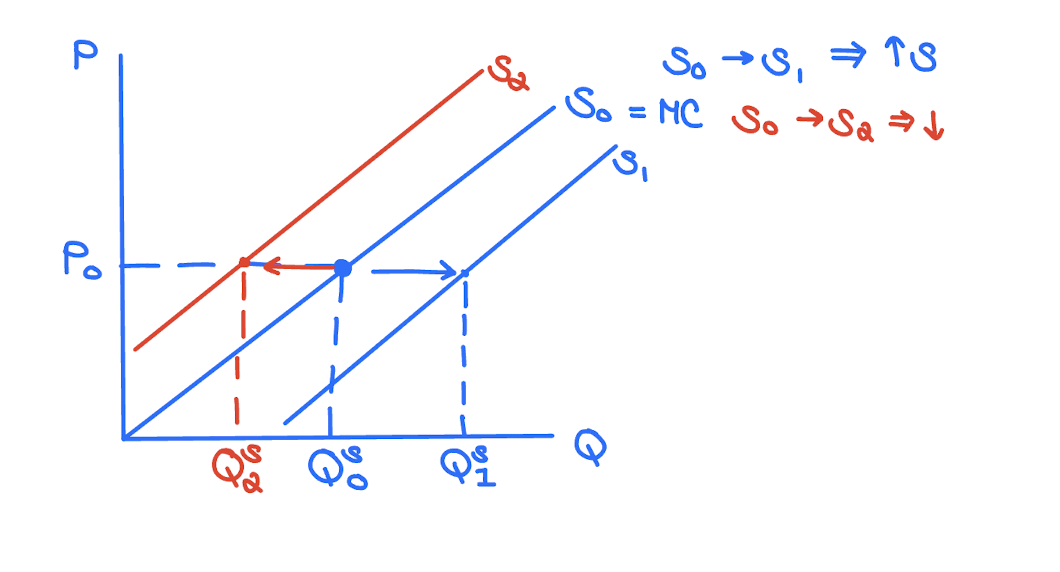
(Lesson 3 Notes: Demand, Supply, and Markets) Determinants of Supply
What are the determinants of supply?
prices of inputs
technological change / changes in human capital (knowledge + skills)
prices of complements / substitutes in production
expected future prices
# / type of sellers
(Lesson 3 Notes: Demand, Supply, and Markets) Determinants of Supply
Explain PRICES OF INPUTS.
when the price of cocoa increases, the supply of candy bars decreases
when the price of cocoa decreases, the supply of candy bars increases
(Lesson 3 Notes: Demand, Supply, and Markets) Determinants of Supply
Explain TECHNOLOGICAL CHANGE / CHANGES IN HUMAN CAPITAL.
if machine and/or workers become more productive (can produce more with same resources), marginal cost decreases and supply will increase
(Lesson 3 Notes: Demand, Supply, and Markets) Determinants of Supply
Explain PRICES OF COMPLEMENTS / SUBSTITUTES IN PRODUCTION.
Complements in Production: if the price of ice cream increases, the supply of skim milk will increase
Substitutes in Production: if the price of truffles increases, the supply of candy bars will decrease
(Lesson 3 Notes: Demand, Supply, and Markets) Determinants of Supply
Explain EXPECTED FUTURE PRICES.

(Lesson 3 Notes: Demand, Supply, and Markets) Determinants of Supply
Explain # / TYPE OF SELLERS.
when the number of sellers increases, supply will increase
(Lesson 3 Notes: Demand, Supply, and Markets) Individual Versus Market Supply (hor. sum of individual supply)
Assume there are only two firms that produce candy bars, Wonka’s and Mars’ candy companies. The table below represents their individual supply schedules. Determine the market quantity supplied and then draw the individual and market supply curves.


(Lesson 3 Notes: Demand, Supply, and Markets) Extend Your Understanding
Electronics manufacturers can either make iPhone chargers or android chargers. If the price of iPhone chargers decreases, what happens to the supply of iPhone chargers?
price of iPhone chargers decreases → quantity supplied decreases → move down/left along supply curve
supply curve itself stays in same place
(Lesson 3 Notes: Demand, Supply, and Markets) Market Equilibrium
What does it mean for a market to be in equilibrium?
demand + supply = market
when quantity demanded = quantity supplied… plans of buyers line up w/ plans of sellers
@ P*, QD = QS = Q*
(Lesson 3 Notes: Demand, Supply, and Markets) Market Equilibrium
What are the three ways to find market equilibrium?
From demand + supply schedules
at which P does QD = QS
Graphically

Algebraically
set QD and QS = and solve for P* and Q8
(Lesson 3 Notes: Demand, Supply, and Markets) Market Adjustments (The Invisible Hand)
What is P>P*?

(Lesson 3 Notes: Demand, Supply, and Markets) Market Adjustments (The Invisible Hand)
What is P<P*?

(Lesson 3 Notes: Demand, Supply, and Markets) Determining the Effect of an Event on a Market
Does the event affect supply, demand, or both?
Does this cause an increase or a decrease?
What happens to P* and Q*?
(Lesson 3 Notes: Demand, Supply, and Markets)
changes in demand = ____ direction P* & Q*
same

(Lesson 3 Notes: Demand, Supply, and Markets)
changes in supply = ____ direction P* & Q*
opposite
(Lesson 4: Economic Surplus and Efficiency) Demand & MB
Explain the difference between VALUE and PRICE.
Value: the benefit a person gets from consuming a good or service
Price: what people pay to consume a good or service
(Lesson 4: Economic Surplus and Efficiency) Demand & MB
D _ WTP (willingness to pay) _ MB (marginal benefit)
=
=
(Lesson 4: Economic Surplus and Efficiency) Demand & MB
Explain what’s shown by this graph.
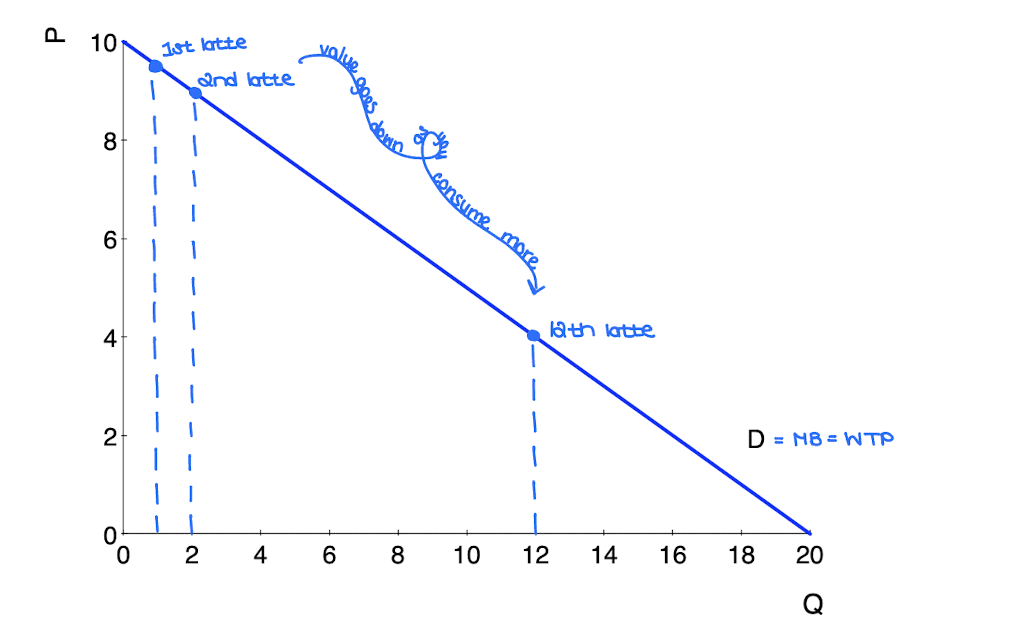
value goes down as you consume more
(Lesson 4: Economic Surplus and Efficiency) Consumer Surplus (CS)
What is CONSUMER SURPLUS?
the difference between what you are willing to pay and what you actually pay for a good/service
the area above P and below the MB curve for all goods/services consumed
CS = WTP - P or = MB - P

(Lesson 4: Economic Surplus and Efficiency) Consumer Surplus (CS)
The demand for candy bars can be represented by the following equation: P = 5 - QD/10. If P* = 1, what is the consumer surplus in the market?

(Lesson 4: Economic Surplus and Efficiency) Supply & MC
S _ MC (marginal cost)
= (firms need to sell at a price that is at least what it costs them to produce the good or service)

(Lesson 4: Economic Surplus and Efficiency) Producer Surplus (PS)
What is PRODUCER SURPLUS?
the difference between the price sellers receive for a good or service and how much it costs to make it (the difference between the lowest price a firm would be willing to accept for a good or service (MC) and the price it actually receives)
the area beneath P and above MC curve for all Q sold
PS = P - MC

(Lesson 4: Economic Surplus and Efficiency) Producer Surplus (PS)
If the supply curve for candy bars can be represented by the following equation: P = QS/40. If P* = 1, what is the producer surplus?
$20
(Lesson 4: Economic Surplus and Efficiency) Total Surplus (TS)
What is TOTAL SURPLUS?
total benefit to society from the production and consumption of a good or service
TS = CS + PS = MB - MC for all goods bought and sold
(MB - P) + (P - MC)
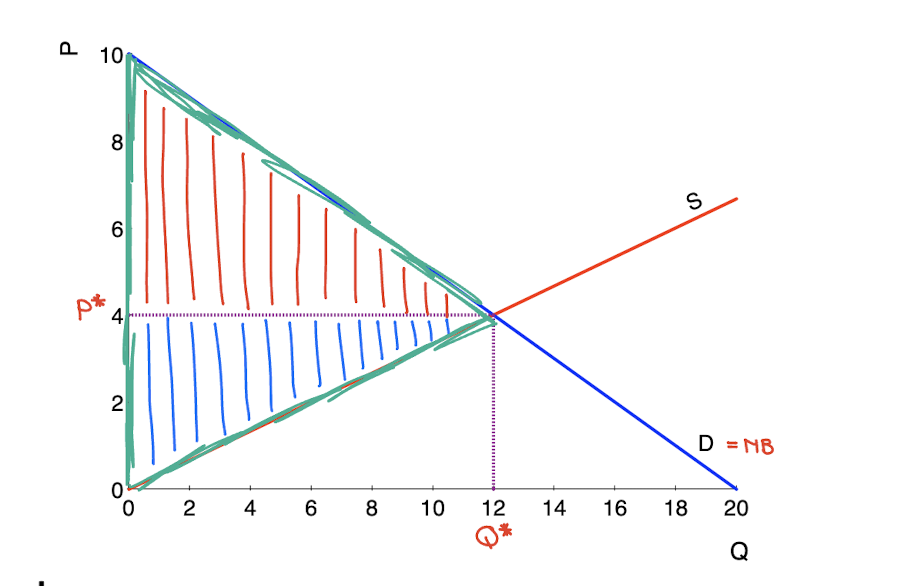
(Lesson 4: Economic Surplus and Efficiency) Example
Consider the market for candy bars represented by the supply and demand equations below: P = 5 - QD/10 & P = QS/40. What is the economic surplus in this market in equilibrium?
$100
(Lesson 4: Economic Surplus and Efficiency) The Rational Rule for Markets
Produce more of a good if its marginal benefit (MB) is _______ ____ __ _____ to its marginal cost (MC). Why?
greater than or equal
Why? → b/c MB > MC tells us economic surplus will increase if we produce more
(Lesson 4: Economic Surplus and Efficiency) Economic Efficiency
When does ECONOMIC EFFICIENCY occur?
occurs when the marginal cost of producing the last unit of a good is exactly equal to the marginal benefit from consuming it and where the economic surplus (net benefits to society) is maximized

(Lesson 4: Economic Surplus and Efficiency) Economic Efficiency
If an outcome is efficient, ________ _______ is maximized.
economic surplus
(Lesson 4: Economic Surplus and Efficiency) Economic Efficiency
Market equilibrium in a perfectly competitive market is ____________ _________ (aka ___ _________ ______).
economically efficient
the efficient outcome
(Lesson 4: Economic Surplus and Efficiency) Example
Consider the market for candy bars represented by the supply and demand equations below: P = 5 - QD/10 & P = Qs/40. If P = $2 in the market for candy bars, identify the areas that represent economic surplus.

(Lesson 4: Economic Surplus and Efficiency) Example
Consider the market for candy bars represented by the supply and demand equations below: P = 5 - QD/10 & P = Qs/40. If P = $2 in the market for candy bars, identify the areas that represent economic surplus.
Where is the quantity bought and sold (QB)?
min (QD, QS)
(Lesson 4: Economic Surplus and Efficiency) Deadweight Loss
Deadweight loss (DWL) is created when the market is ___ _________ ___ _________ _______. There is ___ whenever the market is not at the efficient outcome.
not producing the efficient quantity (DWL = TSefficient outcome - TSinefficient outcome)
DWL (DWL = MB - MC for all goods being under (or over) produced relative to the efficient Q)
(Lesson 4: Economic Surplus and Efficiency) Market Failure
Market failure occurs when the forces of supply and demand lead to an ___________ _______.
inefficient outcome
(Lesson 4: Economic Surplus and Efficiency) Market Failure
What are the five sources of market failure?
Market Power
Externalities
Private Info
Irrationality
Government Regulations (sometimes, not always)
(Lesson 4: Economic Surplus and Efficiency) Moving Forward: Evaluating Policies
What is *POSITIVE ANALYSIS?
describes what is happening, explaining why, or predicting what will happen
(Lesson 4: Economic Surplus and Efficiency) Moving Forward: Evaluating Policies
What is NORMATIVE ANALYSIS?
prescribes what SHOULD happen, which involves value judgements
(Lesson 4: Economic Surplus and Efficiency) Efficiency vs. Equity
What is EFFICIENCY?
maximizing benefits that can be created (size of pie)
(Lesson 4: Economic Surplus and Efficiency) Efficiency vs. Equity
What is EQUITY?
how pie is divided