Chapter 03 - Graphing Behavior and Measuring Change
 Call Kai
 Learn
Learn Practice Test
 Spaced Repetition
 Match
Match Flashcards
 Knowt Play
1/30

There's no tags or description
Looks like no tags are added yet.
Name | Mastery | Learn | Test | Matching | Spaced | Call with Kai | Chat |
|---|
No analytics yet
Send a link to your students to track their progress
31 Terms
Graph
a visual representation of the occurrence of a behavior over time
Helps visualize data and findings to assess levels of behavior before, during, and after treatment
Y-axis and X-axis, labels for Y and X axis, numbers on Y and X axis, data points, phase lines, phase labels
Six essential components of a behavior modification graph
Y axis label
behavior and dimension of behavior recorded
X axis label
unit of time during which the behavior was recorded
Data points
Plotted points indicating the level of the behavior that occurred at each particular time period
Phase lines
Vertical line on a graph that indicates a change in treatment (no-treatment to treatment, treatment to no-treatment, one treatment to another treatment)
Phase labels
Labels indicating the different phases of a treatment plan
Level
how high or low the data are on the y-axis - observing the _____ of behavior in baseline and treatment phases will confirm whether the treatment intervention produces the desired behavior change
Trend
exists when the behavior is increasing across a phase (increasing trend) or decreasing across the phase (decreasing trend), when no increase/decrease occurs across a phase then we say a behavior is stable
Variability
refers to how high and low the data points are away fom the mean level in the phase
Low variability
data points are all close to the mean level in the phase
High variability
data points are far above and far below the mean
Functional relationship
relationship between a behavior and an environmental event(s) in which the occurence of the behavior is controlled by the occurrence of the environmental event - demonstrated in research by altering treatment (IV) to see if any changes in behavior (DV) are demonstrated
Target behavior changes when an IV is manipulated while all other variables are held constant
IV manipulation is replicated one or more times and the behavior changes each time
Functional relationship is established if
Research design
used to determine whether a treatment (IV) was responsible for the observed change in target behavior (DV) and to rule out any extraneous variables that potentially caused the behavior change
A-B design
simplest type of graph used in behavior modification, with only a baseline phase and treatment phase
Not a real research design because there is not establishment of a functional relationship due to treatment not being replicated
Possibility for third variable to be the reason for behavioor change
A-B-A-B reversal design
extension of A-B design in which baseline and treatment phases are implimented twice
A-B-C-A-C design
variation of A-B-A-B design in which the first treatment intervention was not effective, so an alternate treatment is implemented instead
May not be ethical to remove treatment in second baseline if the behavior is dangerous (such as self-injourous behavior)
Must be fairly cerain that the level of behavior will reverse when treatment is withdrawn, otherwise a functional relationship will not be demonstrated
Considerations with A-B-A-B designs
Multiple baseline across subjects design
baseline and treatment phase that is replicated for the same target behavior of two or more subjects
Graphs - Multiple baseline across subjects design

Graphs - Changing criterion design

Graphs - Alternating Treatments Design

Graphs - AB Design
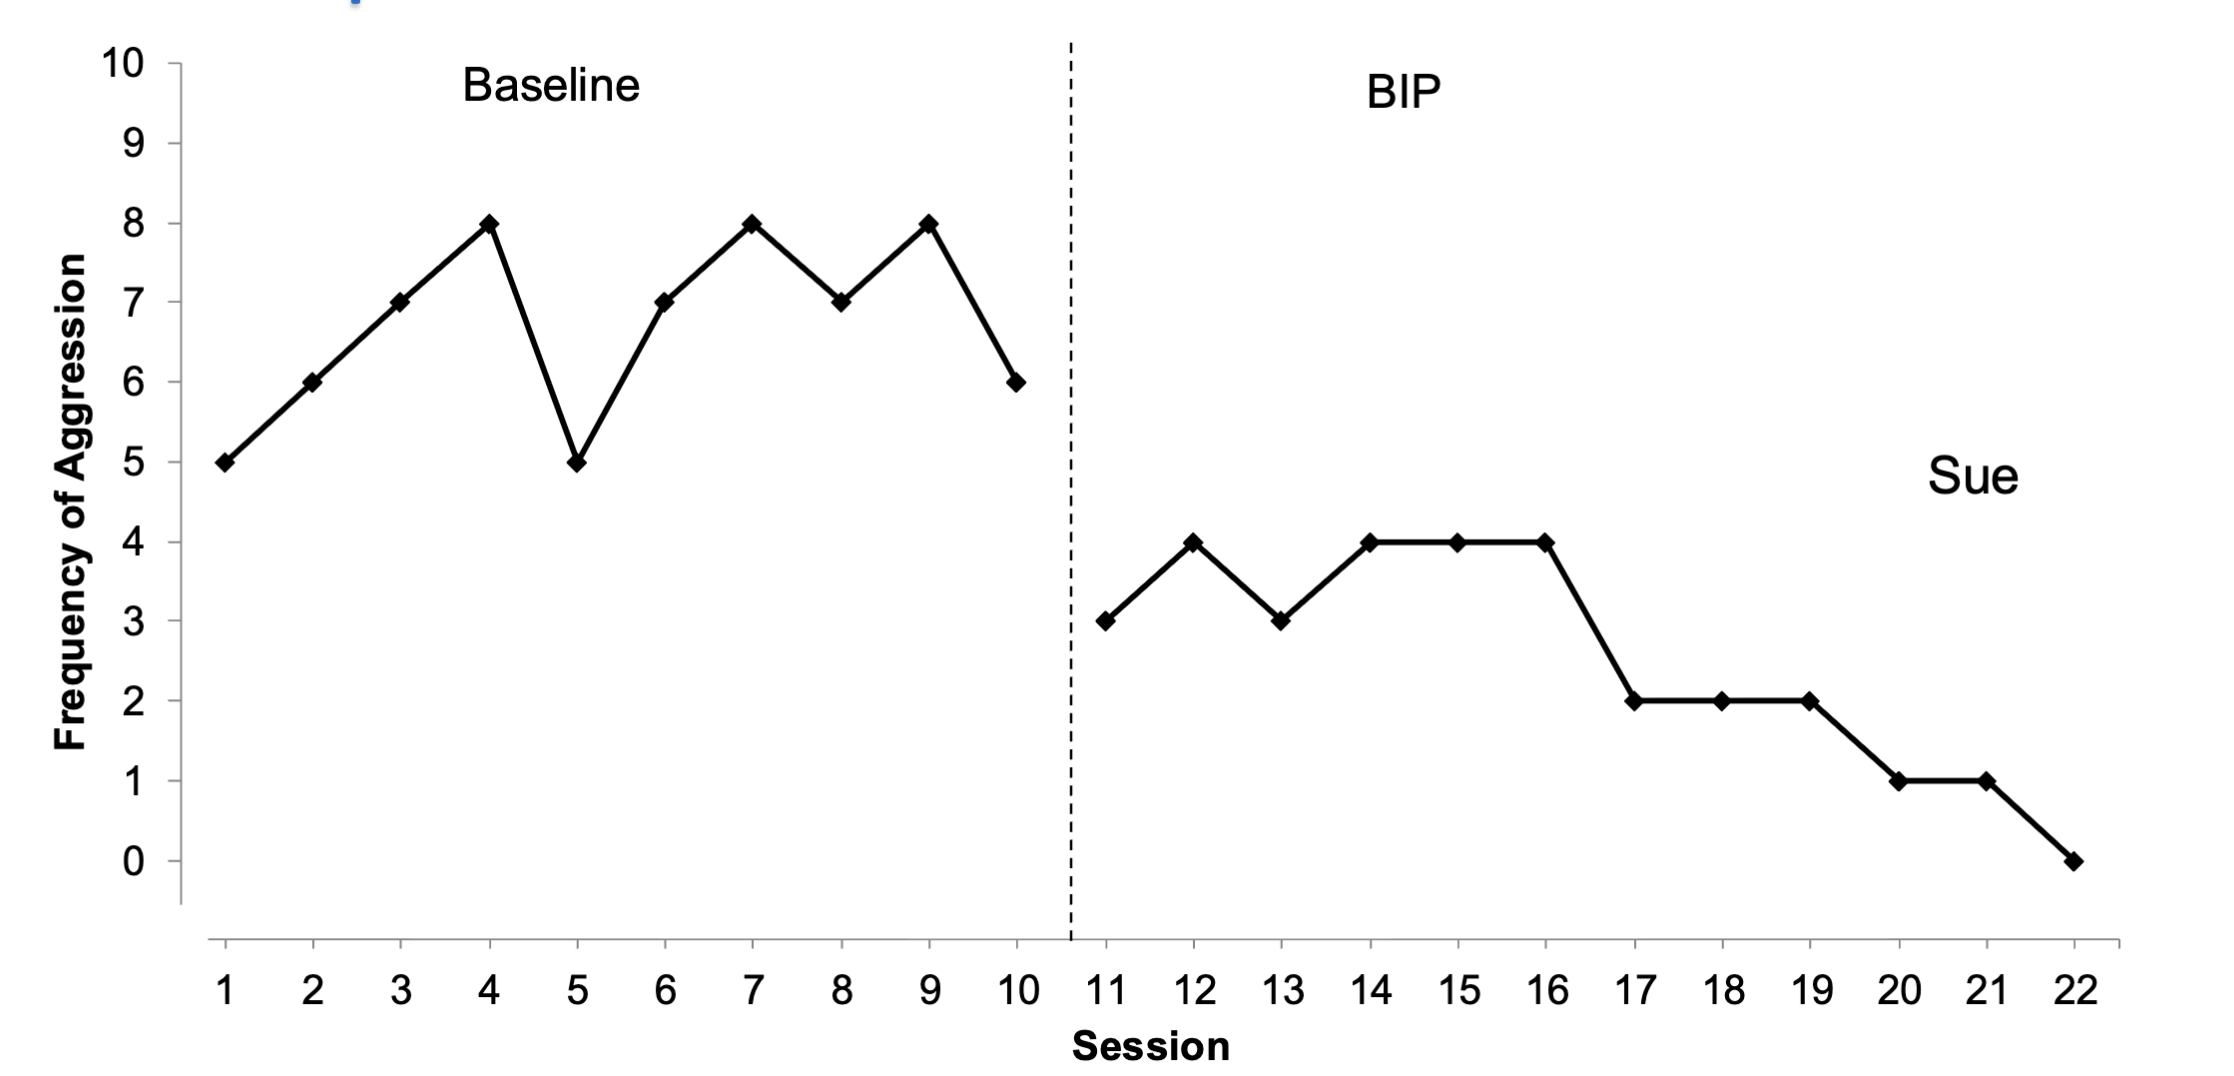
Graphs - ABAB Reversal Design

Multiple baseline across behaviors design
baseline and treatment phase replicated for two or more behaviors in the same subject
Multiple baseline across settings design
baseline and treatment phase is replicated in two or more settings w/ the same behavior in the same subject
there is interest in the same target behavior exhibited by multiple subjects
there’s more than one target behavior of the same subject
you are measuring a subjects behavior across two or more settings
Multiple baseline design may be used when
Alternating treatments design (ATD)
Baseline and treatment phases are conducted in rapid succession, typically in alternating days or sessions - baseline and treatment phases can be compared w/ each other within the same time period, there can also be multiple treatment conditions
The larger the discrepancy between the two conditions the stronger proof there is of a functional relationship between behavior and conditions
How is a functional relationship demonstrated in an alternating treatments design?
Changing Criterion Design
sequential goal/criterion levels are speficied for the behavior during treatment; a functional relationship is demonstrated if the behavior meets the criterion goal specified within treatment