Economics UNIT 3 AOS1a - intro microeconomics
 Call Kai
 Learn
Learn Practice Test
 Spaced Repetition
 Match
Match Flashcards
 Knowt Play
1/79

There's no tags or description
Looks like no tags are added yet.
Name | Mastery | Learn | Test | Matching | Spaced | Call with Kai | Chat |
|---|
No analytics yet
Send a link to your students to track their progress
80 Terms
define relative scarcity
the fundamental economic problem that arises because society’s needs and wants exceed the limited resources available to satisfy them.
define needs
G&S essential for human survival e.g. food/shelter. (inelastic)
define wants
G&S not necessary for survival but improve the quality of life e.g. entertainment/travel. (elastic)
what are resources + the main categories?
the inputs used to produce G&S. They are in limited supply. They main categories are:
Land (natural resources): raw materials from nature, including minerals, forests, water and fertile land
labor: human effort, both physical and mental used in production
capital: goods used to produce other g&s e.g. machinery, equipment and factories
define opportunity cost
the value of the next best alternative forgone when making a choice. it represents the potential benefits you miss out on when choosing one option over another
NOTE: it is not simply the monetary cost but the value of the next best alternative
define the production possibility frontier model
a graphical representation of the maximum combinations of 2 g&s that an economy can produce, given its available resources & technology, assuming fully and efficient use of those resources
PPF DIAGRAM
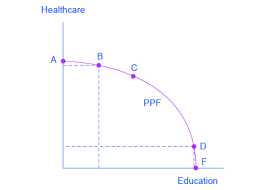
key concepts illustrated by the ppf
scarcity: ppf shows production limits with finite resources; points outside = unattainable
choice: society picks a point on the ppf (mix of goods)
opportunity cost: moving along ppf sacrifices one good for another; slope = opportunity cost
efficiency:
on ppf = productive efficiency (all resources used)
inside ppf = inefficiency (unused resources)
economic growth: outward shift of ppf increases productive capacity
points on the ppf
a typical ppf diagram has 2 goods (e.g. consumer goods and capital goods) on the axes. the curve itself represents the maximum possible production of these goods.
-points on the PPF: productively efficient
-points inside the PPF: inefficient; resources not fully employed
-points outside the PPF: unattainable with current resources and tech
shifts on ppf
the PPF can shift outwards (eco. growth) or inwards (eco. contraction) due to changes in:
-quantity of resources: an increase in available land
-quality of resources: improvements in education, tech or resource management shift the PPF outwards
-technology: technological adv. allow for more efficient production, shifting the PPF outwards
shape of ppf
usually bowed outwards (concave to the origin), reflecting the law of increasing opportunity cost
if resources were perfectly adaptable, the PPF would be a straight line, indicating a constant opportunity cost.
in shifting to different points (a reallocation of resources) the economy will gain x guitars, but will no longer be able to produce y computers, making it the opp. cost.
what are the three fundamental economic questions to answer due to relative scarcity?
WHAT AND HOW MUCH TO PRODUCE?: Which goods and services should be produced and in what quantities? this involves prioritising some wants over others
HOW TO PRODUCE?: which production methods should be used? this involves choosing the most efficient combination of resources
FOR WHOM TO PRODUCE?: How should the goods and services be distributed among the population? involves considering equity and fairness.
ALWAYS LINK TO RELATIVE SCARCITY!!!!
define production
process of combining various inputs like labor, capital, land, and entrepreneurship to create goods and services that have value.
KK2
define economic efficiency
refers to how well resources are allocated to society’s wellbeing and living standards, both in the short and long term. it means getting the most output from scarce resources.
allocative efficiency (how economy’s determine their priorities and make the most benficial decisions for all)
allocative efficiency is where resources are used to produce the types of goods and services that best maximise societys overall satisfaction of needs and wants. resources go where they are most valued or wanted.
achieved when resources are allocated to their most valued uses. production reflects consumer preferences
it directly impacts LS by ensuring that society is producing what people want most
PPF RELATIONSHIP: only one point on it is allocatively efficient, representing the optimal mix of goods and services that maximise societal wellbeing.
THE MECHANISM BEHIND PRODUCTIVE OR TECHNICAL EFFICIENCY AND THE FULL UTILISATION OF RESOURCES
using the lowest cost production methods and minimising wastage of resources in making goods or services. output per unit of input is maximised
achieved when production occurs at the lowest possible average cost
reduces resource wastage, lowers production costs, and can lead to lower prices for consumers
PPF RELATIONSHIP: all points on the PPF are productively efficient because it is not possible to increase the production of one good without decreasing the production of another, given existing resources and technology. producing inside the PPF is productively inefficient. (it focuses on WHAT goods are produced)
THE SPEED OF RESPONDING TO CHANGES IN ECONOMIC CONDITIONS (DYNAMIC EFFICIENCY)
dynamic efficiency is where resources are reallocated quickly in response to changing consumer needs and wants
requires resource mobility and responsiveness to price signals
promotes innovation, technological advancements and the development of new products and services to meet evolving customer demands
PPF RELATIONSHIP: dynamic efficiency influences the speed of movement from one point on PPF to another , reflecting the economys ability to adapt to changing preferences. also shifts the PPF outwards overtime.
HOW SUSTAINABILITY AND REDISTRIBUTION ALLOW FOR SUSTAINABLE GROWTH IN LIVING STANDARDS OVERTIME. (INTERTEMPORAL EFFICIENCY)
intertemporal efficiency involves finding the optimal balance between current consumption versus saving and investment for future consumption
requires balancing present and future needs, considering the impact of current resource use of future generations
ensures sustainable resource use and long term economic growth. involves environmental sustainability
PPF relationship: decisions about intertemporal efficiency influence the future position of the PPF. excessive current consumption nay shift the PPF inwards in the long run due to resource depletion.
RELATIONSHIP TO THE PP
POINTS ON THE PPF: represent productive efficiency
POINTS INSIDE THE PPF: represent productive inefficiency (unemployment of resources)
MOVEMENT ALONG THE PPF: illustrates opportunity cost
OUTWARD SHIFT OF THE PPF: represents economic growth, often driven by improvements in productive or dynamic efficiency
ALLOCATIVE EFFICENCY: point on ppf that maximises societal wellbeing
☆ government policies can influences the economies position relative to the PPF and movement along and outwards shift of the PPF ☆
(extra) INTERRELATIONSHIPS BETWEEN DIFFERENT TYPES OF EFFICIENCY
Allocative: producing the optimal mix of goods and services to maximise societies satisfaction. influences size and position of the PPF. dynamic efficiency depends on resources being allocated to innovative services.
productive: producing goods and services at the lowest cost possible. shifts the PPF outwards, increasing potential allocative efficiencies.
Dynamic: reallocating resources quickly in response to changing consumer preferences and technological advancements. boosts allocative efficiency by directing resources to their most valued uses.
intertemporal: balancing current consumption with future consumption through saving and involves considering needs of future generations. affects the future points of the PPF and sustainable economic growth.
KK3 - conditions of markets
market structure (extra)
a market is any place (physical or virtual) where buyers and sellers interact to exchange goods and services
market structure refers to the characteristics of a market, including the number of buyers and sellers, the degree of product differentiation, and the ease of entry and exit.
characteristics of a free market
an economic system in which prices are determined by supply and demand with minimal government intervention
Key characteristics:
-private property rights protected
-competition among businesses
-limited gov. intervention (e.g. taxes)
-voluntary exchange occurs between buyers and sellers
-prices acct as signals to allocate resources
where Australia’s market operates freely:markets like agriculture or retail, influenced by factors like government regulations and global commodity prices.
charactersitics of a perfectly competitive market
a theoretical market structure characterised by a large number of buyers and sellers, homogenous products, perfect info, and free entry and exit/ serves a benchmark for evaluating the efficiency of other market structures.
☆REMEMBER THAT PC IS A THEORETICAL MODEL. REAL WORLD MARKETS RARELY MEET ALL OF THESE CONDITIONS PERFECTLY☆
large number of b&S (coapcm)
many independent buyers and sellers participate in the market none of whom are large enough to influence the market price individually
each firm is a price taker, meaning they must accept the prevailing market price
this prevents any single participant from exerting market power
HOMOGENOUS PRODUCTS: (identical products offered by all firms)
the products offered by all firms are identical or very similar
consumers perceive no difference between the products of different firms
this ensures that price is the primary factor influencing consumer choice
no product differentiation or brand names exist
FREE ENTRY AND EXIT: (no barriers preventing firms from entering/leaving market)
there are no barriers to entry or exit for firms
new firms can easily enter the market if they see an opportunity for profit
existing firms can freely exit the market if they are making losses
this ensures profits are driven down to normal levels in the long run
PERFECT INFORMATION: (all buyers and sellers have complete and accurate information)
all buyers and sellers have complete and accurate info about prices, costs and product quality
this allows consumers to make informed decisions and prevents firms from exploring information symmetries
helps to ensure resources allocated efficiently
PERFECT RESOURCE MOBILITY: (resources can move freely between industries)
factors of production (land, labor, capital) can move freely between industries in response to changes in market conditions
this allows resources to be allocated to their most productive uses
NO GOVERNMENT INTERVENTION: (market operates freely e.g. no subsidies or regulations etc.)
theres no government intervention in the form of price controls, subsidies, or regulations
the market is allowed to operate freely according to the forces of supply and demand
DISTINGUISH BETWEEN ECONOMIC COSTS AND ACCOUNTING COSTS BY INCLUDING OPPORTUNITY COSTS IN DECISION MAKING
ACCOUNTING COSTS: the explicit, out of pocket monetary expenses incurred by a firm in the production process, as recorded in it’s financial accounts
ECONOMIC COSTS: the total cost of production, including accounting (explicit) costs plus opportunity costs
including opportunity costs allows for firms to assess the true cost of resource use and make more rational decision making choices
DIFFERENCE:
Accounting costs focus on financial reporting
economic costs focus on decision making and allocative efficiency
a firm may earn accounting profit but 0 or negative economic profit once opportunity costs are included
☆ economic costs include opportunity costs and therefore measure the true cost of production, while accounting costs only record explicit monetary expenses☆
kk4-6
define supernormal profits
earned when a firms total revenue exceeds it’s total economic costs, meaning revenue is greater than the sum of explicit and opportunity costs
define the law of demand
states that there is an inverse relationship between the price (the independent variable) and the quantity demanded (dependent variable)
this relationship is based on the assumption that all other variables that could affect demand for a product are held constant. ie. if we assume that nothing else in the market changes, just the price, then the quantity demanded will respond to the change in price.
As the price increases, quantity demanded decreases and as the price decreases, quanitiy demanded increases.
income effect
as the price increases consumers may no longer be able to afford (as much of) the product because a greater % of income is required for its purchase. they will therefore reduce the quanitty purchased or not purchase product at all.
substitution effect
when the price of one good increases (and it is assumed other do not), consumers will look towards cheaper substitutes, so quantity demanded is likely to fall
constructing a demand curve
dc shows the relationship between the various possible prices for a product and the quantity that consumers in the market would be willing and able to buy at each of these prices.
the total market demand is based upon the total amount demanded by each individual consumer
price on the vertical (y) axis and the quantity demanded on horizontal (x)
NOTE: change in price = movement of dc
movements along the demand curve
a movement along the curve is due to a change in the good or services own price
-a movement along the demand curve to the left (contraction) is caused by an increase in the price of the relevant good or service
-a movement along the demand curve to the right (an expansion) is caused by a decrease in the price
a shift off the entire demand curve
a shift of the entire demand curve will occur when one of the other factors of demand (ie. not price) have changed, resulting in either an increase or decrease in the quantity demanded at any given price.
this essentially means that the previous demand curve is no longer relevant for the new set of circumstances.
non price factors affecting demand
disposable income, the prices of substitutes and complements, preferences and tastes, interest rates, population demographics and consumer confidence on the demand curve.
disposable income (npfad)
the rewards received by households from their direct contribution (from working) and indirect contribution (from the provision of land or capital) to the production process, plus government transfers less direct (income) taxes. it represents the total amount that consumers have to spend on goods and services.
-an increase in disposable income is generally associated with an increase in the demand for normal goods (where consumption of the good increases when income increases)
-an increase may also lead to a negative effect on inferior goods (e.g. second hand clothes, ‘home brand’ products in supermarkets and travel by bus) as income increases, consumers may choose to substitute away from them and towards the opposite.
interest rates and other factors affect discretionary income (npfad)
interest rates represent the reward for lending (saving) or the cost of borrowing, expressed as a % of the principal.
-an increase in interest rates will mean that indebted households ( and businesses) will have less ‘discretionary income’ (whats less after taxes, living costs etc.) after paying taxes, likely to result in a decrease in demand and a shift to the left of the demand curve for many goods and services (especially non-essential items). in this case, less will be purchased at each price.
prices of substitutes and complements (npfad)
-a substitute is a viable good or service that can be used instead of another to fulfil a similar need. if a susbtitute becomes cheaper, demand for the original good shifts to the left as consumers switc to the relatively cheaper alternative.
-conversely, complements are goods generally consumed together. a rise in the price of a complementary good (like a car) increases the cost of the overall experience, shifting the demand for the related good (like fuel) to the left.
preferences and tastes (npfad)
demand is heavily influenced by individual attitudes, fashions, and tastes. factors such as advertising campaigns or social meia influences can successfuly alter preferences, shifting the demand curve to the right for trendy products.
population demographics (npfad)
a growing population generally increases the demand for most goods and services at every price. changes in the age distribution, such as an ageing population, shift and demand towards specific sectors like aged care and away from items like toys.
consumer confidence (npfad)
this measures the level of optimism or pessimism households feel regarding their future incomes and employment prospects. lower confidence typically leads to a decrease in the marginal propensity to consumer, shifting the demand curve for discretionary goods to the left as households save more.
define the law of supply
the law of supply identifies a positive or direct relationship between the market price of a good or service and the quantity supplied
this principle dictates that as the price of a product increases, the quantity that produced are willing and able to offer for sale expands, whereas a decrease in price leads to a contraction in the quantity supplied, assuming other factors remain constant (the ceteris paribus condition)
the theory of the law of supply
economists use the law of supply to explain business behaviour:
profit motive: higher prices raise revenue per unit, making production more attractive and encouraging firms to increase output
cost recovery: expanding output raises marginal costs, so firms need higher prices to cover costs and remain profitable
opportunity cost: higher prices signal resources to move from less profitable goods to the more profitable good
constructing a supply curve
sc is a graphical representation showing the positive or direct relationship between the market price of a product and the quantity that producers are prepared to offer for sale.
movements along the supply curve
A movement along the supply curve is caused exclusively by a change in the good or service's own price, assuming all other factors remain constant (ceteris paribus).
Expansion in supply: A movement up and to the right along the existing curve in response to a price rise.
Contraction in supply: A movement down and to the left along the existing curve in response to a price fall
shifts along the supply curve
occurs when a non-price factor changes, meaning producers are willing to supply a different quantity at every possible price level.
Rightward shift: Occurs when more is supplied at each price, often due to improved technology, higher productivity, favourable climatic conditions, or a decrease in the costs of production (such as lower wages or utility charges).
Leftward shift: Occurs when less is supplied at each price, typically caused by rising input costs, unfavourable weather events (like droughts or floods), or a decrease in the number of suppliers in the market.
non-price factors affecting supply
costs of production, number of suppliers, technology, productivity and climatic conditions on the demand curve.
A shift to the right represents an increase in supply, where more is produced at every price level, while a shift to the left indicates a decrease in supply, where less is produced at all prices.
changes in the cost of production
If the cost of inputs rises (e.g., higher wages), production becomes less profitable. This results in a leftward shift of the supply curve as firms are less willing and able to produce at each price level.
technological change
new technology e.g. ai, typically allows for more efficient production processes. This reduces the costs associated with producing each unit, making it more profitable for businesses to expand their output, causing the supply curve to shift to the right.
productvity growth
productivity measures the volume of output produced from a given number of inputs. Higher labour productivity allows firms to generate more goods from their existing workforce, which lowers unit costs and increases the willingness of firms to supply, shifting the curve to the right.
climactic conditions and disruptions
Favourable climatic conditions can lead to bumper crops and an increase in supply. However, unfavourable events like droughts, floods, or cyclones destroy resources and infrastructure, reducing the quantity suppliers can offer and shifting the supply curve to the left.
number of suppliers
As the number of sellers increases, the total market supply rises, shifting the supply curve to the right.if firms make a loss and exit the market, the supply curve shifts to the left.
define positive relationship
also known as a direct relationship, exists when two variables move in the same direction, meaning as one increases, the other also increases, and vice versa
the mechanism of reaching equilibrium using the supply and demand diagram.
Market equilibrium is the specific price point where the quantity demanded by consumers exactly equals the quantity supplied by producers.
At this price, the market "clears," meaning there is no excess demand (shortage) or excess supply (surplus). The market is considered to be in a "state of rest," as there is no internal pressure for the price to change unless an external non-price factor shifts one of the curves.
Market Disequilibrium and the Adjustment Process:
When a non-price factor causes a shift in demand or supply, the market enters a temporary state of disequilibrium.
the effect of changes in demand and supply on equilibrium prices and quantities.
Market Shortage (Excess Demand): occurs if market price is set below the equilibrium level, where the quantity demanded exceeds the quantity supplied. buyers compete and bid up the price, while producers increase supply to maximise profit, continuing until the shortage is removed and a new, higher equilibrium is reached.
Market Surplus (Market Glut): This occurs if the market price is above the equilibrium level, where the quantity supplied exceeds the quantity demanded. to clear the surplus, sellers lower prices, causing demand to rise and supply to fall until a new, lower equilibrium is reached.
The Four Scenarios of Market Shifts
The equilibrium price and quantity traded will change predictably based on which curve shifts:
1. Increase in Demand (Shift Right): Caused by factors like rising disposable income or stronger consumer confidence, this leads to a higher equilibrium price and a higher equilibrium quantity.
2. Decrease in Demand (Shift Left): Caused by factors like higher interest rates or a fall in the price of a substitute, this results in a lower equilibrium price and a lower equilibrium quantity.
3. Increase in Supply (Shift Right): Caused by technological advancements or lower costs of production, this results in a lower equilibrium price and a higher equilibrium quantity.
4. Decrease in Supply (Shift Left): Caused by unfavourable climatic conditions (like a drought) or rising input costs, this leads to a higher equilibrium price and a lower equilibrium quantity.
significance of resource realloaction (related to the The Four Scenarios of Market Shifts)
changes in equilibrium prices lead to changes in relative prices (the price of one good compared to another). These act as price signals to profit-seeking owners of resources. A rise in a product's relative price signals a shortage, incentivising producers to reallocate scarce resources (natural, labour, and capital) into that industry to maximise their profits and better satisfy consumer wants
define equilibrium price
the market price where the quantity of goods or services supplied exactly equals the quantity demanded
equilibrium quantity traded
the specific amount of a good or service produced, sold, and bought when the balance, meaning the quantity demanded by consumers equals the quantity suppled by producers at a given pace
KK11-13
.
define price elasticity
measures the responsiveness or sensitivity of the quantity demanded or supplied of a good to change in its price.
Price Elasticity of Demand (PED)
Price elasticity of demand (PED) measures the degree of responsiveness of the quantity demanded of a good or service to a change in its price. It is calculated using the formula: percentage change in quantity demanded divided by the percentage change in price.
Elastic Demand (High PED): If the absolute value is greater than 1, demand is considered elastic, meaning the percentage change in quantity demanded is greater than the percentage change in price. This results in a relatively flat demand curve.
Inelastic Demand (Low PED): If the value is less than 1, demand is inelastic, meaning consumers are relatively unresponsive to price changes, and the demand curve is relatively steep.
Unit Elasticity: This occurs when the percentage change in quantity and price are equal, resulting in an elasticity value of exactly 1.
The significance of PED is vital for both businesses and the government. Businesses use PED to determine pricing strategies to maximise total revenue; for instance, increasing the price of an inelastic good will lead to a smaller percentage decrease in demand, thereby increasing overall revenue. The government considers PED when implementing indirect taxes(such as excise duties on tobacco or alcohol); taxing goods with a low PED ensures high tax revenue because the quantity demanded remains relatively stable despite the price increase.
the factors affecting price elasticity of demand.
the degree of necessity, availability of substitutes, proportion of income and time
degree of neccessity (faped)
Necessities (bread, insulin) have low PED (inelastic) because consumers must buy them. Luxuries (holidays, luxury cars) have high PED (elastic) because purchases can be delayed. Addiction can also make demand more inelastic.
availability of substitutes (faped)
The more close substitutes available, the more elastic demand is, as consumers can switch. Goods with few or no substitutes (e.g. petrol) tend to be inelastic.
proportion of income (faped)
Goods that take up a large proportion of income (e.g. houses, airfares) have high PED because price changes significantly affect budgets. Cheap goods taking a small proportion of income have low PED.
time period (faped)
Demand is usually more inelastic in the short term due to habits and limited alternatives, but more elastic in the long term as consumers adjust behaviour and find substitutes.
Price Elasticity of Supply (PES)
Price elasticity of supply (PES) measures the responsiveness of the quantity supplied of a good or service to a change in its price. It is calculated by dividing the percentage change in quantity supplied by the percentage change in price.
Elastic Supply (High PES): When the value is greater than 1, the supply curve is relatively flat, indicating that producers are willing and able to increase supply by a larger percentage than the price increase.
Inelastic Supply (Low PES): When the value is less than 1, the supply curve is relatively steep, meaning suppliers are unable or unwilling to significantly adjust production in response to price changes.
The significance of PES relates to a firm's economic viability and its ability to respond to market price signals. Products with low PES, such as primary commodities (mining and agriculture), often face volatile price swings because supply cannot be increased quickly when demand rises, often due to long production periods or a lack of spare capacity. In contrast, digital services (like streaming) can have a PES that is effectively infinite, meaning any increase in demand can be met instantaneously without a price rise.
factors affecting the price elasticity of supply (fapes)
spare capacity, production period and durability of goods
spare capacity (fapes)
Firms with spare capacity (idle machinery or labour) can increase production quickly, making supply more elastic. Firms operating at full capacity have more inelastic supply.
producition period (Fapes)
A long production period (e.g. agriculture) makes supply inelastic in the short term because output cannot be increased quickly. Goods with minimal production time (e.g. digital products) have high or even infinite PES. Over time, PES generally becomes more elastic.
durability and storage of goods (fapes)
Durable and storable goods allow firms to release inventory when prices rise, increasing elasticity. Perishable goods and services (cannot be stored) tend to have more inelastic supply.
define durability
consumer products that do not quickly wear out and provide utility over an extended period, typically three years or more