Biostats
 Call Kai
 Learn
 Practice Test
 Spaced Repetition
 Match
 Flashcards
 Knowt Play
1/11

There's no tags or description
Looks like no tags are added yet.
12 Terms
Measurement scales

Measures of Central Tendency

Measures of Variability

Determine if a variable is nominal, ordinal, or continuous data
Categorical Data
Nominal data has no scale or direction
Two or more “groups”
Dichotomous = 2 groups
Ex:
Diagnosis
Biological sex category
Hair color
Original data has direction but no fixed scale
Numeric scales have no measurable “value,” only show direction
Ex:
Likert scale (1-5)
NYHA functional Class
Pain scale (numeric or faces)
Continuous Data
Interval data has scale and direction
No “true” zero
“Infinite” scale in both +/- directions
Ex:
Time
Temperature
Change in heart rate
Ration data has scale and direction
“True zeros” exists
“Infinite” in only one direction
Ex:
Age in years
Weight in kg
Heart rate (bpm)
example


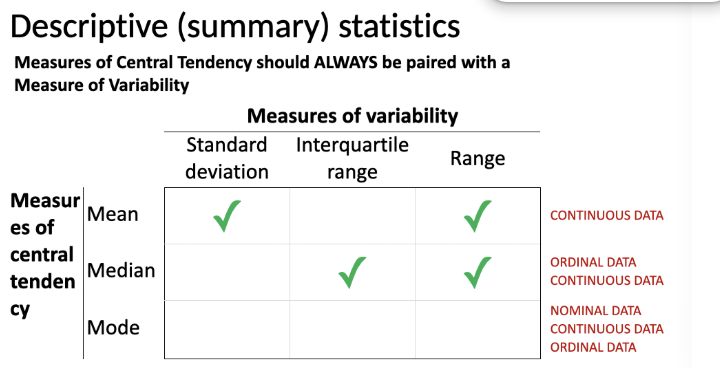
Standard Deviation


IQR or Range?
IQR informs variability around center of data (50%)
Range informs how far outliers are lying out from the center

Example
If there are 100 people in a study:
Within 1 standard deviation of the mean: about 68 people
Within the interquartile range (IQR): 50 people
Within the range: 100 people
Easy way to remember:
Measure | % of data | Out of 100 people |
±1 standard deviation | ~68% | 68 people |
IQR | 50% | 50 people |
Range | 100% | 100 people |
The 68% comes from the empirical rule (68–95–99.7 rule).
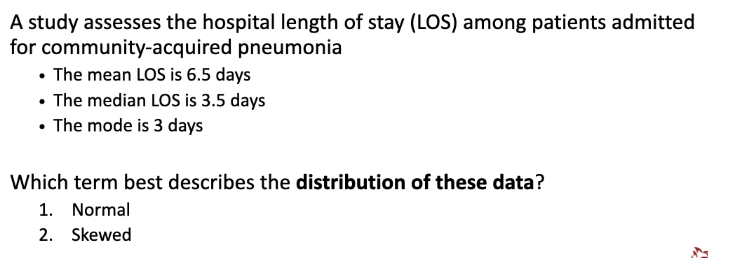
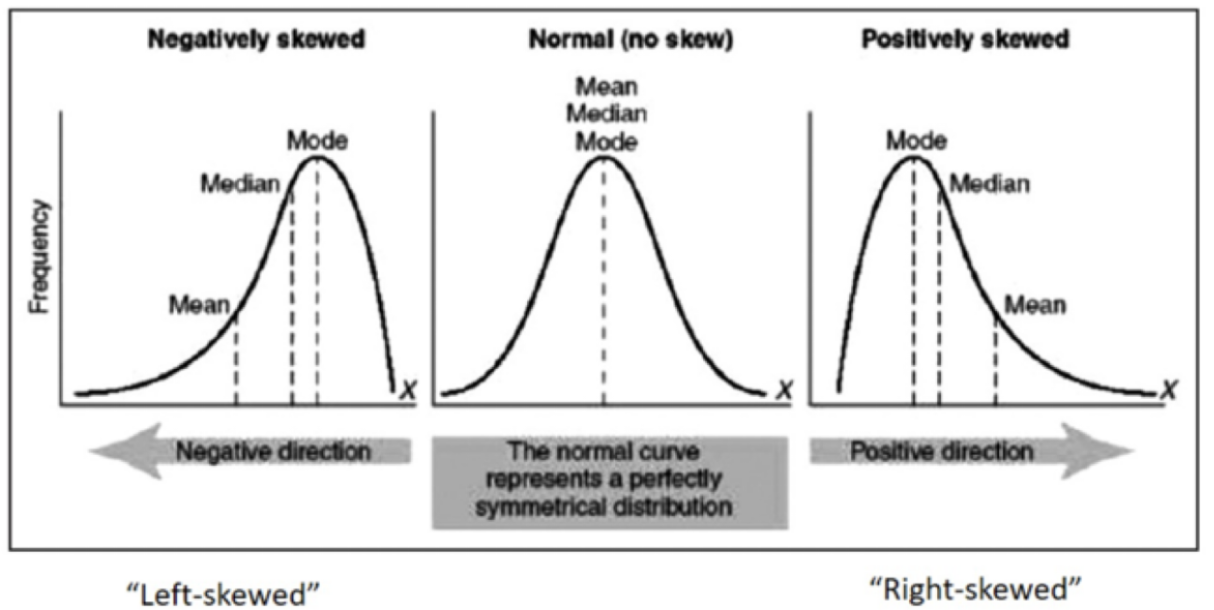
Mode < Median < Mean
Mode = 3 days
Median = 3.5 days
Mean = 6.5 days
When mean > median > mode, the data are right-skewed (positively skewed).
Why?
A few patients likely have very long hospital stays, which pulls the mean upward.
👉 Answer: Skewed (right/positively skewed)
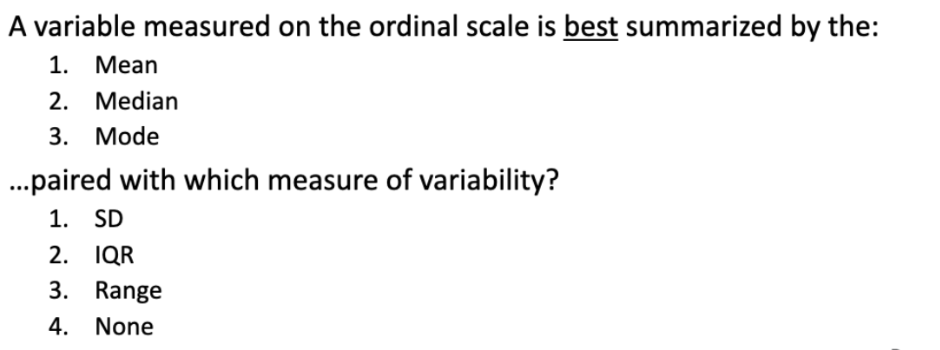
A variable measured on the ordinal scale is best summarized by the Median, paired with the IQR (Interquartile Range).
Why this pair?
Central Tendency (Median): Ordinal data has a meaningful rank order, but the intervals between ranks are not uniform or mathematically defined (e.g., Likert scales, cancer staging, pain scales 1–10). Because arithmetic operations like addition and division are invalid without equal intervals, calculating a Mean is inappropriate. The Median only requires knowing the middle ranked value.
Variability (IQR): Measures of dispersion like Standard Deviation (SD) require distances from a mean, making them unsuitable for ranked data. The IQR (the distance between the 25th and 75th percentiles) relies purely on ranked cutoffs, making it the standard companion to the median.