APES FINAL REVIEW
 Call Kai
 Learn
Learn Practice Test
 Spaced Repetition
 Match
Match Flashcards
 Knowt Play
1/79

There's no tags or description
Looks like no tags are added yet.
Name | Mastery | Learn | Test | Matching | Spaced | Call with Kai | Chat |
|---|
No analytics yet
Send a link to your students to track their progress
80 Terms
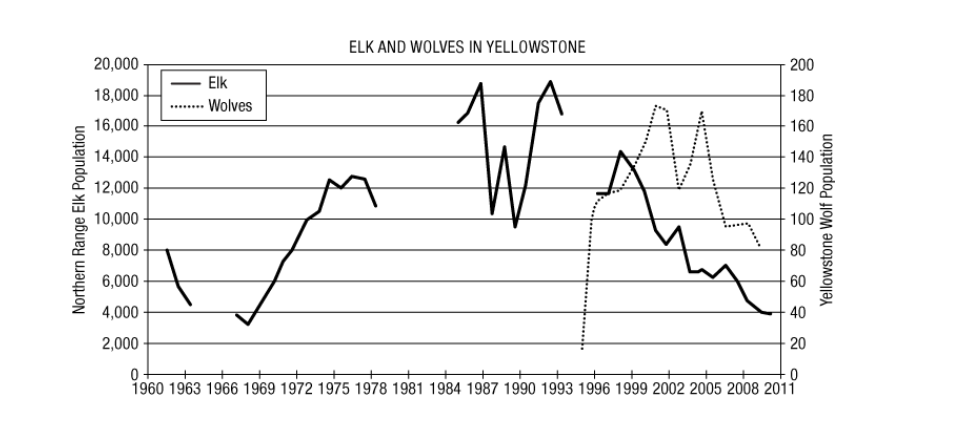
Wolves were reintroduced into Yellowstone National Park in 1995. In addition to tracking changes in the wolf population, scientists were interested in how the wolves would affect other parts of the Yellowstone ecosystem. In particular, they were interested in changes to the population of elk, the wolves’ primary prey. The graph below shows the population size of the wolf and elk populations over time.
Which of the following best describes the change in the elk population since the introduction of wolves into Yellowstone in 1995?
A) The elk population steadily increased in numbers.
B) The elk population steadily decreased in numbers.
C) The elk population remained stable, experiencing little changes.
D) The elk population reached carrying capacity and experienced overshoot.
B
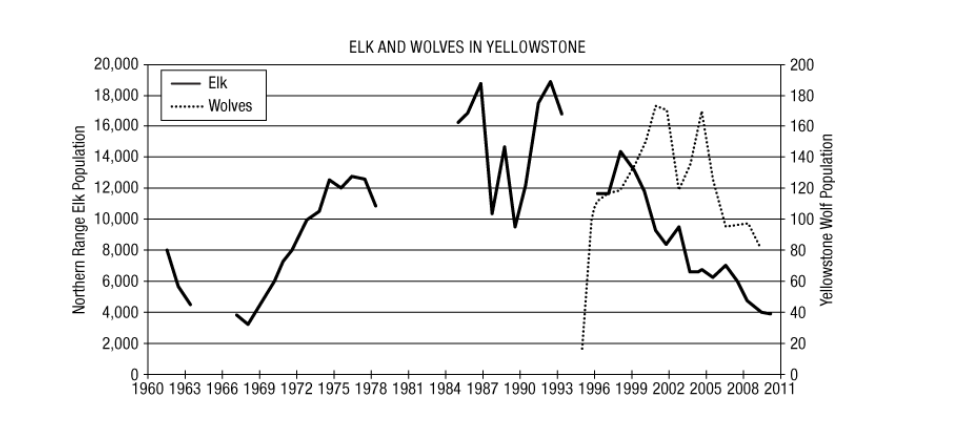
Wolves were reintroduced into Yellowstone National Park in 1995. In addition to tracking changes in the wolf population, scientists were interested in how the wolves would affect other parts of the Yellowstone ecosystem. In particular, they were interested in changes to the population of elk, the wolves’ primary prey. The graph below shows the population size of the wolf and elk populations over time.
Based upon the data presented in the graph, which of the following best identifies the highest wolf population size?
A) 20
B) 120
C) 170
D) 190
C
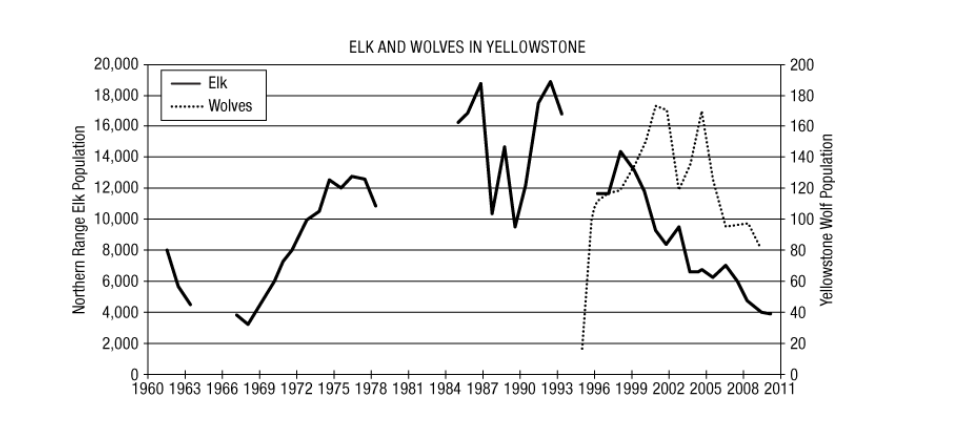
Wolves were reintroduced into Yellowstone National Park in 1995. In addition to tracking changes in the wolf population, scientists were interested in how the wolves would affect other parts of the Yellowstone ecosystem. In particular, they were interested in changes to the population of elk, the wolves’ primary prey. The graph below shows the population size of the wolf and elk populations over time.
Which of the following is a potential disadvantage of reintroducing wolves to Yellowstone?
A) The wolves are causing a trophic cascade that could further increase the number of beavers and tree species such as willows and aspens.
B) Wolves leaving the park may prey on livestock in grazing land outside the park.
C) Wolves are extremely fast breeders and may become an invasive species if they get outside the park.
D) The ecosystem could collapse because wolves were never in Yellowstone before 1995.
B
Which of the following is a process that indirectly removes carbon from Earth's atmosphere?
A) Formation of carbonate deposits
B) Outgassing by volcanoes
C) Respiration by mammals
D) Respiration by aerobic bacteria
E) Photodissociation by ultraviolet light
A
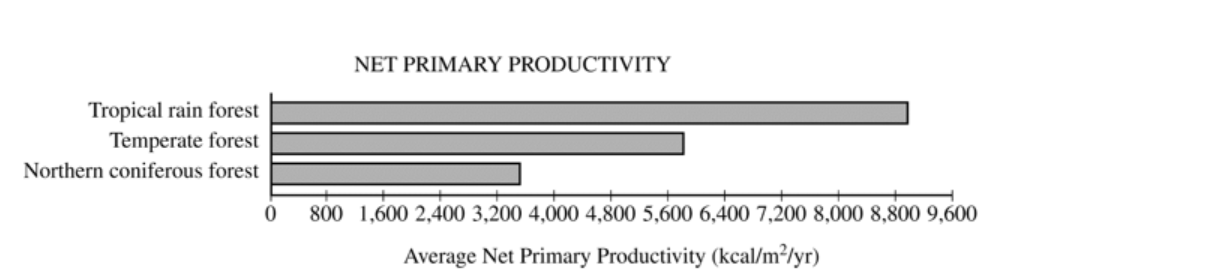
The terrestrial biomes shown in the diagram above vary in net primary productivity. The explanation for the variation includes which of the following?
Temperature
Precipitation
Longitude
A) 1 only
B) 2 only
C) 3 only
D) 1 and 2 only
E) 2 and 3 only
D
Of the following organisms, which occupies the lowest trophic level?
A) Spider
B) Deer
C) Lion
D) Hawk
E) Snake
B
How does the burning of fossil fuels contribute to the net increase in atmospheric carbon?
A) Photosynthesis is reduced by virtue of increased smoke and haze.
B) Carbon released by the burning is not in a form that can be readily absorbed by plants, leaving residual carbon in the atmosphere.
C) Carbon that has been sequestered underground is added to the carbon cycling between the atmosphere and the biosphere.
D) Carbon released by the burning is more easily absorbed in the atmosphere than that produced by natural means.
E) Carbon released by the burning increases plant growth, producing more carbon for the atmosphere.
C
Which of the following is true of carbon as it cycles in nature?
A) Carbon dioxide is released during photosynthesis.
B) Carbon compounds rarely exist in the gaseous state.
C) Carbon sinks include forests and oceans.
D) The carbon dioxide concentration in the atmosphere is reduced by cutting trees.
E) Carbon is concentrated in igneous rocks.
C
An energy transformation occurs and results in increased disorder.
(A) Heat flow
(B) Kinetic energy
(C) Potential energy
(D) First law of thermodynamics
(E) Second law of thermodynamics
E
The net annual primary productivity of a particular wetland ecosystem is found to be 8,000 kcal/m2 per year. If respiration by the aquatic producers is 12,000 kcal/m2 per year, what is the gross annual primary productivity for this ecosystem, in kcal/m2 per year?
A) 4,000
B) 8,000
C) 12,000
D) 20,000
E) 96,000
D
A field is abandoned, and an invasive plant that can live in nutrient-poor soil moves into the field. If the land is later cleared of this invasive species and it is discovered that the soil has an abundance of nitrogen compounds, what conclusion can best be made?
A) The plants used up all of the phosphorus and potassium and left the nitrogen behind.
B) Primary succession always produces an abundance of nitrogen.
C) Bacteria in soil and in root nodules converted free nitrogen into nitrogen compounds.
D) The plants were able to produce nitrogen in their leaves.
E) More rock was weathered and broken down to release nitrogen compounds.
C
Which of the following best illustrates an abiotic component of the environment affecting a biotic component of the environment?
A) Composted manure is added to agricultural soil during spring tilling
B) Coral reefs modify the direction of an ocean current.
C) Plants release O2 into the atmosphere during photosynthesis.
D) Low phosphorus content in soil limits the growth of vegetation.
E) A thick planting of ground cover reduces soil erosion on a hillside.
D
Which of the following is a characteristic of tropical rain forests?
A) They rarely receive more than 100 centimeters of rain per year.
B) Their soils typically have a high pH.
C) Their soils are relatively poor in nutrients.
D) They do not exhibit a great deal of species diversity.
E) They generally occur in the rain shadows of mountain ranges.
C
Decreased by the breakdown of organic waste
A) Acidity
B) Turbidity
C) Hardness
D) Dissolved oxygen
E) Salinity
D
Measured on the pH scale
A) Acidity
B) Turbidity
C) Hardness
D) Dissolved oxygen
E) Salinity
A
Caused by suspended particulates
A) Acidity
B) Turbidity
C) Hardness
D) Dissolved oxygen
E) Salinity
B
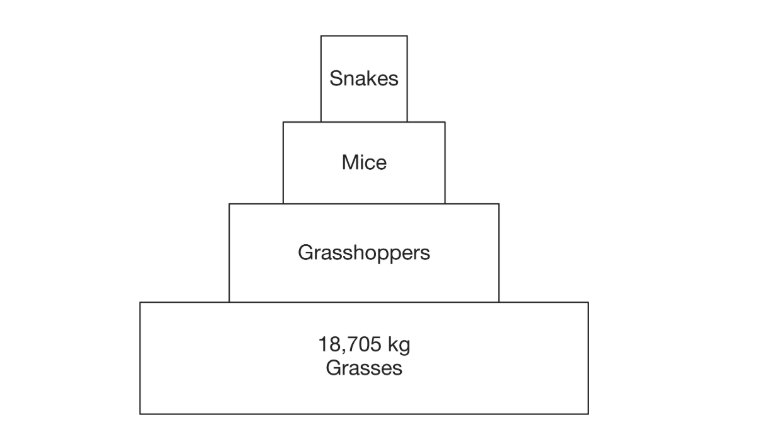
Based on the diagram, which group of organisms would be considered herbivores?
A) Snakes
B) Mice
C) Grasshoppers
D) Grasses
C
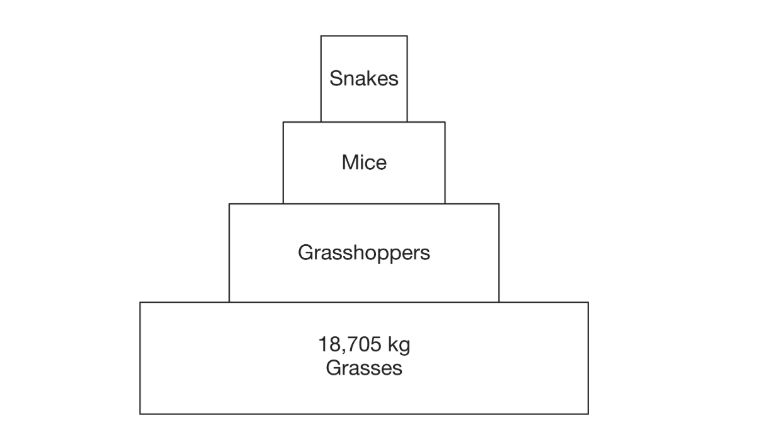
Based on the laws of thermodynamics, which of the following is the applied mathematical routine used to estimate the biomass of the mice in the pyramid?
A) 18,705 × 10
B) 18,705/10 × 100
C) 18,705 × 0.1 × 0.1
D) 18,705/0.1
C
The ultimate source of energy for terrestrial ecosystem is
A) nutrients in soil
B) nutrients in vegetation
C) primary consumers
D) producers
E) the Sun
E
Which of the following best explains why decomposers in soils and water are important to ecosystems?
A) They remove heavy metals.
B) They store carbon dioxide.
C) They recycle nutrients.
D) They neutralize acid deposition.
E) They produce more oxygen than they consume.
C
Small populations of animals, such as those typically found on islands, are prone to extinction because
A) they contain a high degree of genetic variability
B) they tend to have more predators
C) their habitats are more stable
D) they are more vulnerable to unpredictable events
E) they are usually generalist species
D
Which of the following best shows the process of evolution?
A) A lizard's color becomes brown as it sits on a log.
B) A bear goes into hibernation.
C) A plant loses its leaves in a drought.
D) A population of mosquitoes develops resistance to a pesticide.
E) A population of foxes increases as more prey becomes available.
D
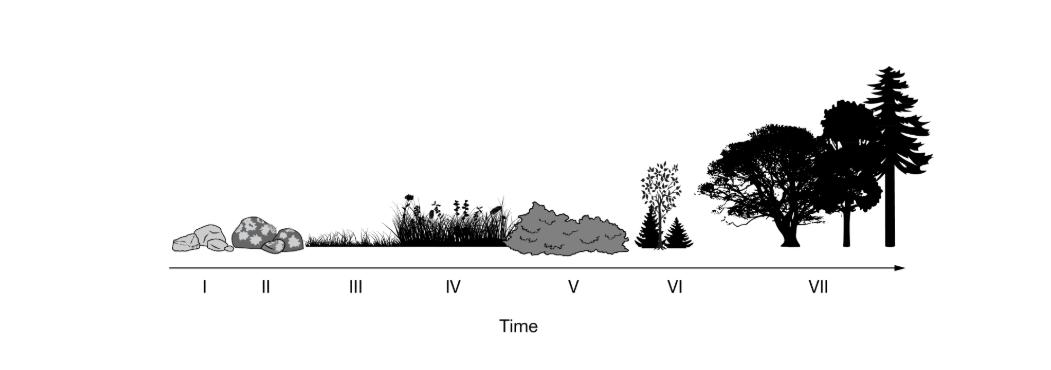
Which of the following best identifies and describes the process that is illustrated in the diagram above?
A) Primary succession, because the result is a mature forest with a variety of shade-intolerant shrubs and grasses
B) Primary succession, because the process in the diagram begins with bare rock.
C) Secondary succession, because intermediate plant species like grasses and weeds are present
D) Secondary succession, because the result is a mature forest with a variety of shade-tolerant trees
B
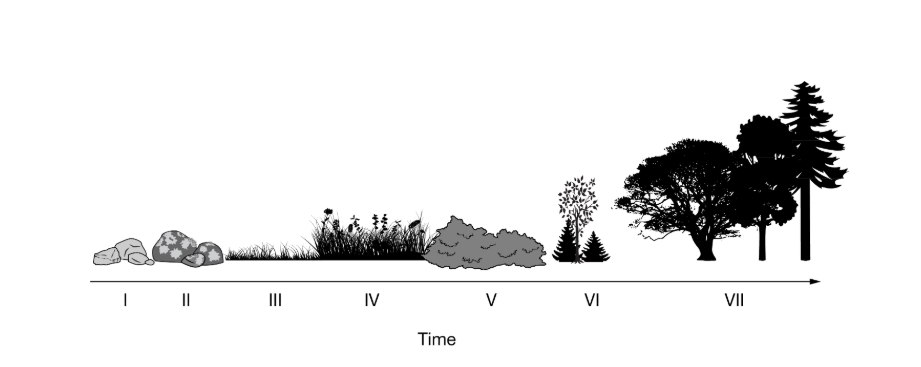
Based on the diagram above, in which stage are most species present considered pioneer species?
A) I
B) II
C) III
D) IV
B
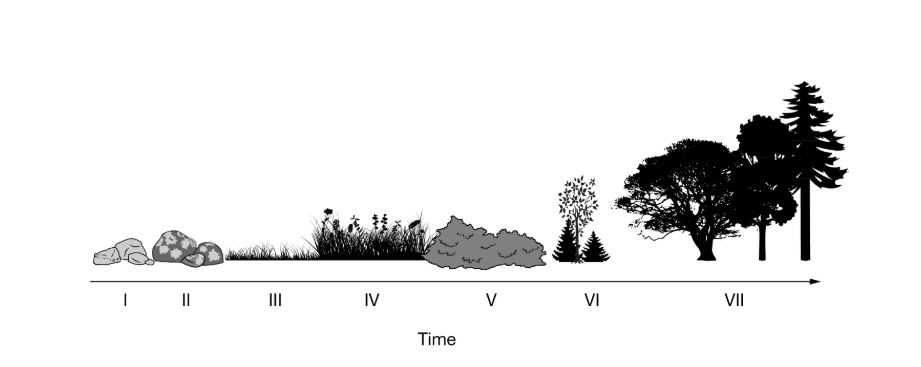
Which of the following best describes the role of moss in the transition to stage III of the process?
A) It serves as a soil seed bank in the leaf litter.
B) It breaks down rock and adds organic nutrients to the soil.
C) It provides shade and reduces surface temperatures.
D) It provides habitat for birds and mammals.
B
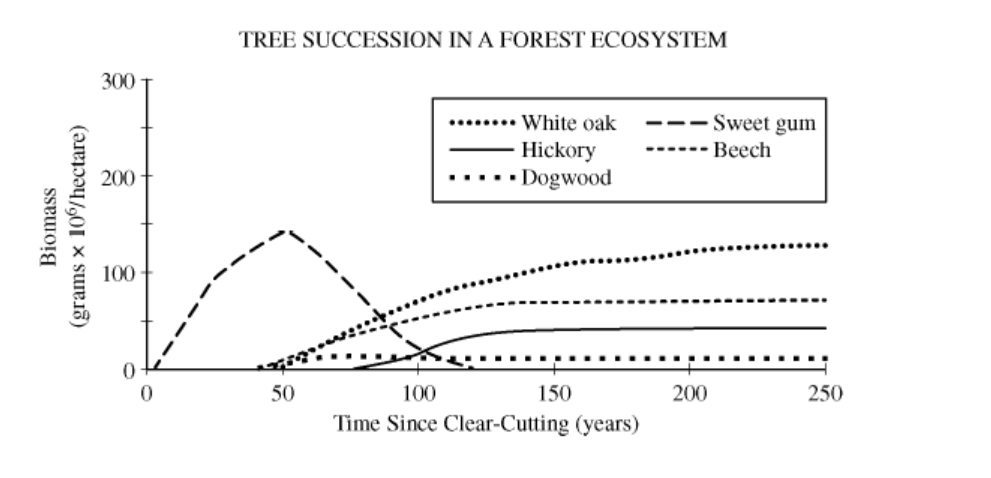
Which tree species grows best with full sunlight?
A) White oak
B) Hickory
C) Dogwood
D) Sweet gum
E) Beech
D
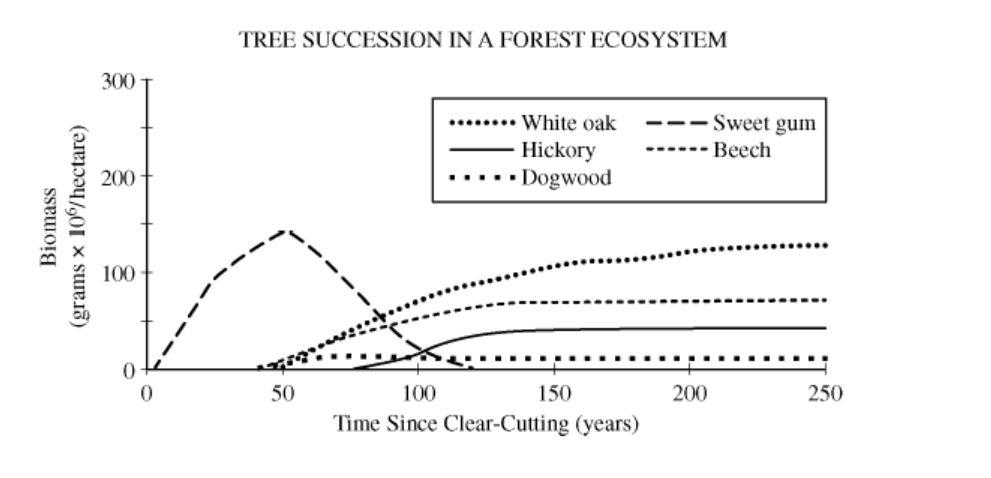
At which time after clear-cutting does the ecosystem exhibit the greatest species richness?
A) 50 years
B) 100 years
C) 150 years
D) 200 years
E) 250 years
B
In England approximately 250 years ago, the peppered moth had light-colored wing patterns that camouflaged them against the light-colored trees. Over time in urban areas, the number of peppered moths with dark-colored wings increased as pollution from the Industrial Revolution darkened the trees the moths rested on.
Which of the following statements best describes how the moths adapted to the new environment over time?
A) The moths adapted to the new environment through isolation.
B) The moths adapted to the new environment through primary succession.
C) The moths adapted to the new environment by changes in the genetics of the population.
D) The moths adapted to the new environment by becoming a generalist species.
C
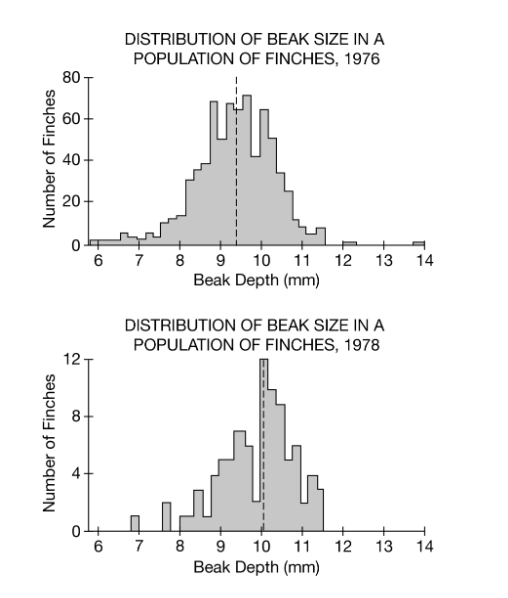
The graphs above show the population size and distribution of beak sizes in a finch population on the island of Daphne Major in the Galapagos in 1976 and 1978. Smaller-beaked finches are better suited for eating grasses and small seeds. Larger-beaked finches are better suited for cracking larger seeds and nuts. In 1977 a drought took place and the vegetation of the island was affected by the lack of rain.
Which of the following was the average beak size of finches on the island of Daphne Major in 1976?
A) 8.8 mm
B) 9.5 mm
C) 10.2 mm
D) 13.8 mm
B
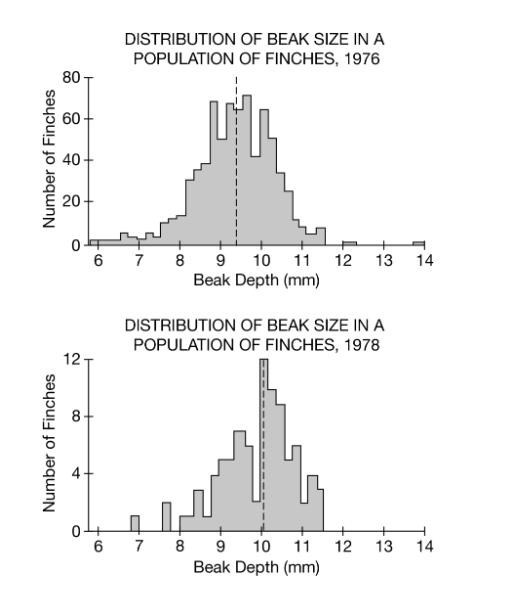
The graphs above show the population size and distribution of beak sizes in a finch population on the island of Daphne Major in the Galapagos in 1976 and 1978. Smaller-beaked finches are better suited for eating grasses and small seeds. Larger-beaked finches are better suited for cracking larger seeds and nuts. In 1977 a drought took place and the vegetation of the island was affected by the lack of rain.
Which of the following was the number of finches in the population with a beak size of 10.2 mm in 1978?
A) 8
B) 12
C) 40
D) 65
B
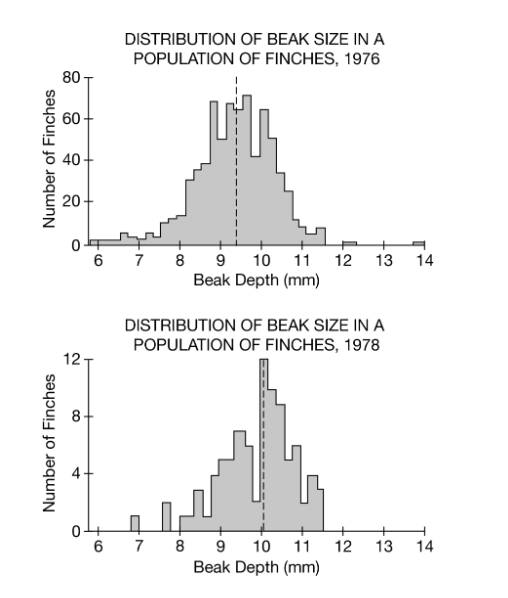
The graphs above show the population size and distribution of beak sizes in a finch population on the island of Daphne Major in the Galapagos in 1976 and 1978. Smaller-beaked finches are better suited for eating grasses and small seeds. Larger-beaked finches are better suited for cracking larger seeds and nuts. In 1977 a drought took place and the vegetation of the island was affected by the lack of rain.
Which of the following statements best explains the changes in the size and composition of the population of finches after the drought?
A) The total number of finches in the population increased, and the smaller-beaked finches were more successful in the drier environment.
B) The total number of finches in the population increased, and the larger-beaked finches were more successful in the drier environment.
C) The total number of finches in the population decreased, and the smaller-beaked finches were more successful in the drier environment.
D) The total number of finches in the population decreased, and the larger-beaked finches were more successful in the drier environment.
D
A one-hectare pond is sampled in early September. The sample yields 1 small catfish as well as 17 benthic invertebrates that represent 10 species.
If the pond is resampled a year later, which of the following would best indicate that the pond had been adversely affected by adjacent development?
A) An uncommon species has become more numerous.
B) An increase in low-tolerance species has occurred.
C) A decrease in high-tolerance species has occurred.
D) Phylogenetic diversity has increased.
E) The biodiversity of the pond has decreased.
E
A one-hectare pond is sampled in early September. The sample yields 1 small catfish as well as 17 benthic invertebrates that represent 10 species.
Which of the following can be estimated from the sample for the invertebrates in the pond?
A) The species richness
B) The pond’s productivity
C) The uniformity of species distribution in the pond
D) The degree of disturbance
E) The stability of the ecosystem
A
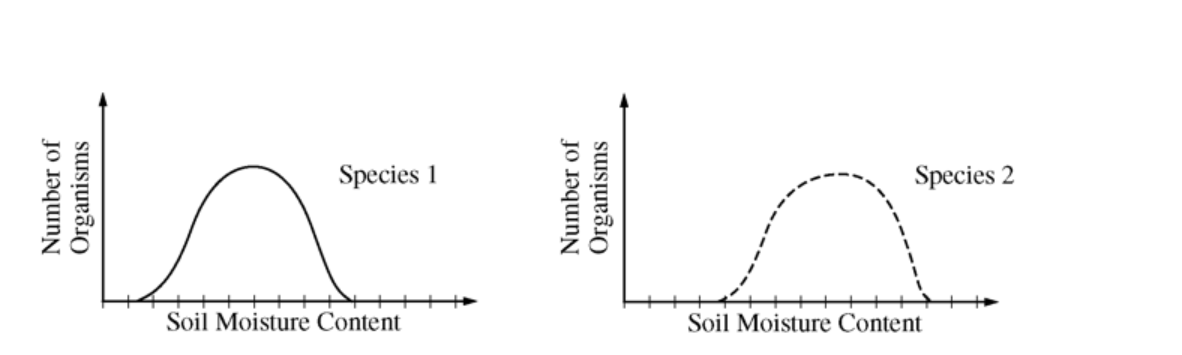
The diagrams above show the range of tolerance for soil moisture content for two different species of terrestrial invertebrate: Species 1 and Species 2. The ranges represented are for each species where it occurs alone. Soil moisture content is a limiting factor for both species. If populations of both species are placed together in a new location, which of the following diagrams represents the most likely actual (realized) ranges of the species’ distribution of individuals with respect to soil moisture content after five generations?


D
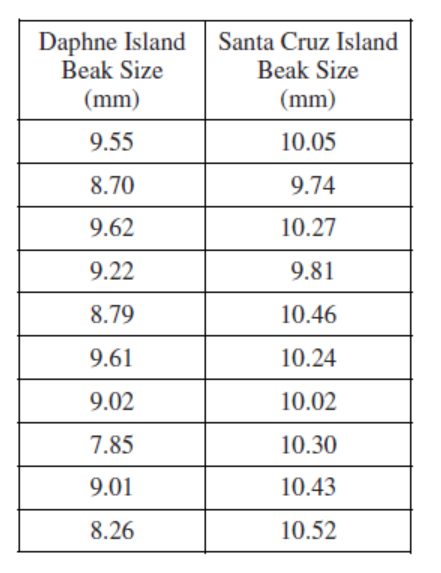
The table below shows measurements of the beak size of a sample of ten ground finches on each of two islands in the Galápagos archipelago. The two islands are about ten kilometers apart, and all the birds are the same species. Given that beak size is genetically determined, which of the following hypotheses is the most likely explanation for the differences in data between the islands?
A) Egg mortality differs on the islands.
B) Beak size exerts selective pressure on prey size.
C) Birds on Daphne Island live longer than birds on Santa Cruz Island.
D) Large-beaked birds move to Santa Cruz Island and small-beaked birds move to Daphne Island.
E) The types of food found on the two islands exert selective pressure on beak size.
E
Living organisms must acquire energy from their environment. Examples of adaptations that help organisms acquire this energy include which of the following?
The dark, heat-absorbing coloration of a reptile.
The fangs and claws of a lion
The light coloration of a peppered moth
A) I only
B) II only
C) I and II only
D) II and III only
E) I, II, and III
C
Which of the following statements about levels of biodiversity is correct?
A) Genetic biodiversity is a measure of the total number of genes in a community.
B) A narrow distribution of habitats leads to an increase in species diversity.
C) Global hotspots are areas where species diversity is thriving due to habitat restoration.
D) A population with high genetic biodiversity is better able to respond to environmental stressors.
D
Which of the following is most likely to be the direct result of lack of genetic diversity in a food crop such as corn?
A) Decreased kernel size
B) Decreased potential yield
C) Decreased dependence on chemical fertilizers
D) Increased susceptibility on plant disease
E) Increased resistance to pests
D
Which of the following is the best example of a keystone species?
A) Sea otter
B) Sea urchin
C) Spotted owl
D) Snail darter
E) Condor
A
Based on the theory of island biogeography, which of the following is the most likely reason that an island in the ocean that is 5 kilometers from a continent would have a higher number of species than one that is 15 kilometers from a continent?
A) There are more species that have the ability to travel 5 kilometers than can travel 15 kilometers.
B) Islands that are closer to continents always have a wider range of habitats than more distant islands do.
C) There are smaller populations of each species on islands that are at greater distances from continents.
D) Islands that are closer to continents always have more ecological niches than more distant islands do.
A
Which of the following is most typically associated with the transition from a rural to an urbanized society?
A) Reduced birth rates
B) Reduced need for sewage-treatment facilities
C) Increased rates of population growth
D) Increased air quality in urban areas
E) Increased stabilization of microclimate in urban areas
A
Which of the following age structure diagrams represents a population that most likely has a negative growth rate?
A

B

C

D

E

D
Which of the following is most likely the primary cause of high death rates in phase I?
A) Loss of breeding-age males due to warfare
B) Loss of breeding-age females due to disease
C) Large percentage of elderly individuals in the population
D) Infant and childhood mortality
E) General starvation due to famine
D
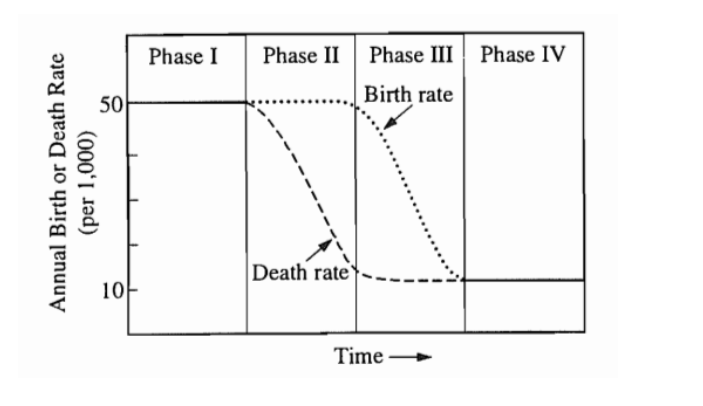
Zero population growth is associated with
A) phase I only
B) phase II only
C) phase III only
D) phase IV only
E) phases I and IV
E
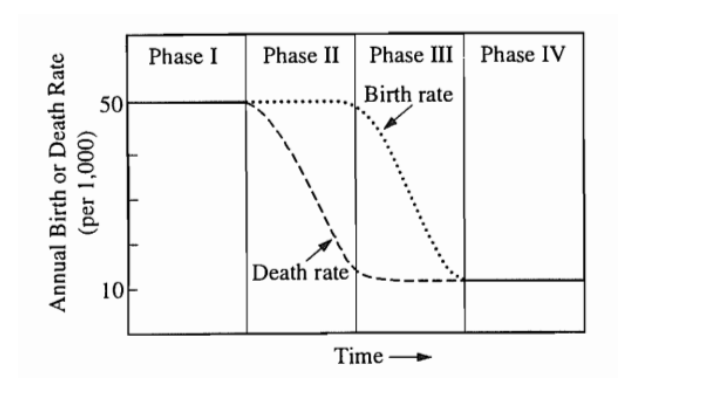
The rate of population growth starts to slow down at which point?
A) The end of phase I
B) The middle of phase II
C) The beginning of phase III
D) The end of phase III
E) The middle of phase IV
C
Which of the following best describes the change in the carrying capacity of the human population if growth is limited by conditions set forth by the Malthusian theory?
A) The carrying capacity will increase, and the human population size will grow exponentially.
B) The carrying capacity will remain constant, and the human population size will stabilize.
C) The carrying capacity will remain constant, and the human population size will experience an overshoot.
D) The carrying capacity will decrease, and the human population size will experience a dieback.
D
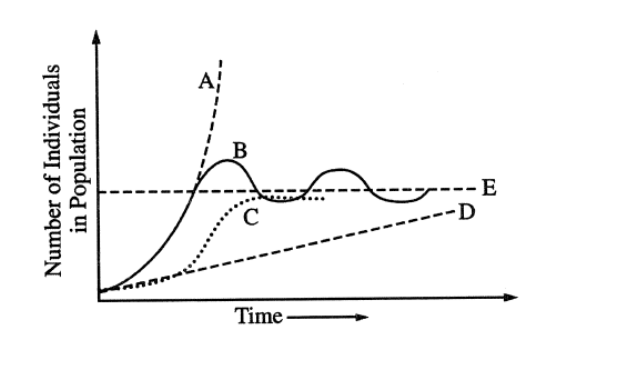
Represents the biotic potential of the species
A) A
B) B
C) C
D) D
E) E
A
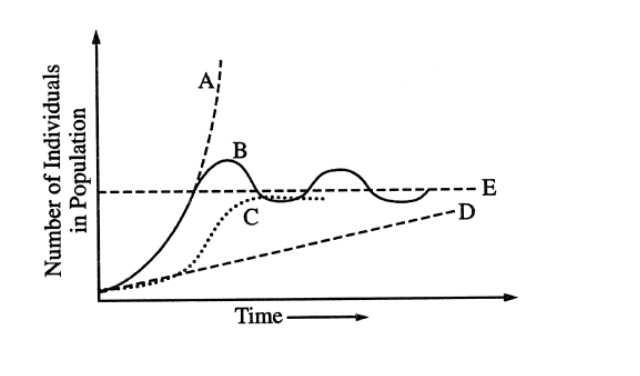
Represents the maximum number of individuals that can be supported by a particular ecosystem on a long-term basis
A) A
B) B
C) C
D) D
E) E
E
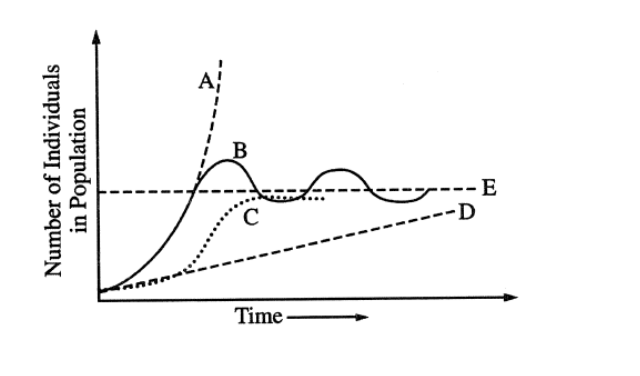
Represents the growth of a population predicted by the logistic model
A) A
B) B
C) C
D) D
E) E
C
In a human population undergoing the demographic transition, which of the following generally decreases first?
A) Birth rate
B) Death rate
C) Average family size
D) Life expectancy
E) Level of education
B
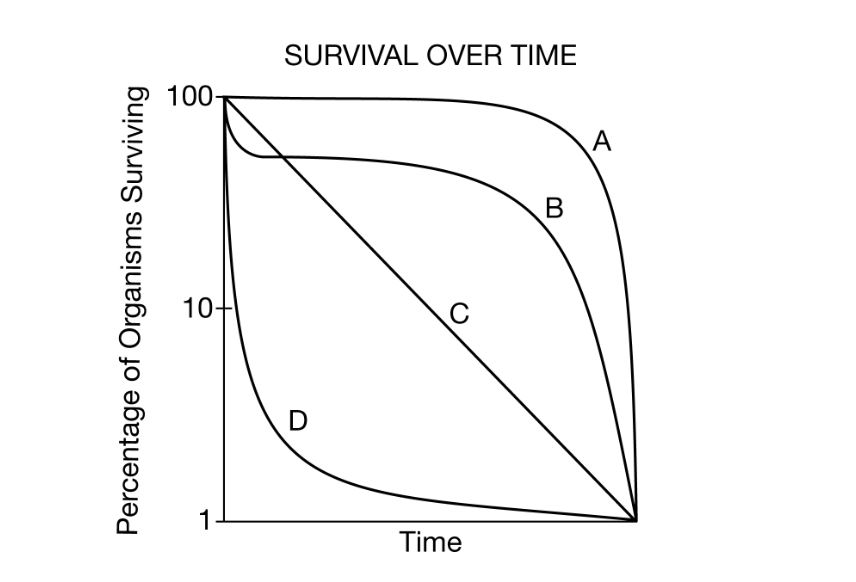
Dandelions grow quickly and produce many seeds, ensuring that at least some plants will survive and produce seeds themselves. Which curve best represents the survivorship of dandelions?
A) A
B) B
C) C
D) D
D
The spotted lanternfly is a herbivorous insect that is native to Asia and feeds on over 70 species of plants. The feeding behavior of the spotted lanternfly damages plants, and the nymph and adult lanternflies secrete sticky residues that exacerbate the damage to native plant species by promoting mold growth. The spotted lanternfly reproduces once during its lifetime by laying between 30 and 50 eggs, and the eggs hatch after a short amount of time. The range of the spotted lanternfly is increasing because the insects are transported to new environments by the movements of animals and people, and it is now found in many parts of the United States.
Which of the following best describes the spotted lanternfly in the United States?
A) The spotted lanternfly is a K-selected and invasive species.
B) The spotted lanternfly is a K-selected and endangered species.
C) The spotted lanternfly is an r-selected and invasive species.
D) The spotted lanternfly is an r-selected and endangered species.
C
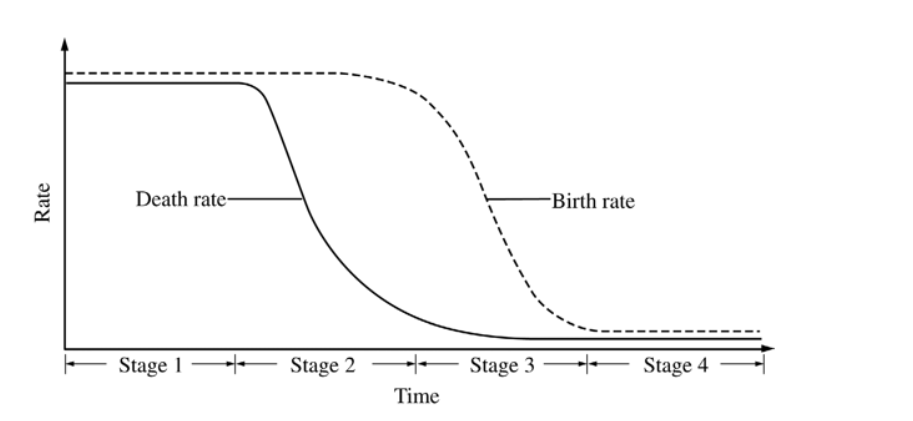
During which stage of the demographic transition shown above does a population begin to experience an explosive increase in growth?
A) Stage 1
B) Stage 2
C) Stage 3
D) Stage 4
E) After stage 4
B
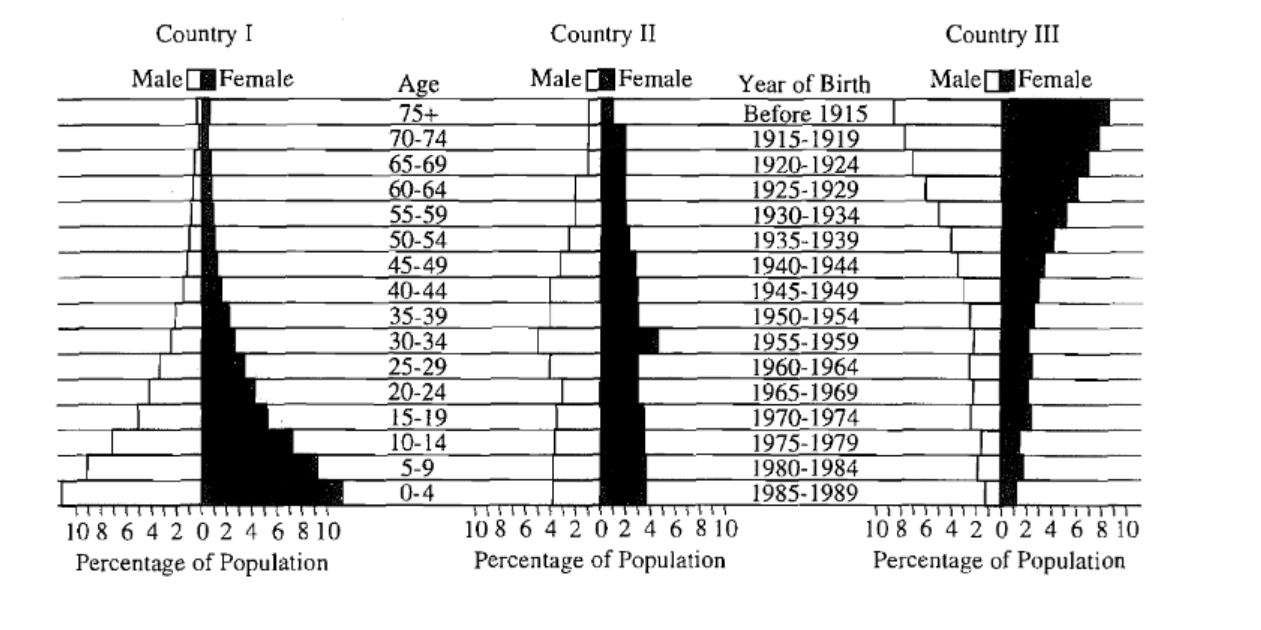
Countries undergoing rapid populations growth include which of the following?
A) I only
B) II only
C) III only
D) II and III only
E) I, II, and III
A
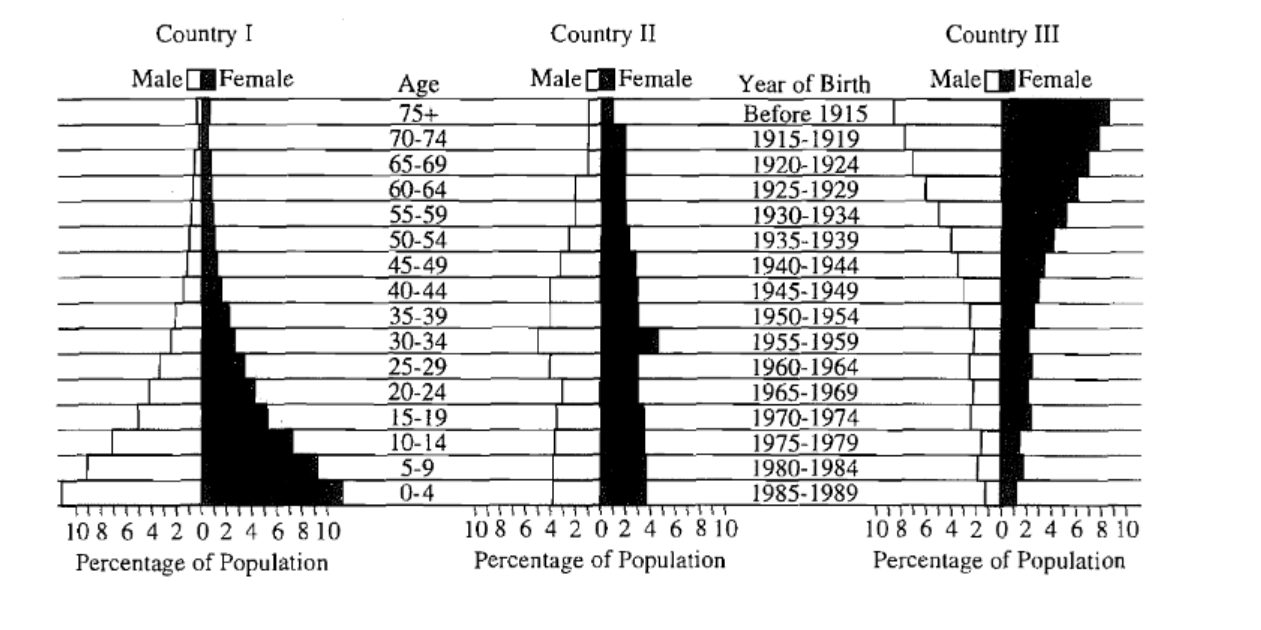
Approximately what percent of the population in Country II is under age 15?
A) 1%
B) 5%
C) 10%
D) 25%
E) 50%
D
If the population of a country grows at a rate of approximately 5 percent per year, the number of years required for the population to double is closest to
A) 5 years
B) 10 years
C) 15 years
D) 25 years
E) 35 years
C
The K-selection reproductive strategy maximizes survival of offspring by producing
A) few offspring with high levels of parental care
B) few offspring with low levels of parental care
C) many offspring with high levels of parental care
D) many offspring with low levels of parental care
E) many offspring without parental care
A
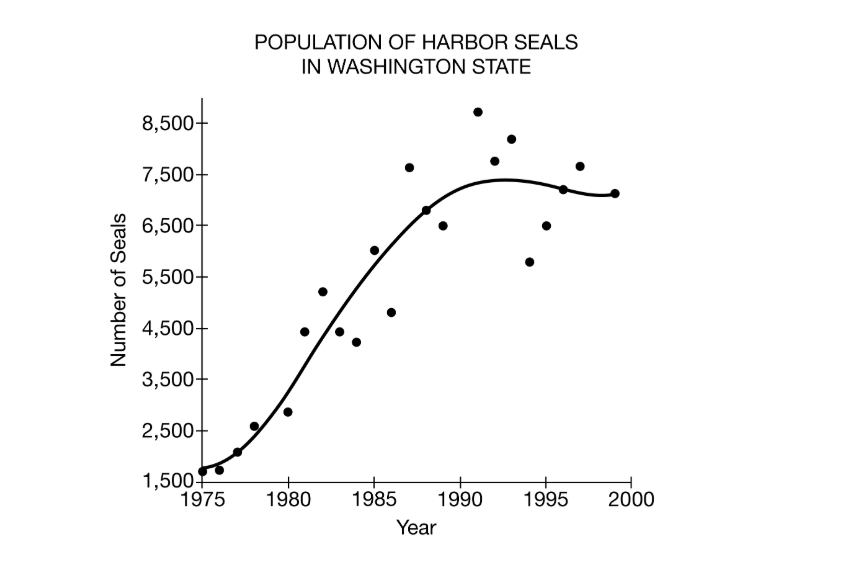
Based on the graph, what is the approximate carrying capacity of the seal population?
A) 1,500
B) 4,500
C) 7,500
D) 8,500
C
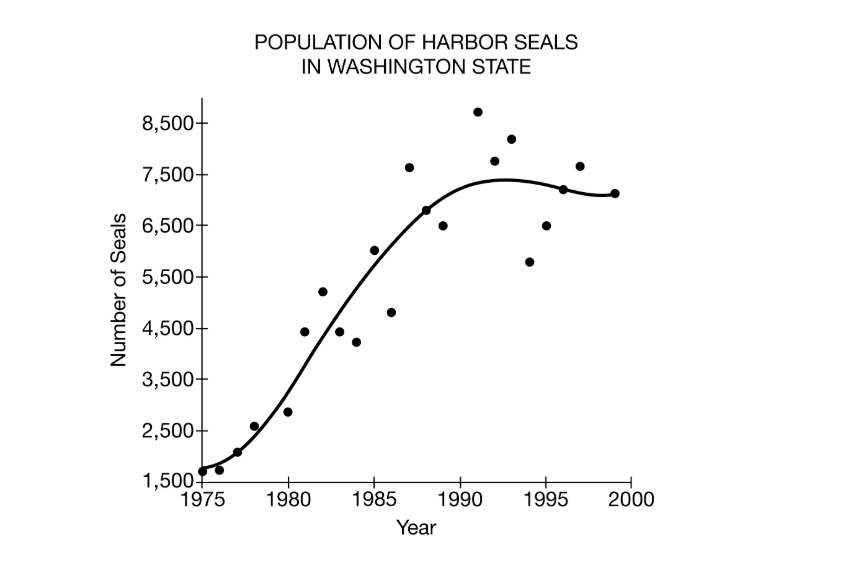
Based on the data in the graph, which of the following best identifies the reproductive strategy of harbor seals?
A) Type II
B) Type III
C) K-Selected
D) r-Selected
C
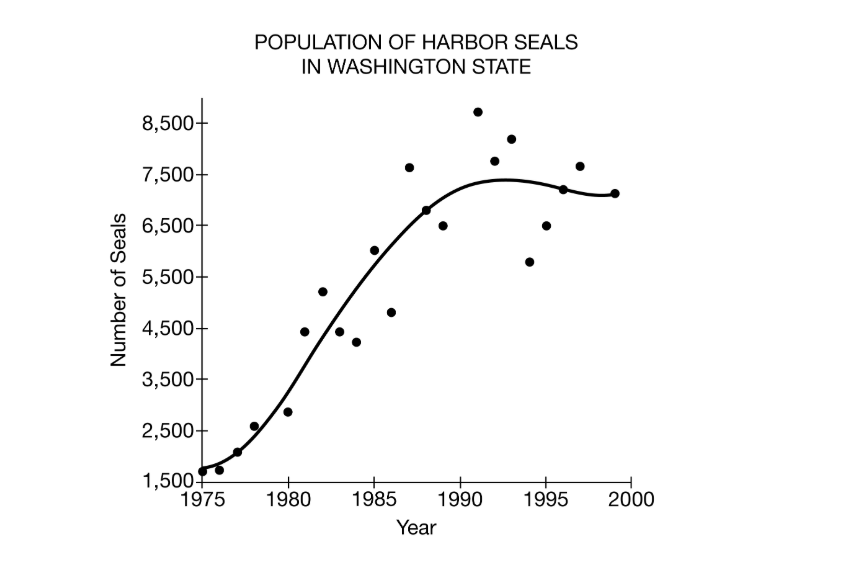
Based on the data in the graph, which environmental factor would have most likely lead to the change in the harbor seal population size from 1980–1990 ?
A) Increased availability of food
B) Decreased resistance to parasites
C) Increased competition with carnivores
D) Decreased number of primary producers
A
Which of the following best describes a transform boundary?
A) An area where two tectonic plates move away from each other
B) An area where two tectonic plates slide past one another
C) An area where two or more tectonic plates collide
D) An area where two or more tectonic plates fuse together at a suture zone
B
The Sun’s radiation provides the energy for all of the following EXCEPT
A) plant growth
B) ocean currents
C) hurricanes
D) plate tectonics
E) cloud formation
D
This layer of Earth’s atmosphere contains the fewest molecules of the layers shown, and the low density of gas leads to very few molecules transferring heat to an object. In this layer, ultraviolet radiation causes photodissociation of molecules, creating ions.
A) Troposphere
B) Stratosphere
C) Mesosphere
D) Thermosphere
D
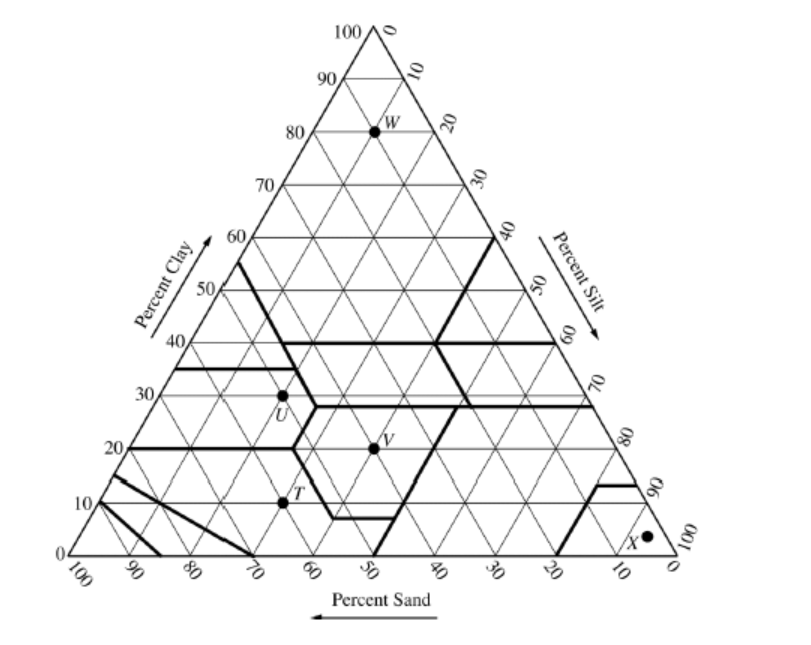
Which soil composition would be the best choice for lining a landfill?
A) Point T
B) Point U
C) Point V
D) Point W
D
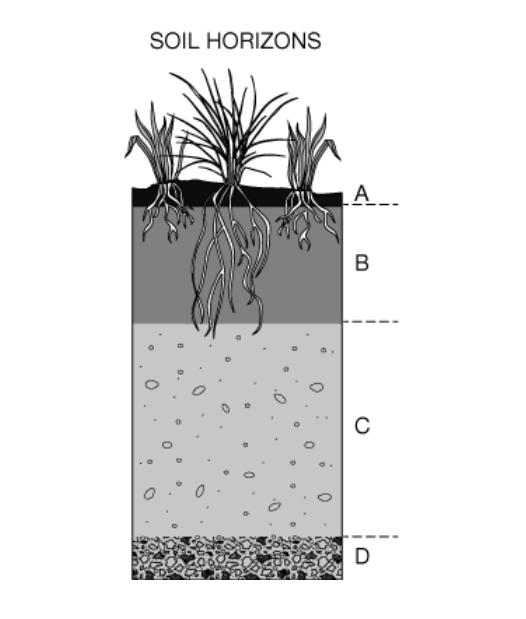
Which soil horizon has very little organic matter and accumulates soluble metals and nutrients that are transported from other soil layers?
A) A
B) B
C) C
D) D
C
The primary cause of Earth's seasons is the
A) constant tilt of Earth's rotational axis with respect to the plane of its orbit around the Sun
B) changing distance of Earth from the Sun at different times of the year
C) periodic wobbling of Earth on its axis of rotation
D) changing relative positions of Earth, its Moon, and the Sun
E) periodic changes in solar energy output
A
A farm is experiencing extensive crop loss due to high rains causing overly saturated soils. Which of the following approaches would best help the farmer alleviate the problem?
A) Amending the soil with sand to decrease the permeability of the soil
B) Amending the soil with clay to increase the water-holding capacity of the soil
C) Fertilizing the area with compost or green manure to improve soil structure and drainage
D) Using contour plowing to decrease soil erosion
C
Of the following, which has the greatest permeability?
A) Clay
B) Loam
C) Sand
D) Silt
E) Humus
C
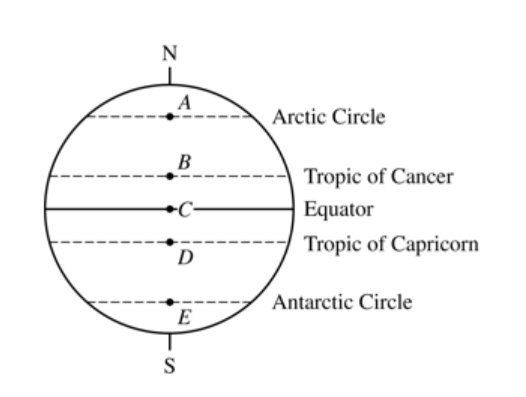
Which latitude shown on the diagram above experiences 24 hours of daylight on December 21?
A) A
B) B
C) C
D) D
E) E
E
Corn is a crop that grows best in soil that drains well.
Which of the following soils is best suited to grow corn?
A) Clay because it has at least 45% clay so it absorbs water very well.
B) Silt loam because it is about 80% silt and has low amounts of sand.
C) Sandy loam because it has large amounts of sand and less than 20% clay.
D) Silty clay loam because it has all three soil components.
C
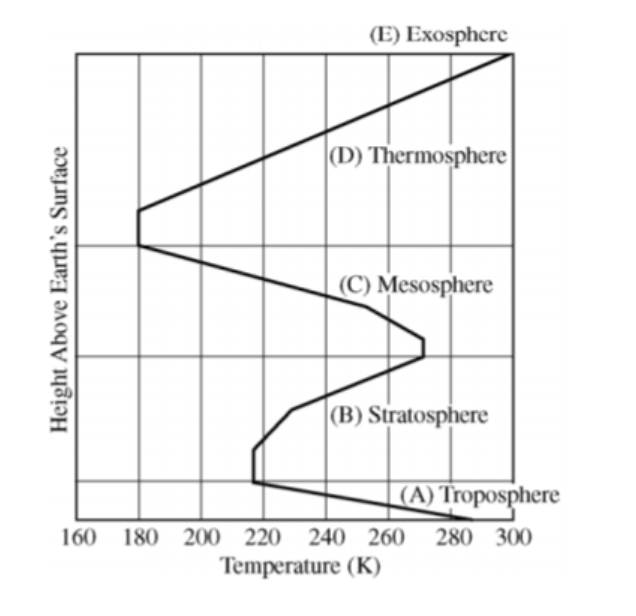
Region where the protective ozone layer is located
A) Troposphere
B) Stratosphere
C) Mesosphere
D) Thermosphere
E) Exosphere
B
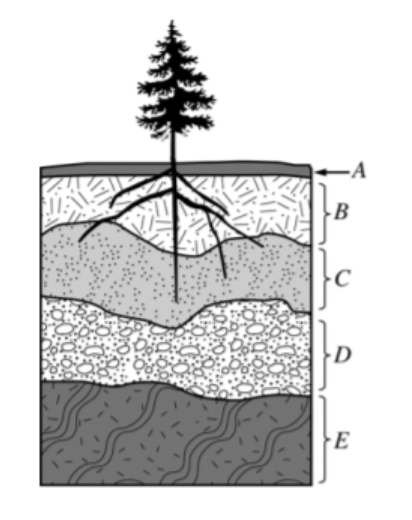
Which of the lettered choices in the soil profile above represents the region with the greatest concentration of organic material?
A) A
B) B
C) C
D) D
E) E
A
Which of the following shows the approximate concentration of CO2 , N2 , and O2 in dry air?
A
CO2 | N2 | O2 |
78% | < 1% | 21% |
B
CO2 | N2 | O2 |
43% | < 1% | 56% |
C
CO2 | N2 | O2 |
36% | 8% | 56% |
D
CO2 | N2 | O2 |
10% | 70% | 20% |
E
CO2 | N2 | O2 |
< 1% | 78% | 21% |
E
The water-holding capacity of soil is LEAST likely to be affected by the addition of which of the following?
A) Clay
B) Humus
C) Manure
D) Pesticide
E) Sand
D
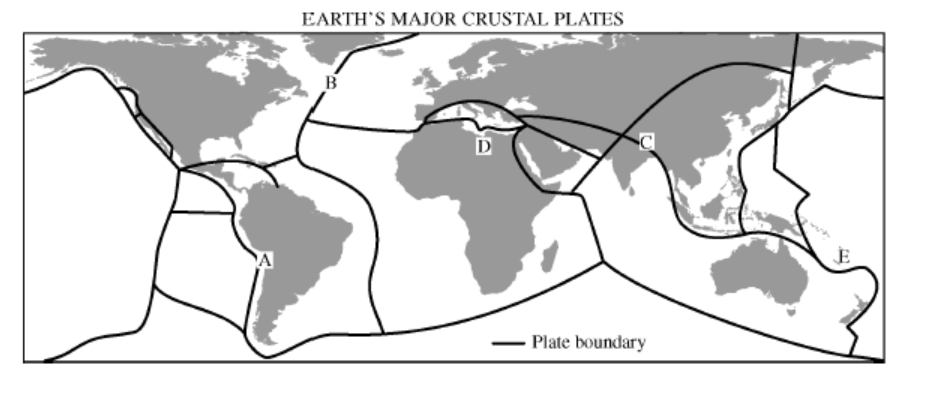
Area that exhibits island arcs
A) A
B) B
C) C
D) D
E) E
E
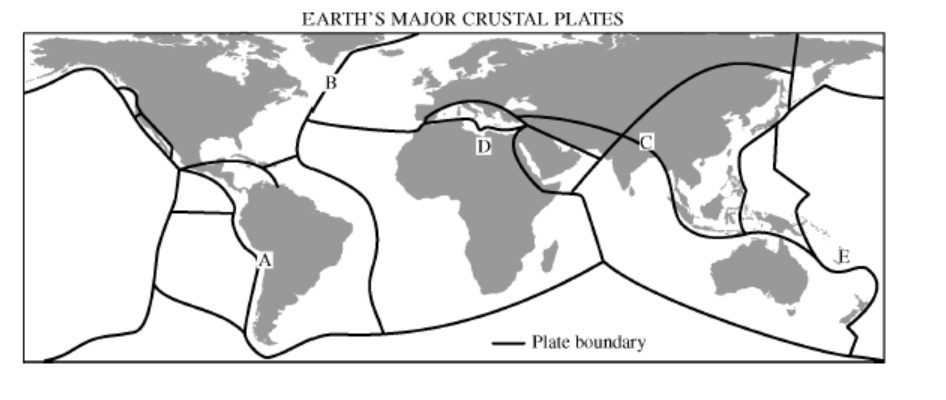
Area where new crust is being created at a divergent plate boundary
A) A
B) B
C) C
D) D
E) E
B
Which of the following does NOT exert a major influence on Earth’s overall climate?
A) The annual amount of solar radiation that reaches Earth’s surface
B) The concentrations of the specific gases in Earth’s atmosphere
C) The distribution of land masses and oceans, in combination with Earth’s topography
D) The daily rotation of Earth on its axis, and its annual revolution around the Sun
E) The seasonal development of temperature inversions in geographical basins
E
Which of the following is the correct order of soil particles in order of increasing size?
A) Clay—sand—silt
B) Clay—silt—sand
C) Sand—clay—silt
D) Sand—silt—clay
E) Silt—clay—sand
B
Most deserts on Earth are located near the 30° north and 30° south latitudes because humidity is lower at 30°. The best explanation for the lower humidity is that
A) warm air rises at 90° latitude, cools, and sinks at 30°
B) cool air rises at 30° latitude, warms, and sinks at the equator
C) warm air rises at the equator, cools, and sinks at 30° latitude
D) trade winds transfer moisture away from 30° latitude
E) rain-shadow effects are most pronounced at 30° latitude
C
The city of London in the United Kingdom is found approximately at the same latitude as the city of Calgary in Canada. Calgary has an average high temperature in December of −4.6 degrees Celsius, while London has an average high temperature of 8.6 degrees Celsius.
Which of the following statements best explains why the average temperature of London is warmer than that of Calgary in December?
A) Oceanic currents warm the atmosphere in London.
B) The solar radiation reaching London is more perpendicular than the solar radiation that reaches Calgary in December.
C) London is farther from the North Pole than Calgary is.
D) The Hadley cell converges over London and pushes warm air toward the surface.
A