PSYC204 post midterm content
 Call Kai
 Learn
 Practice Test
 Spaced Repetition
 Match
 Flashcards
 Knowt Play
1/30

Earn XP
Description and Tags
starting from 11/5/26 lecture
31 Terms
how to do the calculation example with two groups
determine critical value for decision rule using the degrees of freedom
calculate mean and sum of squares for each group
calculate the pooled variance
calculate the SE of the mean difference and the t-statistic.
in addition to the result of the hypothesis test, we can calculate the (estimated) effect size (cohen’s d) = x1-x2)/sqrt(sp2)

what does a cohen’s d of -1.68 mean, in the example
the money handling group has 1.68 standard deviations less discomfort than the non money handling group. tells you the size of the effect that is largely independent of the sample size.
how do you interpret r²?
Always between 0 and 1. the percentage of variance in the dependent variable that we can explain using the independent variable.
what is the confidence interval formula for estimating 𝜇1-𝜇2
[mean difference estimate from the sample data] ± [critical t value corresponding to the alpha and df for the hypothesis test] multiplied by [standard error of the mean difference, from the sample data.]

what is the rule for confidence intervals when estimating mean difference
if the C.I. includes 0, then it is not a significant effect. if it doesn’t, the group difference was significant.
null hypothesis for mean differences
𝜇1-𝜇2 = 0
assumptions you make when using an independent samples t-test
observations from each sample are independent
the two populations the samples come from must have a normally distributed dependent variable
the two populations the samples come from must have equal variances of the dependent variable (also called the homogeneity of variance assumption)
Hartley’s F-max test : what do large and small variances indicate?
large value indicates large difference between sample variance
small value (near 1.00) indicates similar sample variances
4 things you need to know to conduct the hypothesis test about the homogeneity of variances
alpha level
K - how many samples you have
Df - for each sample variance
critical value is either in or not within critical region
dependent samples (or paired sample) t test. repeated measures/within-subjects design
used when you have two scores from each participant. two time points of data from the same group of people. (eg comparing ppl before and after treatment). you can have a repeated measures design with more than two time points (but the dependent samples t test is specific to situations where you compare two time points).
what is difference score in repeated-measures designs
difference score = D = X2-X1. where X1 is the person’s score in the first treatment and X2 is the score in the second treatment. The null states that the mean difference is zero.
what does the alternative hypothesis indicate in repeated-measures research design
reflects the true mean difference in the population (not sampling error, which is measured by the standard error of the differences)
dependent samples t statistic
mean difference score for the group, over the standard error of the mean of the difference scores. structurally, it is similar to the other statistics we have learned, the key difference is that the mean is not from the raw score, it is the difference between two scores.

standard error for dependent samples t statistic formula

advantages of repeated-measures designs
the same ppl measured twice tend to have less variability than two different groups of ppl. less variability can make it easier to se and detect an effect, repeated measures design can have more statistical power. even though the ppl are different from one another, their differences aren’t. it’s the mean and standard dev of these differences you are interested in for this test.
disadvantages of repeated-measures designs
you sometimes lose ppl in the study (drop-outs), which decreases your sample size. Order effects or having people participate in two treatments can influence the results of a study.
effect size for dependent samples t-test
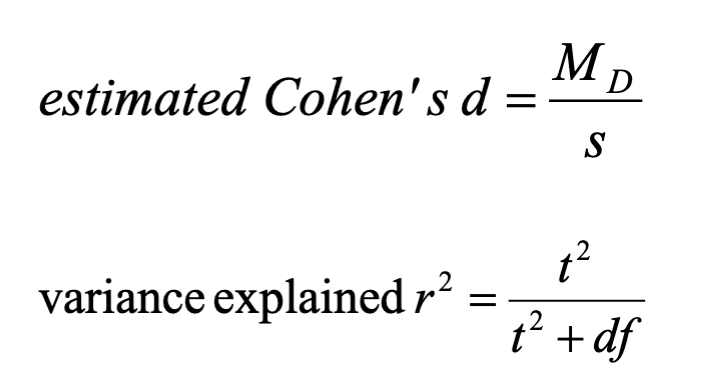
what do you need to calculate the confidence interval for the dependent samples t test
alpha value from corresponding statistical test
critical t-value associated with that alpha value
the mean of the differences from the sample data
the standard error of the mean of the differences, estimated from the sample data.

assumptions for a dependent samples t test
observations within each treatment condition must be independent. So, your original sample of ppl that you got for both measurements was independent and random. population of difference scores (D values) must be normally distributed.
example of dependent samples t test
table with all score
get difference scores, then get the mean xbar D . Get deviation scores. (D-xD) and sum of squares. do hypothesis test. H0: 𝜇D= 0. if you’re using alpha=.05, then you’re looking for the t value that cuts of 2.5% in the tail. with whatever degrees of freedom you have. if df=8, it’s ±2.306. t=(xbarD-𝜇D)/SxD. s2= SS/n-1. SxD = sqrt(s2D/n). if t=-4, you would reject the null hypothesis in this scenario. this would say that the treatment has an effect and it’s bad.
assuming that the sample mean difference remains the same, which of the following sets of data is most likely to produce a significant t statistic?
n =15 and SS=10
n=15 and SS=100
n=30 and SS=100
n=30 and SS=10
n = 30 and SS =10