Applied Genomics Test 3
 Call Kai
 Learn
 Practice Test
 Spaced Repetition
 Match
 Flashcards
 Knowt Play
1/67

There's no tags or description
Looks like no tags are added yet.
68 Terms
Nanopore Health
Active pores decrease over time due to protein degradation; pore blockage; electrochemical shifts
N50
The shortest contig length at which longer or equal-length contigs cover at least 50% of the total assembly length.
Phred Scores for Short Read Sequencing vs Nanopore

Why might some barcodes not have worked for nanopore?
A-tail fail?, lost DNA?, barcodes didn’t ligate?
Phred Score
If I assign a quality score of 30 to a base, the chances that this base is called incorrectly is 1 in 1000.

What is added during nanopore library prep?
A tail: Adenosine nucleotide ligated to the ends of the amplicon sequence. The ‘A’ overhang facilitates binding to the molecular barcode, which has a corresponding ‘T’
Molecular Barcode: Sample-specific DNA sequence or ‘tag’, used to label each different sample/amplicon so they can be uniquely identified later
Sequencing Adaptor: Functional DNA structure required for sequencing platform to attachment and recognition, allows fragments to be sequenced
Data Analysis Pipeline for Prac
If all evaluated markers match the pandemic strain (Au3). The sample is identified as Au3. (Au3 = pandemic strain in Australia)
Consensus sequence
A representative sequence of all the aligned reads
Takes into account the most 'popular' nucleotides at each site and creates a single representative sequence
Useful in Nanopore sequencing as sheer weight of numbers eliminates the individual errors inherent in any one single read
Compare the consensus sequence to global isolates Au3

When populations are forced into decline, strong filtering of the available chromosomes in the population can occur. This includes:
Reduction in Effective Population Size (Ne) and Selection
Reduction in Effective Population Size (Ne)
Increased genetic drift: loss of genetic variation by chance
Increased inbreeding: increase of homozygosity in individual genomes
Selection (population filtering)
Selection in animals and plants has occurred due to humans and this put unknown genes under selection
Runs of homozygosity (ROH)

Runs of Homozygosity (ROH)
Continuous stretches of DNA on a chromosome where the genetic sequences inherited from both parents are identical (homozygous).
Features of Runs of Homozygosity
Detects inbreeding when pedigrees are unavailable or don’t exists
Can detect the generational distance - ROH segments are typically shorter for unrelated animals and longer for animals with more recent common ancestors (e.g. families)
ROH segments are typically shorter in outbred populations and longer in inbred populations
In a population, ROH describes a region where many individuals are homozygous
Linkage-Disequilibrium and ROH
Size of the ROH segments are determined by the population linkage-disequilibrium (LD).

ROH Example
90% of Dobermans worldwide are homozygous for a 3.2Mb segment on chromosome 2
Shows the section in blue is found in most dobermans
This could be because this region is under selection - maybe artificial selection for a certain coat colour, etc.
Could also be because these genes are really key for survival

How are ROH tests carried out?
Scanning (5 SNP frame, no het, no missing) and scores for each SNP the proportion it appears in a homozygous window
Homozygous SNP = blue, heterozygous SNP = grey
Frame with first 5 and then move over 1 and continue
If we allow one heterozygote in our ROH, then the ROH here includes SNPs 1-8
If we do not allow any heterozygotes, then the ROH includes SNPs 1-6
Applied Context of ROH
Use ROH to determine regions where more diversity needs to be introduced to reduce vulnerability to disease or environmental changes
Need to be discerning about which regions are important and what need more diversity - don’t want to add diversity to a region important for survival
Linkage Equilibrium (LE)
Definition: Alleles at different loci are independent; knowing one allele tells you nothing about the other.
Frequency: Haplotype frequencies equal the exact product of their individual allele frequencies (D = 0).
Cause: Occurs when genes are on separate chromosomes, far apart on the same chromosome, or when sufficient time and random mating have allowed recombination to randomize associations.
Linkage Disequilibrium (LD)
Definition: Alleles at different loci show a non-random association and tend to be inherited together more or less often than expected by chance (D ≠ 0).
Frequency: Specific allele combinations (haplotypes) appear at higher or lower frequencies than expected (D > 0 or D < 0).
Causes: Physical proximity on a chromosome (limiting recombination), genetic drift, population bottlenecks, natural selection, or founder effects
How many markers are included in your data for ROH? .tped and .tfam files
Each line in a .tped file represents one marker (columns = individuals)
So wc -l file name.tped
How to calculate how many markers should be expected in each segment for ROH
Number of segments = assembled genome size (b)/LD segment size (b)
Then divide the number of markers by the expected number of segments. This informs for SNP window
Genotyping rate
The percentage of successfully identified genetic variants (genotypes) out of the total attempted markers or samples in an assay.
Ex. How much of the genome is homozygous for AUR?
1034.050/650800 which is KB/genome size
= 0.00158889059 x 100 = 0.16%
If more than 90% of the population have the marker then it would be considered fixed/near fixed
Linkage Disequilibrium Decay
The rate at which the non-random association between genetic variants (r²) decreases as the physical distance between them on a chromosome increases.
Determines how well a typed tag SNP can represent untyped neighboring variants.
What does --homozyg-window-snp no. mean?
The number of SNP markers in a sliding window used to identify runs of homozygosity (ROH)
50 is the default but can be changed
Smaller window (e.g., 20 SNPs): More sensitive to local changes, but potentially more affected by noise.
Larger window (e.g., 100 SNPs): Evaluates a broader region, potentially producing more stable calls but possibly missing shorter ROH regions.
What does plink --tfile filename --missing --out apple_qual_roh code?
A quality-control step performed before runs of homozygosity (ROH) analysis.
Part of the output is the genotyping rate that determines the proportion of genotype data that was successfully recorded, rather than being missing, for each individual or SNP - want it to be as close to 1 as possible
What is --hymozyg-gap 200?
Specifies the maximum physical distance, in kilobases (kb), allowed between two consecutive SNPs within the same ROH before PLINK treats the gap as too large.
A smaller gap, such as
200, is stricter about large distances between consecutive SNPs.A larger gap, such as
1000, allows ROH segments to span larger gaps between markers.
What does --homozyg-window-missing 0 do?
A scanning window is allowed to contain zero missing genotype calls for that window to count as a homozygous window hit
Can change the parameter
What does --homozyg-window-het 0 do?
PLINK does not allow any heterozygous genotype calls in a scanning window for that window to qualify as a homozygous-window hit.
Using a small number like 0 may exclude genuine ROH regions containing occasional heterozygous calls caused by biological variation or genotyping errors
How to run a ROH?
plink --tfile apple_Amyotte_2017 --homozyg-gap 200 --homozyg-window-missing 0 --homozyg-snp 5 --homozyg-window-het 0 --out apple_homozyg
How to determine the number of ROH?
wc -l apple_homozyg.hom then -1 for the header row
.hom file
Individual ROH regions
Lists each detected ROH, including the individual ID, chromosome, start and end positions, number of SNPs, and physical length.
Use it when: You want to count ROH regions, examine their genomic locations, or calculate their lengths.
.hom.indiv
ROH statistics per individual
Summarizes the ROH results for each sample, typically including the number of ROH segments (
NSEG), total ROH length (KB), and average ROH length (KBAVG).Use it when: You want to compare individuals or calculate the average number of ROH per sample
.hom.summary
Summary of ROH results
Provides aggregate statistics describing the ROH analysis, such as the distribution of ROH counts or lengths, depending on the PLINK version and options used.
Use it when: You want an overview of ROH patterns across your dataset.
How to determine the highest number of homozygous individuals at any marker in the array (for ROH)?
gawk ‘{print $1, $2, $3, $4, $5, $4+$5}’ Filename.hom.summary > Filename.hom.summary.combined
sort –g –k 6 Filename.hom.summary.combined | tail
apple_homozyg.hom output meaning
KB is the size of the ROH and NSNP is the number of markers and Density is the number of markers per kb
Basic Process of GWAS
Access the DNA of phenotyped individuals
Genotype your samples - genetic markers from across the genome
Narrow down the region/s of the genome that causes the disease
Cases and Controls for GWAS
Cases are the individuals with the phenotype (trait) of interest
Controls are the individuals that do not have the phenotype of interest
This can be difficult when there are individuals between phenotypes such as personality traits, intelligence, late onset (ex. Alzheimer's), etc.
Ex. GWAS for coat colour
White coat colour is recessive so screen genetic markers across the genome of phenotyped dogs to find a place/s in the genome where all the white dogs have the same alleles and are homozygous for these alleles and all the dogs that aren’t white do not have this
How many individuals are needed for GWAS?
Depends on mendelian or complex inheritance
If the trait is mendelian then you need fewer individuals if it’s recessive
If the trait is complex then the phenotype will be affected by many genes and environmental factors and so many markers are required - often 1000s of individuals in open, large, outbred populations (ex. humans)
Dominant mode of inheritance typically requires more samples
Manhattan Plot
Created by taking log10 of the p-values which makes the smallest scores higher numbers so you can notice it on a graph.
What does GWAS measure?
Do cases have a different allele frequency than controls?
The more differences = more likely it’s linked to the disease
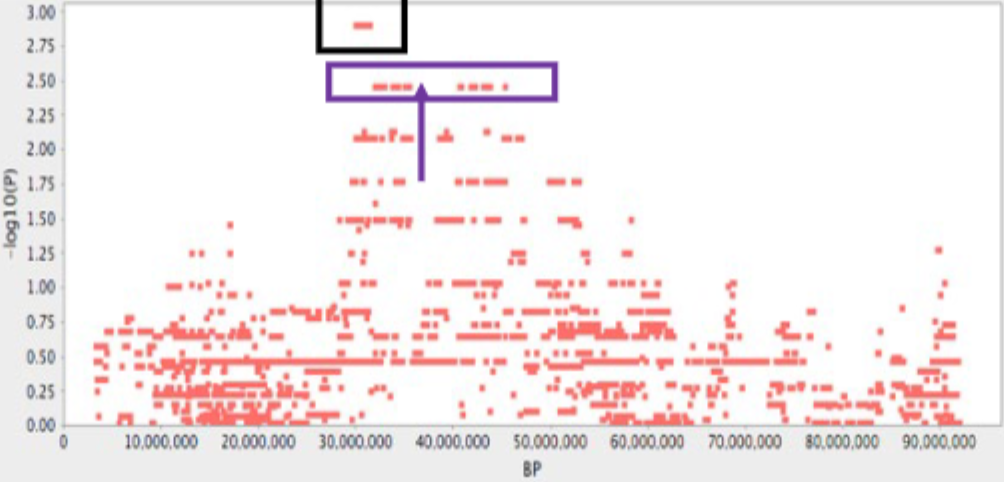
GWAS for a Single Chromosome
Zoomed into a single chromosome
Large stripes show haplotypes that are inherited together
Long runs are more likely to be related recently
For this data the black shows the most likely mutation but the mutation was actually found in the purple box - GWAS is to narrow down
How to Narrow Down for GWAS
Find the right mutation using comparative genomics of syntenic regions (using a model genome from an animal that shares a common order of homologous genes derived from a common ancestor)
Increase power - increase the number of individuals → more statistical power, clearer graphs
What happens in GWAS when there’s two causes?
Can happen with incomplete penetrance (some individuals who carry the allele do not express the trait
Also if there’s multiple causes cause it heterogeneous
Multiple-Test Correction
Need to adjust the p-value of GWAS given that there are so many tests. Adjust the p-value to an acceptable threshold for significance using Bonferroni test.

Bonferroni Test
Very stringent - overcorrects
Does this because they aren’t really independent tests
Ex. 10000 tests = 0.05/10,000, if you get Bonferroni p-value of 0.00001x10,000
Do this but instead use the number of segments instead of number of tests
The number of SNPs = # independent tests
Population Stratification
Population differences in allele frequency and diversity
Occurs when genetic allele frequencies differ across distinct subgroups within a population
Main causes include: selective sweeps, founder effects, genetic drift
Selective Sweeps
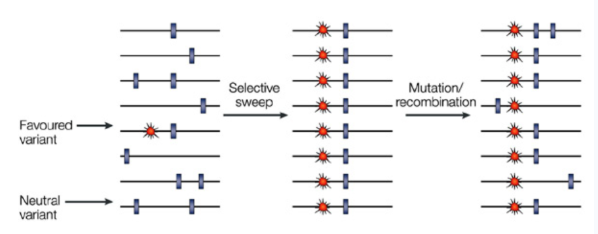
Reduction or elimination of variation among the nucleotides in neighbouring DNA of a mutation as the result of recent and strong positive natural selection (could also be breeding)
Low frequency chromosomes and variants are often lost
Popular sire effect: happens when a single male animal—such as a champion stud dog, horse, or cat—is used extensively for breeding across a population. Causes loss of genetic diversity and spread of hidden diseases,
Founder Effect
A reduction/change in genetic diversity that happens when a small group of individuals breaks away from a larger parent population to establish a new, isolated colony.
Genetic Drift
Change of the genetic gene pool simply by chance
Not necessarily the better or healthier individuals
Affects the genetic makeup of the population
Random process
Larger effect on small populations
Describes random fluctuations in the numbers of gene variants in a population
Stratified and Unstratified Mapping
Unstratified mapping:
All animals from the same population
Stratified mapping:
Animals from different populations
Results in large interference and busy Manhattan plot
Simple Disease
Diseases that follow a simple, or single gene, pattern of inheritance
Entirely controlled by one gene, with other genes and outside factors having little influence
Diseases inherited in this way are typically qualitative
Individual either has the disease or they don’t
Gene = Disease
Complex Diseases
Multifactorial diseases
Diseases usually controlled by not one, but many different genes
Complex diseases are also affected by environmental factors, such as nutrition, living conditions, and quality of life
Genes + Environment = Disease
No genetic predisposition + Environmental triggers = No symptoms of disease
Genetic predisposition + No environmental triggers = No symptoms of disease
Genetic predisposition + Environmental triggers = Highly varied severity of symptoms
Multiple-dimensional Scaling (MDS)
Use MDS plots to detect “population stratification” and are very important to correct for population stratification.
Measure the similarity among samples
Individuals that are closely related will plot closer together
Signs of a true association in GWAS
Signs of a true association
Variant sites are significant after Multiple-test correction
Multiple variant sites in the vicinity show similar signal
Localised signal
Signal is validated

Is this SNP data in GWAS good quality?
It is low quality because there should be 3 distinct clusters and they should be vertical.
What does =VLOOKUP(B1, Phenotypes!B:D, 3, FALSE) do?
| The value you want to look up. |
| The worksheet where Excel searches. |
| The search range: columns B, C and D. |
| Return the value from the third column of that range (column D). |
| Require an exact match |
What does --allow-no-sex mean for GWAS?
Tells the software not to automatically treat the phenotype as missing for individuals whose sex is unknown or unspecified.
What does --geno 0.05 mean for GWAS?
A SNP quality-control filter that removes markers with more than 5% missing genotype calls.
What does --maf 0.05 mean for GWAS?
It filters out SNP markers whose minor allele frequency is below 0.05 (5%). SNPs with MAF at or above 5% are retained. Low-frequency variants may have few copies of the minor allele, which can reduce statistical power and make association estimates less stable in small studies.
How to perform GWAS?
plink --tfile canine --dog --allow-no-sex --geno 0.05 --maf 0.05 --assoc --out canine_gwa
sort -g -k 9 canine_gwa.assoc > canine_gwa_sorted.assoc
head canine_gwa_sorted.assoc
Java -jar Haploview.jar
Opens haploview to view GWAS
Once open select the PLINK format
Select non-SNP
Results file: .assoc file
Then click OK
Manhattan Plot in Haploview
X-Axis = index
Y-Axis = p then click untransformed and pick -log10
Threshold1 = 5
Threshold2 = 7
Colour key = CHR
MDS plot option = 2
Minor allele frequency < 0.05
SNP call rate > 0.90
--mds-plot 2 - makes it 2D
--maf 0.05
--geno 0.1
Z0 and Z1
If two individuals have a low value for Z0 (unshared) and a very high value for Z1 (share one allele at each locus) and PI_HAT = 0.5, then they are likely parent-offpring. If they have a lower Z1 and higher Z2 then they are likely to be full sibs.