Sustainability - session 7
 Call Kai
 Learn
 Practice Test
 Spaced Repetition
 Match
 Flashcards
 Knowt Play
1/39

There's no tags or description
Looks like no tags are added yet.
40 Terms
What are the six learning objectives of the Systems Thinking session, and what is expected in the exam? READ ONLY
Distinguish between linear thinking and systems thinking when analyzing problems.
Recognize and anticipate unintended consequences.
Apply the key concepts of systems thinking.
Analyze reinforcing and balancing feedback loops.
Interpret and construct causal loop diagrams.
Identify leverage points for system change.
Exam: Students must demonstrate these abilities through multiple-choice questions involving previously unseen situations.
Q2: What is linear thinking, and what are the main steps in its problem-solving approach 4? What limitation is there?
Linear thinking assumes that problems can be solved through a relatively straightforward sequence of cause and effect.
The four steps are:
Define the problem.
Find its cause.
Tackle the cause.
Assume the problem is solved.
Limitation: This approach may overlook interactions, feedback effects, delays, and unintended consequences.
How does the sustainable aviation biofuel example illustrate linear thinking?
The slides present the following linear reasoning:
Problem: Sustainable agriculture is not cost-competitive.
Cause: Sustainable logistics are too expensive.
Solution: Subsidize biofuels.
Expected outcome: Lower costs for sustainable agriculture.
Linear thinking focuses on solving the identified problem without fully considering how the intervention affects the wider system.
How does the pesticide example demonstrate the unintended consequences of linear thinking?
Insect A damages crops.
Farmers spray pesticides to kill insect A.
Initially, insect A declines and crops flourish.
Over time, insect B's population increases dramatically.
Crop damage becomes even worse.
Lesson: An intervention may initially solve a problem but change ecological relationships in ways that create a more serious problem.
Why is reality often not linear, and how can a solution make the original problem worse?
Real-world systems contain interconnected variables that influence one another.
An intervention can:
Change the state of the system.
Produce unintended consequences.
Strengthen the original cause of the problem.
Make the original problem worse.
This illustrates Peter Senge's principle that today's problems can result from yesterday's solutions.
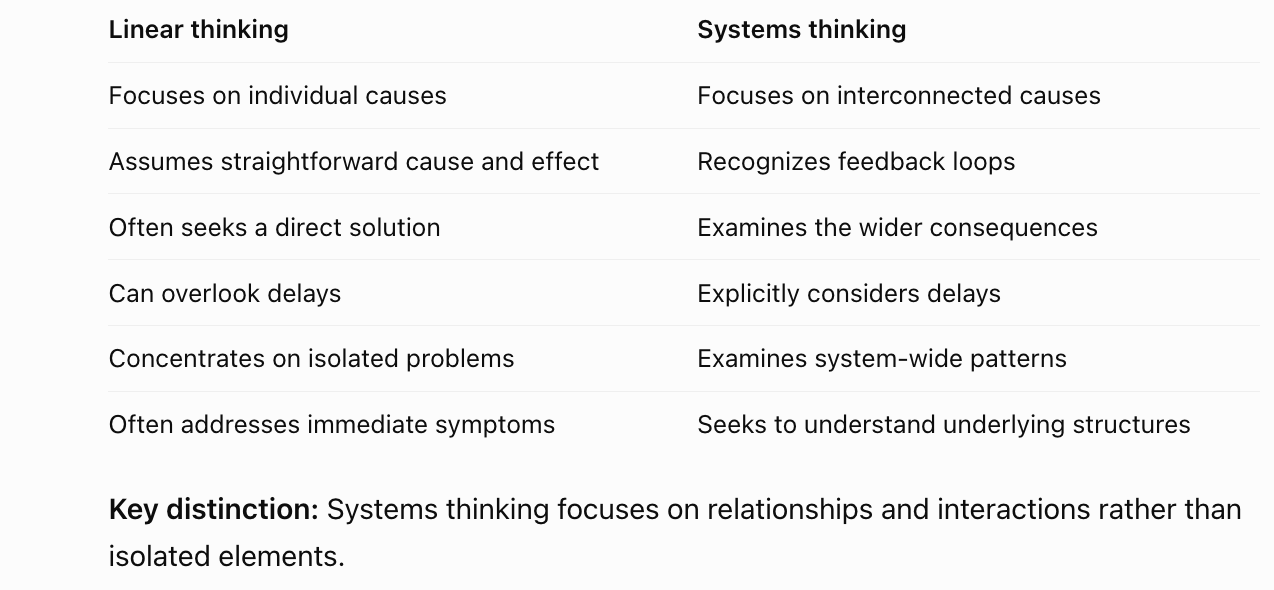
How does systems thinking differ from linear thinking? 6
How does systems thinking reveal unintended consequences of subsidizing aviation biofuels?
The slides illustrate a possible chain of consequences:
Biofuel subsidies increase demand for biofuels.
Greater demand increases the price of biofuels.
Higher prices make biofuel production more attractive to farmers.
Farmers shift agricultural production from food to biofuel crops.
Food production costs increase.
The original economic problem may worsen.
Lesson: A policy that appears beneficial in isolation can create negative consequences elsewhere in the system.
How does the sustainable aviation fuel (SAF) comparison illustrate systems thinking?
The slide compares aviation fuel pathways using feedstocks, technology readiness, greenhouse-gas savings, sufficient raw materials, and potential conflicts with food production.
It distinguishes:
First-generation bio-SAF from oil crops, such as rapeseed, soybean, and palm.
First-generation bio-SAF from starch crops, such as corn and sugarcane.
First-generation bio-SAF from waste fats, used cooking oil, and tallow.
Second-generation bio-SAF from cellulosic residues, such as agricultural, forestry, and municipal waste.
E-kerosene made using renewable energy and captured CO₂.
Lesson: No fuel pathway should be assessed on emissions alone. Resource availability, technological readiness, and competing land or food uses also matter.
What is a system according to Raworth (2017) AND Meadows (2009)?
Raworth (2017): A system is a set of interconnected elements whose relationships create distinct patterns of behavior, including emergent behavior.
Meadows (2009): A system is an interconnected set of elements organized coherently to achieve something.
Common idea: A system's behavior arises from the relationships between its components, not simply from the components individually.
What is emergent behavior, and why is it important in systems thinking?
Emergent behavior refers to patterns or outcomes that arise from the interactions between individual parts of a system.
These patterns cannot necessarily be understood by examining each component separately.
For example, recurring fluctuations in agricultural production and prices may arise from interactions between demand, production decisions, and delays rather than from one isolated cause.
What are the four main elements of a system's structure?
Stocks and flows: Accumulated quantities and the rates at which they change.
Variables: Forces or pressures operating within the system.
Feedback loops:
Balancing feedback (−): Stabilizes or counteracts change.
Reinforcing feedback (+): Amplifies change.
Delays: Time gaps between causes and their effects.
These elements interact to determine system behavior.
What are stocks and flows, and how does the bathtub analogy illustrate their relationship?
Stock: A quantity accumulated at a particular moment.
Inflow: A rate that increases the stock.
Outflow: A rate that decreases the stock.
Bathtub analogy:
Water in the bathtub = stock.
Water entering through the tap = inflow.
Water leaving through the drain = outflow.
The stock increases when inflow exceeds outflow and decreases when outflow exceeds inflow.
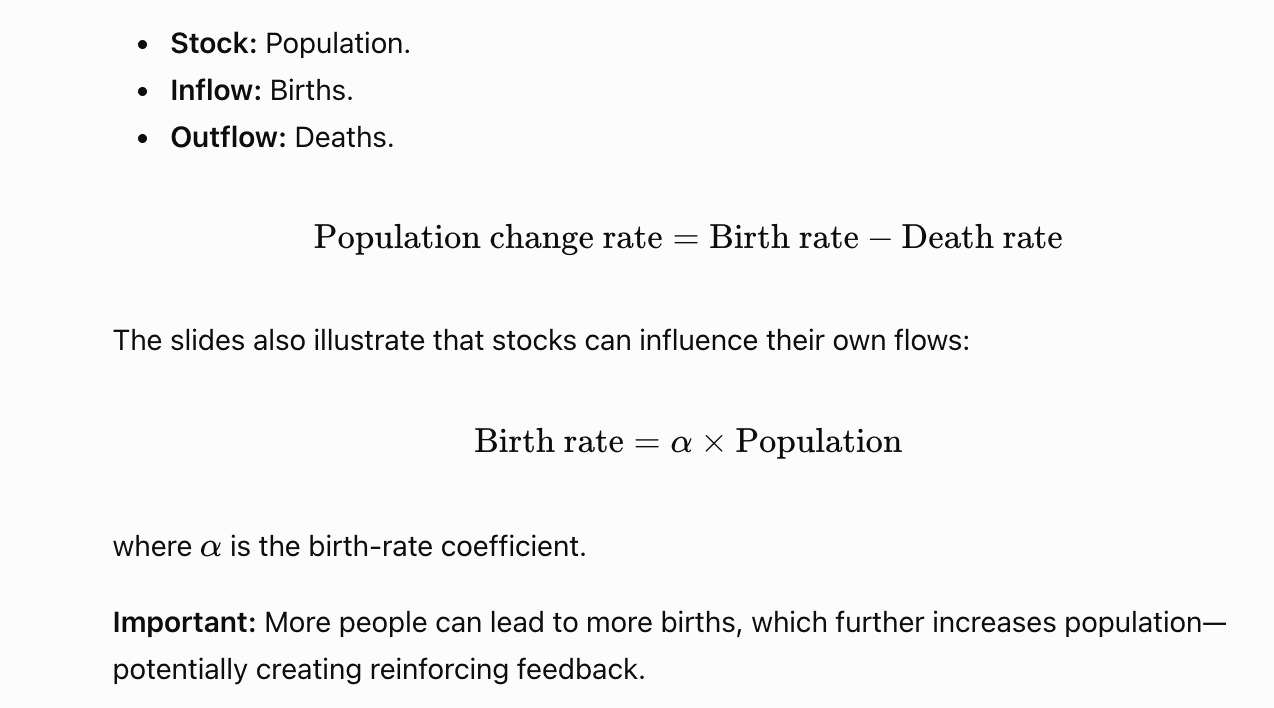
What is the mathematical relationship between stocks and flows?

How do stocks and flows work in a population system?
How does the carbon bathtub analogy explain climate change?
Stock: Accumulated atmospheric CO₂.
Inflow: CO₂ emissions.
Outflow: CO₂ removal or absorption, such as uptake by forests and other sinks.
Atmospheric CO₂ increases whenever emissions exceed removals.
Critical MCQ distinction: Reducing emissions does not automatically reduce atmospheric CO₂. If emissions remain higher than removals, atmospheric CO₂ continues accumulating, although at a slower rate.
The slides use this relationship to connect CO₂ emissions, atmospheric concentrations, and global warming.
Can a stock represent something intangible rather than physical? Give the example from the slides.
A: Yes. Stocks do not always have to represent physical quantities.
The slides use the level of hope that climate change can be addressed as an example.
Building hope increases the stock.
Losing hope decreases the stock.
This shows that systems thinking can also analyze social and psychological variables.
What is a causal loop diagram (CLD), and what do the arrows and +/− signs represent?
A causal loop diagram visualizes relationships between variables in a system.
Arrow: Shows the direction of a causal influence.
Positive (+) relationship: The variables change in the same direction, all else equal. If A increases, B increases; if A decreases, B decreases.
Negative (−) relationship: The variables change in opposite directions. If A increases, B decreases; if A decreases, B increases.
Important MCQ distinction: A positive relationship is not necessarily beneficial, and a negative relationship is not necessarily harmful. The signs indicate the direction of change.

What is a reinforcing feedback loop, and how does it affect system behavior?
A einforcing feedback loop (R or +) amplifies an initial change.
An increase can cause further increases.
A decrease can cause further decreases.
It is associated with self-reinforcing or runaway dynamics.
It can produce exponential growth or decline.
Example: A larger population produces more births, which further increases the population.
What is a balancing feedback loop, and how does it affect system behavior?
A balancing feedback loop (B or −) counteracts an initial change.
It pushes the system toward stability or an equilibrium.
It limits or corrects deviations.
It may create oscillations, particularly when delays are involved.
Example: Increasing supply puts downward pressure on prices, which can discourage additional production.
How can you determine whether a causal loop is reinforcing or balancing by examining its signs?

What is a delay in systems thinking, and how is it represented in causal loop diagrams?
A delay is the time between a change in one variable and its effect on another variable.
Delays mean that consequences are not immediate.
They can make system behavior difficult to predict.
They can contribute to overshooting, oscillations, and unexpected outcomes.
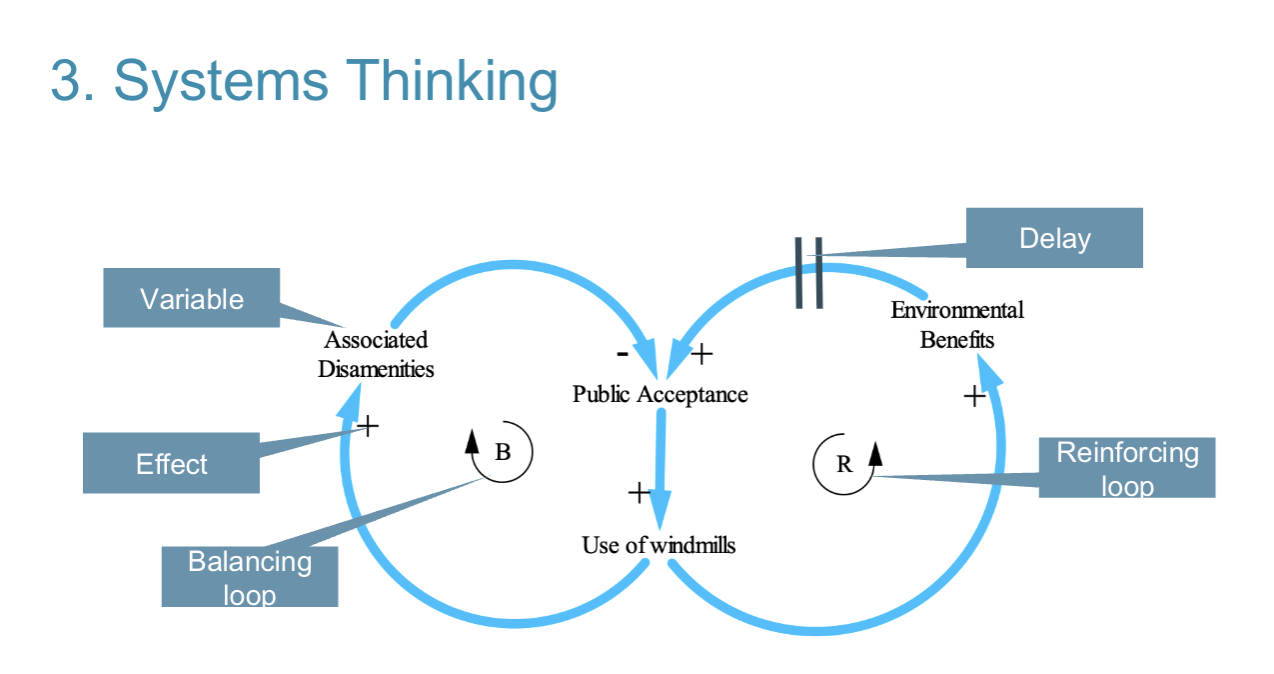
Diagram notation: Delays are commonly represented by two short parallel lines crossing a causal arrow, as shown in the windmill diagram on slide 19.

How does the windmill example demonstrate a balancing feedback loop?
The slide illustrates:
Increased use of windmills increases associated disamenities (+), such as perceived disturbances.
Increased disamenities reduce public acceptance (−).
Lower public acceptance reduces the use of windmills (+ relationship between acceptance and use).
The overall loop has one negative relationship, making it balancing.
Result: Increasing windmill use may generate opposition that ultimately limits further adoption.
The slides describe this as a potential Not In My Backyard (NIMBY) effect.
How does the windmill example demonstrate a reinforcing feedback loop?
The slide illustrates:
More windmills produce more environmental benefits (+).
More environmental benefits increase public acceptance (+).
Greater public acceptance encourages more windmills (+).
All three relationships are positive.
Result: Increased windmill use generates benefits that encourage further adoption, creating a reinforcing cycle.

How can reinforcing and balancing loops operate simultaneously within the same system?
A system may contain multiple interacting feedback loops.
Windmill example:
Balancing loop: More windmills → more disamenities → lower public acceptance → fewer additional windmills.
Reinforcing loop: More windmills → more environmental benefits → higher public acceptance → more windmills.
Both loops influence the same variable: public acceptance.
The resulting behavior depends on their relative strength and the delays involved.
What is the difference between the behavior typically produced by reinforcing and balancing loops?

How do system parameters and delays influence feedback-loop behavior?
In balancing systems, parameters and delays influence whether the system smoothly approaches equilibrium, overshoots, or oscillates.
In reinforcing systems, parameters influence the speed at which growth or decline accelerates.
Delayed responses may cause decisions to be based on conditions that have already changed.
Key principle: Feedback structure drives the general behavior, while parameters and delays influence its speed and pattern.

How does the electric vehicle (EV) example illustrate intended and unintended consequences?
The slides first show the intended chain:
Lower EV production costs.
Increased EV production.
Decreased internal combustion vehicle (ICV) production.
Reduced CO₂ emissions.
Increased sustainable transportation.
However, increased EV production can also:
Increase lithium mining.
Increase water stress.
Increase toxic waste.
Reduce some of the expected sustainability benefits.
Lesson: An intervention can improve one aspect of sustainability while creating negative environmental effects elsewhere.

What do the EV, pesticide, and biofuel examples have in common, and what general principle do they demonstrate?
All three demonstrate unintended consequences arising from system interconnections.
Pesticides: Killing one pest contributes to a greater problem involving another pest.
Biofuels: Subsidizing biofuels may increase pressure on food production.
EVs: Expanding electric vehicles may increase resource extraction and environmental pressures.
General principle: Improving one variable does not guarantee an improvement in the entire system.
Why is it difficult for humans to intuitively understand complex systems, and why should we study feedback structures?
Complex systems contain many interconnected variables, feedback relationships, and delays.
These interactions make it difficult to intuitively predict every consequence of an action.
The slides emphasize two principles:
The feedback structure of a system determines its behavior.
Recognizing patterns of behavior helps us understand the underlying structure.
Systems thinking therefore examines recurring patterns instead of treating each event as isolated.
What is the pork cycle, and why do fluctuations in pork prices matter 5?
The pork cycle refers to recurring fluctuations in pork production and prices.
The slides present historical Dutch pork-price data showing persistent oscillations, with cycles of approximately 5–6 years, becoming shorter after 1990.
Price oscillations matter because they:
Make cash flows difficult for farmers to forecast.
Cause demand to fluctuate.
Make sales forecasts less reliable.
Can lead to overproduction, waste, or dumping.
Can also cause shortages of food.
How does pork production work, and why are delays important in the pork cycle?
The production process is:
Young sows mature into breeding sows.
Breeding sows produce newborn pigs (farrows).
Young pigs grow into mature pigs.
Mature pigs are slaughtered to produce pork.
The slides state that the process from a young sow to a slaughtered pig takes around 17 months.
Why this matters: Farmers cannot immediately adjust pork supply when market demand changes, creating delayed responses and the possibility of oscillations.
How do changes in supply, demand, and prices produce the pork cycle?
Pork is a fresh product, so the market must clear.
If production exceeds demand, prices fall.
When prices fall, producers reduce production.
If demand exceeds production, prices rise.
Higher prices encourage increased production.
Because production takes time, farmers' decisions may affect supply only after market conditions have changed.
Result: Repeated adjustments can cause production and prices to overshoot and oscillate.
What does the pork-cycle stock-and-flow model show, and what are its main conclusions?
The diagram on slide 37 includes:
Stock: Breeding sows.
Inflow: Young sows entering the breeding population.
Breeding process: Produces newborn pigs.
Delays: Time for maturation, breeding, growth, and slaughter.
Output: Pork supply.
Demand–supply gap: Influences decisions about expanding breeding capacity.
Adaptation time (AT): How quickly the system adjusts breeding capacity.
Maturation time (Tm): Delay before young sows enter the breeding population.
Breeding per sow (Alpha): Determines the number of offspring.
Time from breeding to farrowing (Tg).
Time from farrowing to slaughtering (Tf).
Gap in slaughtering (G): Difference between desired demand and slaughtering output.
The model demonstrates that:
Cyclical production results from the system's structure and long lead times.
Oscillations can emerge even without explicitly modeling prices and profit motives.
Simply trying to bring production close to demand can generate balancing dynamics and oscillations.
Critical MCQ distinction: Price speculation or irrational behavior is not required for cycles to emerge. Feedback and delays alone can generate them.
What are leverage points, and why are structural changes generally more effective than changing system parameters?
Leverage points are places within a system where relatively small interventions can produce substantial changes in its overall behavior.
The slides refer to Meadows' (1999) concept of moving from parameters to paradigms.
Parameter changes: Adjust quantities such as taxes, subsidies, and controls. They may produce short-term improvements without changing the underlying behavior.
Structural or paradigm changes: Alter the relationships, feedback mechanisms, or underlying assumptions of the system to create lasting changes.
Key principle: Changing the structure of a system is generally more effective for lasting behavioral change than merely adjusting parameters.
What is the iceberg model, and how does it help identify deeper leverage points?

What is the main goal of systems mapping 3, and what principles should be followed when creating a map 7?
The main goal is not to make detailed predictions, but to understand:
What effects different strategies may have.
How those effects arise and in which direction they operate.
How strategies can be optimized to achieve the greatest benefit.
Important principles:
There is no single right systems map.
Value multiple perspectives.
Learn from differing interpretations.
Ask questions when something does not make sense.
Focus on relationships, not just elements.
Use visual arrows, colors, and labels.
Accept uncertainty and ambiguity.
What is the difference between technical and contextual factors in systems thinking?

How should you approach an unfamiliar systems-thinking scenario in the exam, and what are the session's main takeaways? READ

How does the stormwater management diagram illustrate positive and negative causal relationships?
More expected rainfall → more pressure to invest in stormwater management (+).
More pressure → more investment in pipes, storage tanks, rain gardens, and green roofs (+).
More investment in these measures → less future flooding (−).
More rain gardens and green roofs → greater beauty and property values (+).
More green roofs → lower energy bills (−).
More investment in green roofs → more economic opportunity (+).
MCQ lesson: The + and − symbols indicate whether variables move in the same or opposite directions, not whether an effect is good or bad.
How does the price–production–supply example illustrate balancing feedback?
Higher prices increase production (+).
Higher production increases supply (+).
Higher supply reduces prices (−).
There is one negative causal relationship, so the loop is balancing.
The slide also shows a reinforcing population–births loop: more population → more births → more population.