intermediate macroeconomics
 Call Kai
 Learn
 Practice Test
 Spaced Repetition
 Match
 Flashcards
 Knowt Play
1/51

There's no tags or description
Looks like no tags are added yet.
52 Terms
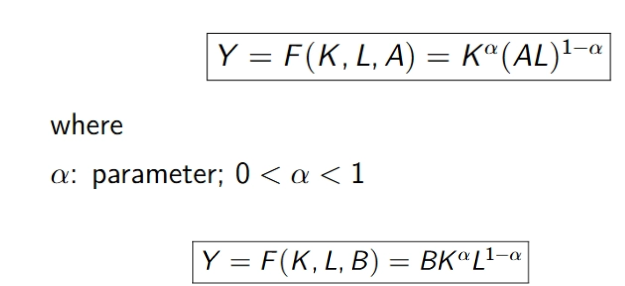
both versions of the aggregate production functions with and without B (cobb douglas)
Y: aggregate output, K: aggregate physical capital (capital stock), L: labour force, A/B: index of productive efficiency
→ divide through by L to get
Y/L=Bk^α
y=Bk^α
what is K^. (fundamental equation)
capital accumulation (in this case without investment)
could be K^. = -δK

growth rate of L
assumed to be proportional to population

MPK =
r + δ
MPL=
w
total gross income equation Y=
Y=C+I+G+NX
no government and a closed economy: Y=
Y=C+I
rewriting S as gross national saving : S=
S=Y-C=I
saving behaviour, definition and equation
S=sY=I
households save a constant fraction of their income s=S/Y
what are y, k, y^~, k^~
y=Y/L, k=K/L
y^~ = Y/AL , k^~=K/AL
output/capital per worker and output/capital per effective worker respectfully
what is k^.
fundamental equation for cobb douglas

what is gk (not in steady state)

what is k* (from the fundamental equation where k^.=0)
where k* is the steady state capital per worker

graphical representation of the fundamental equation
k must always converge to k*

solow growth model graph
lines intersect at the steady-state capital per worker
where gk=0

technological growth
A^. / A = g
or ga=g
what is true about gk and gy at the stady state
gk=gy=0
equation for the growth rate of Y (gy) on the balanced growth path
must always be true at any time t (given our production function)

equation for the growth rate of Y (gy) when the economy has reached the steady state
and n + g is the growth rate of AL, so Y* and K* grow at the same rate as AL

the fundamental equation, relationship betwen y^~ and k^~
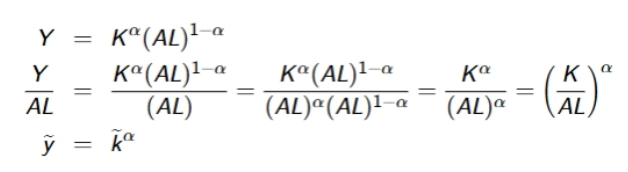
check by dividing the production through by AL
if you rewrite K^.=sY-δK

equation for growth rate of k^~ gk^~
←equalising the right hand side of the previous two equations
gk^~ = sy^~/k^~ - (n+g+δ)k^~ = sk^~α - (n+g+δ)k^~

equation for k*^~
k*^~ is the steady state capital per effective worker
k*^~ constant implies that
g*k~ = 0

what happens to g*k at the steady state?
the growth rate of capital is equal to the growth rate of labour
at steady state only n or g can raise g*k so only an increase in the growth rate of labour or population growth rate
population growth rate is zero at the steady state

what is true about k*, y*, K*, Y* (their growth over time)
all are either constant or growing at rates n or n+g so an economy that has reached the steady-state is one that’s evolving along a balanced growth path (BGP)

capital-output ratio at the steady state
this is constant

steady-state impact of a high s and a low n
if a country starts at the steady state with a saving rate s
let s increase to s’ : s’>s
which changes the point at which the red sy^~ line intersects the (n+g+δ) from k(0)^~ to a slightly higher k*^~
the decrease in n to n’ causes gradient of the blue (n+g+δ)k^~ to rotate clockwise to (n’+g+δ)k^~ to a higher k**^~ point of intersection between the lines

conditional convergence
when an economy’s growth rate is greater the further away it is from its steady state (on the balanced growth path)
eg. diminishing returns to capital and the more slowly the decline, the slower the convergence rate

if two economies are identical in all aspects except from their initial k(t)^~
economies 1&2 have the same parameter values s, n, g, δ, the same A and same production frunction
if economy 1 starts of with a lower k(t)^~/k(t) then economy 1(poorer) will grow faster than economy 2 (richer)
in this case, there will be convergence of incomes per capita over time as the poorer economy 1 catches up with the richer economy 2
conditional convergence
in a group of similar countries or regions, the poorer should go faster
→ a prediction of the neoclassical growth model
absolute convergence
poor countries should faster than the rich ones
the idea of growth accounting
considering the change of GDP(Y) over an extended period of time and trying to “account for” this change by measuring the change in all the variables of the production function
eg. capital is split into:
K(physical capital)- value of the capital stock
H(human capital)- often measured by considering average educational attainment of people 15-65 yrs old
growth accounting example using ; Y=AK^0.5(H)^0.5
H=Lh (stock of aggregate) human capital, L: labour force, h: average human capital per worker
→ taking logs on both sides of the last equation and differentiating with respect to t gives:
gy = ga + 1/2gk +1/2gL + 1/2gh
→ using r.h.s of equation there are 4 sources of GDP growth
K accumulation
growth in L (greater population/greater fraction of population in labour force)
h accumulation (improvement in educational attainment)
A accumulation (eg. better technology, structural change)
gy, gk, gL(n), gh can all be measured so ga (our g) can therefore be determined as a residual

steady state values of gy, gk, gal
g*y=n+g
gal = ga + gL = g + n
g*y = g
→ where growth rate of output per worker is only determined by g(growth rate of technology) where y=Y/L
2 key elements of government spending
expenditure on consumption of goods and services and “public capital” (eg. new hospital)
this is the G of the national income accounts identity equation
transfer payments (eg. state pensions, job seeker’s allowance, incapacity benefits, maternity pay)
affects C via its impact on household income
government spending redistributes resources in various ways (over a lifetime, across households, across generations)
over an individual’s lifetime:
pay taxes (in net terms) when “young” [20s-50s]
receive benefits (in kind and in cash) when “old”
across households:
pay high taxes if “on high income”
receive benefits if “on low income”
across generations:
introduce a state pension system with no contribution condition
or make the system more generous
what is sovereign debt
when a national government borrows money by issuing various securities
can be issued in domestic/foreign currency exposing the issuer to currency risk
credit ratings assess the likelihood of a country honouring its debt obligations, impacting borrowing terms
usually through bonds, bills or loans to fund public investment and support the economy
sovereign debt crises manifest themselves in many ways, including
downgradings by rating agencies
large increases in the cost of borrowing
difficulty borrowing in financial markets
sell-off assets denominated in home currency (a “run on the currency”
general government balance sheet (GIBC)
components are;
financial assets
nonfinancial assets
debt liabilities
nondebt liabilities

“nondebt” liabilities in the GIBC
public sector/service pensions:
these rights are legally binding (established by employment contract)
these rights have already been earned by current and past state employees
in the uk, this is bigger than “debt”
financial assets in the GIBC
loans to the private sector
equity and investment fund shares
nonfinancial assets
land, buildings
mineral resources
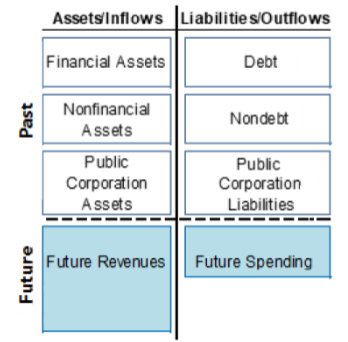
public sector balance sheet PSBS
GIBC plus public corporation assets and liabilites
components:
“nondebt” and public corporations liabilities
assets and public corporation assets

“nondebt” and public corporation liabilities in PSBS
public sector/ service pensions
liabilities of state-owned banks
liabilities of insurance companies
monetary base (central bank)
assets in the PSBS
land, buildings, mineral resources
loans to the private sector
liabilities of state-owned banks
liabilities of insurance companies
equity & investment fund shares
sovereign debt held by the bank
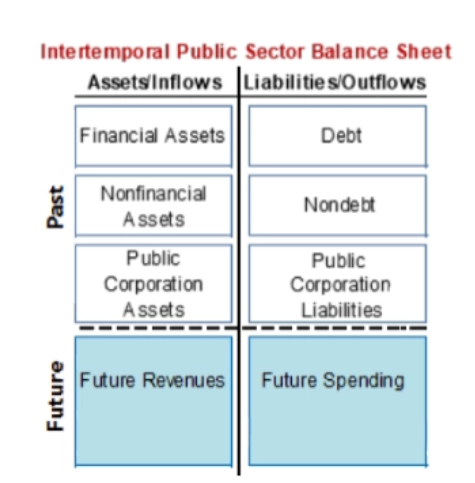
intertemporal public sector balance sheet (IPSBS)
essentially, adding the present value of future spending and revenues to the PSBS
components:
financial assets
nonfinancial assets
public corporation assets
future revenues
debt
nondebt
public corporation liabilities
future spending
future spending in the (ISPSBS)
state pension spending
health (NHS) spending
long-term care spending
education spending
future revenues in the IPSBS
taxation
profits from state-owned corporations
returns from other state-held assets
seigniorage (by central bank)
what determines a solvent government
a solvent government must have IPSBS with an assets/inflows side at least as big as the liabilities/outflows side
what a non-solvent government looks like
future revenues < future spending

what a solvent government looks like
future revenues ≥ future spending