Ecology Exam 2
 Call Kai
 Learn
 Practice Test
 Spaced Repetition
 Match
 Flashcards
 Knowt Play
1/247

Earn XP
Description and Tags
Lectures 1 - 6 and Jeopardy questions
248 Terms
What are the three survivorship curves and examples of each?
Type 1 (Convex):
More likely to die as you age. Humans
Type 2 (Diagonal)
Consistent mortality. Birds
Type 3:
High mortality at the start. Trees
What does logistic growth look like? What is an example of an organism exhibiting logistic growth, and what is K?
K = carrying capacity = the maximum number of individuals an area can support
Increases as N → K; dN/dt approaches 0
Eurasian collared doves in Britain, acorn barnacles, northern elephant seals
What is symbiosis? Name three kinds of symbiosis
When multiple organisms live together intimately, most or all of the life cycle of one organism occurs in another
Mutualism, commensalism, and parasitism
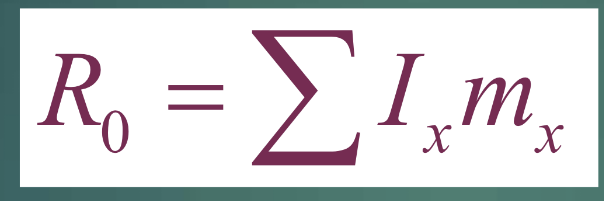
What does the equation represent? What does each variable mean?
Net reproductive rate for annual plants
R0 = Net reproductive rate (like the average number of seeds produced by an individual in a population during its lifetime)
I0 = Percent of the population surviving to each age
mx = Average number of seeds produced by each individual in each age category
x = Age interval
What is Gause’s competitive exclusion principle? What does it predict, and what does it have to do with character displacement?
Two species with identical niches cannot coexist indefinitely (leads to competitive exclusion) – Paramecia experiments
Predicts that species living together have different niches (niche partitioning)
Character displacement: Sympatric species have more dissimilar traits vs. allopatric
Six requirements:
Differences are genetic
Differences evolved when living together
Species are more different when together than when apart
Specific traits affect resource gathering/use
Similar traits lead to more competition
Traits are not caused by different locations
What are the three main methods of estimating patterns of survival?
Cohort life table: Identify individuals born at the same time and keep records from birth
Static life table: Record the age at death of individuals
Age distribution: Calculate differences in the proportion of individuals in each age class
What is a rank-abundance curve? How can you tell richness and evenness from it?
A rank abundance curve is used to display and compare biodiversity, specifically species richness and species evenness, within a community.
X-axis (Rank): Species are ranked from left to right in order of abundance, where Rank 1 is the most abundant species, Rank 2 is the second most abundant, and so on
Y-axis (Relative Abundance): The vertical axis shows the relative abundance (proportion or percentage) of each species
Richness: How many species there are
Evenness: The relative abundance and proportional representation of each species within a biological community
Lower slope = species have similar/even abundances
Steep drop = One or few species dominate the environment
How does the Lotka-Volterra predator-prey model predict predators and prey will change through time? What does a plot of predators vs. prey look like?
Predator and prey populations oscillate. Prey peak always slightly behind the predators.
Prey increase → predators increase → Prey decrease → Predators decrease
If you eliminate the time axis, there is an elliptical oscillation in predator and prey numbers
It is called a phase plot
What is the equation for geometric growth, and in what cases would you use it?
Geometric growth is a constant ratio that describes how a population multiplies during a discrete period of time
Generations do not overlap
Generations differ in size by a constant ratio
Lambda = 1 is no population growth
Example: Annual plant with abundant resources
What disturbance conditions generate the most diversity? Give an example
Intermediate levels
Intermediate disturbance hypothesis
Algae and invertebrates
Diversity of algae and invertebrates growing on boulders in the intertidal zone
Boulders supporting the greatest diversity of species were those subject to intermediate levels of disturbance
What is the exponential growth rate equation, and when would you use it?
Continuous population growth in an area where resources are not limiting
Characteristic of rebounding populations (elephants) or establishing in a new environment/during newly favorable conditions (e.g., Scots pines, whooping cranes)
dN/dt = rN
dN/dt = rate of population growth)
R = per capita rate of population increase (this is constant)
N = population size
What is the logistic growth rate equation, and when would you use it?
Accounts for carrying capcity/limiting resources
dN/dt = rmax N (1 - N/K)
Change in numbers / Change in time
Intrinsic rate of increase
As the ratio of population size to carrying capacity (N/K) approaches 1, the population growth rate approaches 0."
What are the different types of species interactions?
Mutualism +/+
Commensalism +/0
Predation/Herbivory/Parasitism +/-
Amensalism -/0
Competition -/-
What assumptions does the Lotka-Volterra predator-prey model make? What confounding variables might occur in reality?
Assumes:
Prey population grows exponentially in absence of predators
Predator population declines exponentially without prey
Predators consume prey at rate proportional to prey density
No predator interference or competition
Environment is constant
No age structure or spatial structure
Predator and prey interact continuously
Showed that predator-prey interactions could produce population cycles
What increases species diversity in a community? Give specific examples
Environmental heterogeneity/complexity
Examples:
MacArthur, birds, tree height diversity
Hutchinson’s Paradox of the plankton
Variation in soil type and depth to groundwater
What are the three types of competition? Give an example of each. What type of niche does competition affect?
Interference competition: Direct interactions between individuals where organisms actively block, fight, or intimidate others to stop them from accessing a shared, limited resource (opposite of exploitative competition)
Aggressive territory defense, production of chemical toxins
Intraspecific competition: Individuals of the same species
Self thinning
Interspecific competition: Individuals of different species
Can affect species' realized niche
What are the three types of competition? Give an example of each. What type of niche does competition affect?
A metapopulation is a "population of populations"—a group of spatially separated populations of the same species that live in fragmented habitat patches.
Connection to dispersal: Dispersal allows individuals to move between habitat patches and recolonize empty ones after local extinctions, preventing the entire metapopulation from dying out.
What is an example of a density-independent and a density-dependent factor that limits population growth?
Density-independent: Tend to be abiotic factors
Volcanic eruption
Density-dependent: Tend to be biotic factors
Reproductive success of sparrows
What is the Lotka-Volterra competition model, and what does it predict about coexistence?
Competition model that predicts coexistence when interspecific competition is weaker than intraspecific competition (related to Gause’s principle)
What are the two types of mutualism? What are examples of each?
Facultative: Species can live independently
Obligate: Depend on the relationship for survival
Can be specialized or generalist–each plays a different role in mutualism networks (specialist pollinators often interact with generalists; loss of generalist can have big consequences)
What are types of refuges?
Flight, Size, Space, Large groups, Fear
When does theory predict mutualism will occur? What factors contribute to this in the ant-plant system?
Theory predicts that mutualism will evolve when benefits are larger than costs (for combined successful and unsuccessful mutualists)
For ant plants
High probability of attracting ants
High potential for herbivory
Low effectiveness of alternative defences
High effective ant defenses
What is the difference between species richness and species diversity?
Species richness is simply the total count of different species in a community, while species diversity accounts for both the number of species (richness) and how evenly individuals are distributed among them (evenness).
How does nutrient enrichment influence species diversity?
Nutrient enrichment reduces environmental complexity, which reduces diversity (plants and algae)
Light becomes limiting, and the best light competitor dominates
Guild define & examples
A group of organisms that all make their living in a similar way
Ex: Seed-eating animals in the desert, fruit-eating birds in the tropics, filter-feeding invertebrates in tide pools
Life-form define
Life-form: Combination of structure and growth dynamics of plant (similar to guild)
What is the universal pattern of relative species abundance across different ecosystems?
Very few abundant species, very few rare species, most species are moderately abundant
Species richness define
Number of species in community
Species evenness define
Relative abundance of species
Compare/Contrast species richness and species evenness

What are possible reasons that communities could have the same species richness, but different species evenness?
Space requirements
One is more adapted with local spcies
Nutrient soil requirements

What is this equation?
Define the variables
Shannon Wiener Index: Measures evenness
H' = Value of SW diversity index
Higher = More diversity
H = 0 = One species/No diversity
Pi = Proportion of the ith species in sample
Logepi = Natural log of pi
s = Number of species in the community
What are the reasons that ecologists care about species diversity?
Ecosystem stability and resilience
Understanding ecosystem
Detecting environmental change
Comparing ecosystems scientifically
Conservation prioritization
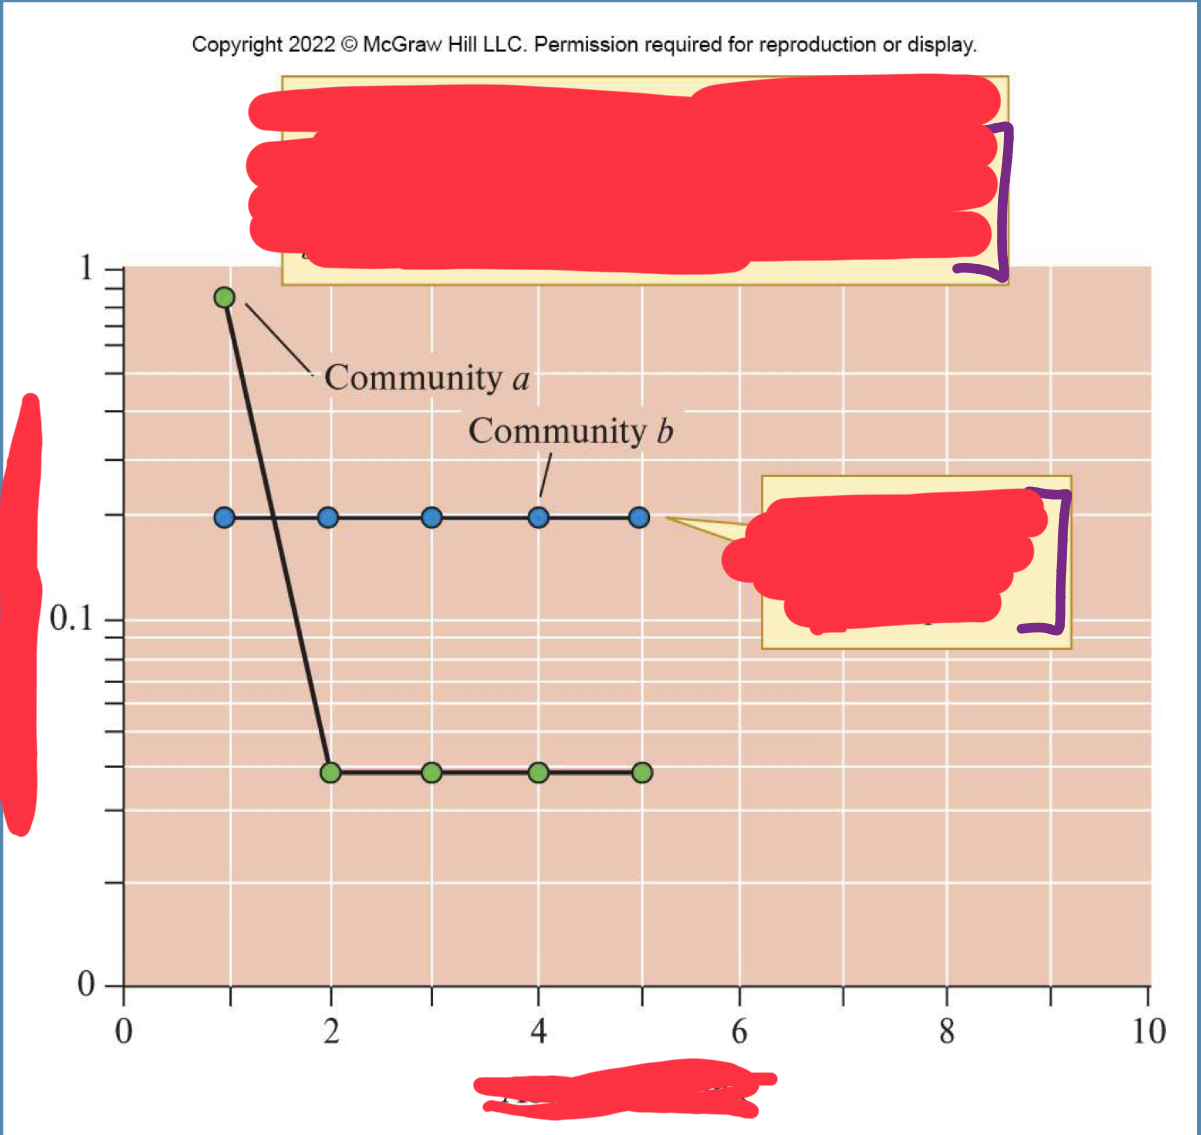
What is this curve? What do the lines/slopes represent? What are the axises?

What does a low slope indicate on a rank-abundance curve?
What does a steep slope indicate on a rank-abundance curve?
Low slope indicates greater species evenness
Steep slope indicates less species evenness
What variavles play a role in differences in evenness shown in rank-abundance curves?
Niche differences
Neutral dynamics
Competition
Predation
Environmental Factors
Disturbance
True or False: Species diversity decreases with environmental complexity or heterogeneity
False: Species diversity increases with environmental complexity or heterogeneity
Why does species diversity increase with environmental complexity?
There are more niches & resources since it is more complex
Discuss an example of diversity increasing with environmental complexity
Bird/Warbler diversity increased as vegetation stature increased
Measured complexity in the form of foliage height
Forests with the greatest volume of folaige above 6m contained five or more warbler species
What is the paradox of the plankton
Phytoplankton communities live in simple environments all competing for the same nutrients, however many species coexist without competitive exclusion
Coexistence is maintained by:
Environmental variability (Light, temperature, nutrients changing)
Predation: Preventing any one species from dominating
Spatial heterogeneity
Trade-offs among species: Growth rate vs. nutrient efficiency
Discuss the niches of algae
Algae niches are defined by their nutrient requirement
Freshwater diatoms dependend on ratio of silicate:phosphate
Diatoms vary in phosphorus uptake rate
Variation in availability of limiting nutrients contributes to environmental complexity
What are the two ways forest diversity is organized, and what drives the number of communities?
Within-community diversity: A large number of species live within most individual tropical forest communities.
Between-community diversity: A large number of plant communities exist within a given area, each with its own unique species composition.
Main Driver: Variation in soil influences the number of distinct communities
What produces differences in vegetation of short distances?
Soil type, nutrients, and depth to groundwater
Why can nutrient enrichment reduce environmental complexity/species diversity?
Competition is the most likely as it increases competitive exclusion.
Sometimes biotic factors, not always abiotic factors (like space and light monopolization)
True or False: The highest number of species of plants are found in areas with lowest soil fertility
True. Increasing nutrient availability increases competition which decreases diversity
What is an example of nutrient enrichment reducing environmental complexity/species diversity?
Fertilization has decreased plant diversity and evenness over time. Becoming steeper/less even over time
Plant diversity has progressively declined since the beginning of long-term fertilizing
Shows effects of fertilizer, agriculture, and environmental conditions
Disturbance define
A discrete, punctuated killing, displacement, or damaging of one or more individuals or colonies that directly or indirectly creates an opportunity for new individuals or colonies to become established
True or False: Disturbance is consistent from organism to organism and environment to environment
False: Disturbance varies from organism to organism and environment to environment. Disturbance for one organism may not be one for another.
What levels of disturbance promote higher diversity? Why
Intermediate levels of disturbance promote higher diversity
Low levels of disturbance allow competition to reduce diversity
High levels of disturbance reduce diversity
What are potential source of disturbance?
Abiotic factors (Fire, hurricanes, floods, etc)
Biotic factors (Disease, predation, etc)
Human-caused disturbances
Discuss examples of disturbance and diversity
Algae and invertebrates
Diversity of algae and invertebrates growing on boulders in the intertidal zone
Boulders supporting the greatest diversity of species were those subject to intermediate levels of disturbance
Prairie dogs and North American prairies
Prairie dogs build burrow systems and remove vegetation around burrows, which opens areas to plant colonization.
Disturbance by prairie dogs creates distinctive patches of vegetation
Human caused
Typically are high levels and lead to a decrease in diversity
Deforestation & Pollution
What are ways that humans pollute?
Nitrates and phosphates from fertilizers enter water systems
Leads to eutrophication
Toxic pollutants from industrial and urban areas
Plastics
What are Persistent Organic Pollutants (POPs)
They remain in the environment for decades/centuries
They resist environmental breakdown via biological/chemical/photolytic processes
What are examples of pollution in regards to animals
Beluga whales
Most toxic mammal in western hemisphere
Very saturated with agricultural run-off chemicals like pesticides
Leads to immune system dysfunction correlated to mass die-offs and suggestive of broad environmental distress
Orcas
PCB contamination of orcas which makes whales more vulnerable to infectious disease and impedes normal growth and development
Discuss biological magnification and pollution
Biological magnification concentrates industrial wastes and pesticides as they pass through the food chain.
Top-level predators are usually organisms most severely damaged by toxic compounds in the environment
Discuss microplastics and pollution
Microplastics are small enough to be eaten by zooplankton
Microplastics are too small to be captured by wastewater treatment plants, and end up in the sea
Discuss urbanization and diversity. Use examples
Urbanization can reduce bird species richness and evenness, but some landscapes still have substantial levels of diversity
Bird species richness peaks with intermediate land-use intensity
Highest species richness occurred at intermediate levels of land-use intensity
The number of native woodland bird species declines with increased land-use intensity
Levels of similarities between study sites increased with degree of urbanization
Exploitation define
Interaction that enhances the fitness of one individual while reducing fitness of exploited individual
What are the 3(4) types of exploitation
Predators
Parasites
Parasitoid
Pathogens
What do predators, parasites, and pathogens have an influence on?
Distribution, abundance, and structure of prey populations
Discuss herbivore predation/exploitation examples
Herbivorous Stream Insect Larvae influence on algal and bacterial populations
Creating controlled comparison of grazed/ungrazed surfaces using manipulated stream rocks:
Allowing larvae to graze on some rocks
Excluding larvae from other rocks
Showed that larvae reduced the abundance of algal/bacterial populations
Chlorophyll a (indicating algal biomass) increased quickly during the first 2 weeks
As the larvae colonized, the algal biomass declines
Excluding the larvae increased the number of bacteria and increased algal biomass
Bats/Birds’ effect on tropical forest arthropods
Birds exclusion increased arthropods by 65%
Bat exclusion increased arthropods by 150%. Bats have bigger effect
Dicuss pathogenic parasite effects on predators and prey examples
Mange Mites on foxes and their indirect effects on foxes’ prey
Mange mites weaken foxes, often causing death. Infected fox populations decline sharply
Population of fox prey increased
Prey species expanded area distributions
Vegetation and lower trophic levels decreased due to increased prey species
Discuss examples of trophic cascades
Mange Mites on foxes and their indirect effects on foxes’ prey
Mange mites weaken foxes, often causing death. Infected fox populations decline sharply
Population of fox prey increased
Prey species expanded area distributions
Vegetation and lower trophic levels decreased due to increased prey species
Discuss the predator/prey cycles and dynamics
Predator-prey relationships are cyclic because populations of predators and prey rise and fall in repeating patterns. They are dynamic because the patterns constantly shift with environmental conditions, resource availability, and species interactions
Why do predator-prey cycles happen?
When prey populations increase: predators have more food & predator numbers rise
As predator numbers rise: prey are eaten more quickly & prey numbers fall
With fewer prey: predators starve or reproduce less & predator numbers fall
What is an example of predator/prey cycles.
Discuss role of food supply and role of predators
Lynx and snowshoe hare cycles
Show long-term cycles in population density since 1850s
Role of food supply
In winter, hares eat buds and stems of shrubs.
Shoots produced after browsing have increased levels of chemical defenses, which reduces usasble food supplies during population declines
Role of predators
Predation can account for 60-90% of hare mortality during peak densities
Why are predator-prey interactions dynamic? What causes them to change?
Climate shifts alter food availability
Disease affects either predator or prey
Habitat changes modify hunting success
Human impacts (hunting, land use) disrupt patterns
New predators or competitions enter the system
True or False: Predator-prey systems are typically static
False. Predator-prey systems are always adjusting to new conditions
What are the predator/prey ecological important cyclic and dynamic interactions
Regulate population size
Prevent any one species from dominating
Maintain biodiversity
Influence energy flow through ecosystems
Discuss an example of food and predation impacts on prey
Hares, Predators, and Plant food supply
Found increased hare numbers with:
Increased food availability
Reduced predation
Combination of two
Concluded that the hare population cycle results from interactions among 3 trophic levels: hares, their plant food supply, and their predators
What does the Lotka-Volterra assume?
Assumes host (prey) population grows exponentially, and population size is limited by parasites, pathogens, and predators

What is this equation for?
Define the variables
Growth of Prey (host) populations
rhNh = exponential growth by host population, which is opposed by:
p = rate of parasitism/predation
Nh = Number of hosts
Np = Number of parasites/predators
What is this equation for?
What are the variables?
Growth of predator populations
cpNhNp = conversion rate of hosts into parasite/predator offspring
c is the conversion factor
p is the rate of parasitism/predation
Nh = Number of hosts
Np = Number of parasites/predators
dpNp = parasite/predation deaths
Draw a graph of Lotka-Volterra Predator-Prey model with axises names

Draw a graph of Lotka-Volterra Predator-Prey model with the removal of time with axises names

What are the seven unrealistic assumptions of the Lotka-Volterra Predator-Prey model
Prey population grows exponentially in the absence of predators
Predator population declines exponentially without prey
Predators consume prey at a rate proportional to prey density
No predator interference or competition
Environment constant
No age structure or spatial structure
Predator and prey interact continuously
What are the issues with the Lotka-Volterra model?
It predicts perfect, regulat cycles which are rare in nature
It cannot explain stability, chaos, or dampened oscillations
Ignores density dependence, functional responses, and refuges
Discuss an experiment regarding the Lotka-Volterra
Interactions between adzuki bean weevil and parasitoid wasps that attack bean weevil
Successfully produced regular, repeating cycles for over 112 generations
As prey increased → predators increased
As predators increased → prey decreased
As predator decreased → prey rebounded
Why have most laboratory experiments failed to produce L-V oscillations
Refuges
Discuss mites experiment and the importance
REGUFE
Prey: Six-spotted mite
Predator: Predatory mite
Array of 120 oranges with barriers that left 5% of the orange area exposed to the mites
Importance:
Spatial structure is essential for stable predator-prey dynamics
Real ecosystems are not simple boxes—they are patchy and complex
Predator-prey cycles depend on refuges, dispersal, and heterogeneity
Lotka-Volterra cycles are more realistic when space included
What are forms of refuges?
Trees, Water, Burrows, Flight, Size (Bigger), Space
Discuss an example of space refuges
Invasive cactus have a small isolated population as a spatial refuge, so herbivorous insects can’t find them
Discuss the five reasons for that high population density can act as a refuge
Safety in numbers (dilution effect)
Predator confusion
Predator satiation
Reduced per capita risk
Group defense
What is the ecology of fear.
The ecology of fear describes how prey change behavior, physiology, and distribution simply because predators might be present, even with predators aren’t actively killing them
What are the two ways predators influence prey? Describe them
Direct: Killing prey
Indirect: Fear alters prey behavior, reducing feeding, reproduction, or habitat use
Why does fear matter in prey? What does it do?
Reduces prey feeding
Shifts prey into safer but less productive habitats
Lowers reproduction
Increases stress hormones
Changes movement patterns
Alters group size
Discuss an example of ecology of fear and refuges
Wolves and elk
When wolves returned to Yellowstone:
Elk avoided risky riverbanks
Vegetation rebounded
Beavers increased
Songbirds returned
It was caused because elk feared wolves and changed where they grazed
Fear reshaped the landscape
Discuss examples of parasites/Pathogens that manipulate host behavior
Spiny-headed worms change the behavior of amphipods by making it more likely that the infected amphipods will be eaten by vertebrate hosts
Uninfected amphipods exhibit negative phototaxis (away from light), away from suitable vertebrate hosts
Infected amphipods exhibit positive phototaxis (towards light), which puts them closer to surface predators
Cycle:
Adult female worm lays eggs in bird intestines, bird has infected feces
Isopod eats the feces with eggs, those eggs hatch in hours, and mature in 60 days
Mature larvae alter isopod behavior making it go out into the open
Isopod is eaten by bird and the worm attaches to intestines of bird
Discuss pest control with bats
Adult female bats consume 2/3 its body weight in insects including moths, who caterpillars attack cotton fields
Pest control by bats saves the farmers over a million annually
Define variables of population growth equation
Nt = Nt-1 + B + I - D - E
Nt = Population size/density at time
Nt-1 = Population size/density at previous time
B = Births
I = Immigration
D = Deaths
E = Emmigration
Population dynamics definition
Concerned with factors influencing expansion, decline, and maintenance of populations
African Honeybees differentiation
Dispersed incredibly quickly through most of South American, Mexico, and all of Central America
High rates of colony formation and dispersal caused rapid expansion of African Honey bees
How are dispersal and local population densities related
Dispersal can increase or decrease local population densities
Eurasian Collared Doves dispersal
Spread from Turkey to almost all of Europe after 1900 in small jumps
Introduction in Barbados in the 1970s led to rapid dispersal, reaching North America by the 1980s/90s
Most fledglings disperse a few kilometers, but some disperse hundreds of kilometers
Adults are sedentary; young disperse
What two animals have high rate of expansion/dispersal?
Africanized honeybees and Eurasian collared doves
Discuss the reason for northward dispersal
Organisms began to move northward around 16,000 years ago after the retreat of glaciers and warming climate
Evidence found in pollen in lake sediments
Discuss tree expansion
Maple trees and hemlock trees have been moving upward from low/mid USA up to Canada over the past 12,000 years
Discuss dispersal in response to changing food supply
Increased prey density leads to increased density of predators
Discuss dispersal in rivers and streams
Streamlined bodies
Bottom-dwelling
Adhesion to surfaces
Define spates. What is it related to?
Spates: Sudden flooding in a stream
Related to dispersal in rivers/streams