Images: Clouds, Storms & Rain
 Call Kai
 Learn
 Practice Test
 Spaced Repetition
 Match
 Flashcards
 Knowt Play
1/118

There's no tags or description
Looks like no tags are added yet.
119 Terms

Img C001: What satellite/sensor typically makes this kind of midday 'true color' hurricane image in NASA Worldview, and what bands are used?
Aqua (or Terra) MODIS Corrected Reflectance true color: bands 1 (red, 645 nm), 4 (green, 555 nm), 3 (blue, 469 nm).

Img C002: Why can't a single MODIS true-color image tell you how intense a hurricane is?
Visible imagery shows only cloud-top reflectance (cloud structure), not wind speed or pressure. Intensity needs IR cloud-top temperatures (Dvorak), microwave, scatterometer or aircraft data.

Img C003: What are the thin, curved cirrus streaks radiating outward from the top of this hurricane?
Upper-level outflow: air rising in the eyewall spreads out at the top of the storm (near the tropopause) and turns anticyclonically, forming curved cirrus bands.

Img C004: Name two satellites that carry VIIRS and the time of day they view a location in daylight.
Suomi NPP (decommissioned November 2026) and NOAA-20/NOAA-21 (JPSS). Sun-synchronous orbits with about 1:30 pm local equator crossing.

Img C005: Which satellite/instrument and product made this image, and what does the black diagonal stripe mean?
Aqua MODIS true color (Corrected Reflectance). The black stripe is a data gap between adjacent orbital swaths, common near the equator where 2,330 km swaths do not overlap.

Img C006: What storm features in this true-color image indicate an extremely intense tropical cyclone?
A small, clear, circular eye inside a large, symmetric central dense overcast with tightly wrapped spiral bands (Super Typhoon Haiyan, Nov 2013).

Img C007: Why is it hard to separate snow from cloud in this true-color image, and what band combination fixes it?
Both snow and clouds reflect strongly in visible light, so both look white. MODIS bands 7-2-1 fix it: snow absorbs at 2.1 um (band 7) and turns cyan, while water clouds stay white.

Img C008: Identify this band combination and explain why the snow is cyan.
MODIS bands 7-2-1 (R=2.1 um, G=0.86 um, B=0.65 um). Snow/ice absorbs strongly at 2.1 um (little red) but reflects in bands 2 and 1 (green + blue), so it appears cyan.

Img C009: In a MODIS 7-2-1 image, what color are liquid water clouds versus snow?
Water clouds: white to light pink (reflective in all three bands). Snow and ice: bright cyan/turquoise.

Img C010: In a MODIS 7-2-1 image, why can ice clouds look pale cyan while water clouds look white?
Ice, like snow, absorbs at 2.1 um (band 7), so ice clouds have less red and look cyan-tinted. Liquid water clouds reflect well at 2.1 um and look white or pinkish.

Img C011: What does GOES ABI Band 2 (0.64 um) measure, and what is its spatial resolution?
Reflected sunlight (visible reflectance) at 0.64 um, the red band; 0.5 km at the sub-satellite point, the finest of the 16 ABI bands.

Img C012: What can visible imagery show about a hurricane that IR cannot?
Fine texture (overshooting tops, gravity waves, low-level cloud lines) at higher resolution, and low clouds that are hard to see in IR. It only works in daylight.

Img C013: Same storm, same time: visible (Band 2) vs clean IR (Band 13). What does each tell you?
Band 2: reflected sunlight (cloud brightness and texture, day only). Band 13: emitted IR brightness temperature (cloud-top temperature, so height), day and night.

Img C014: Why is ABI Band 13 called the 'clean' IR window?
At 10.3 um water vapor absorbs less than at the 11.2 or 12.3 um bands, so the brightness temperature is closer to the true surface or cloud-top temperature.
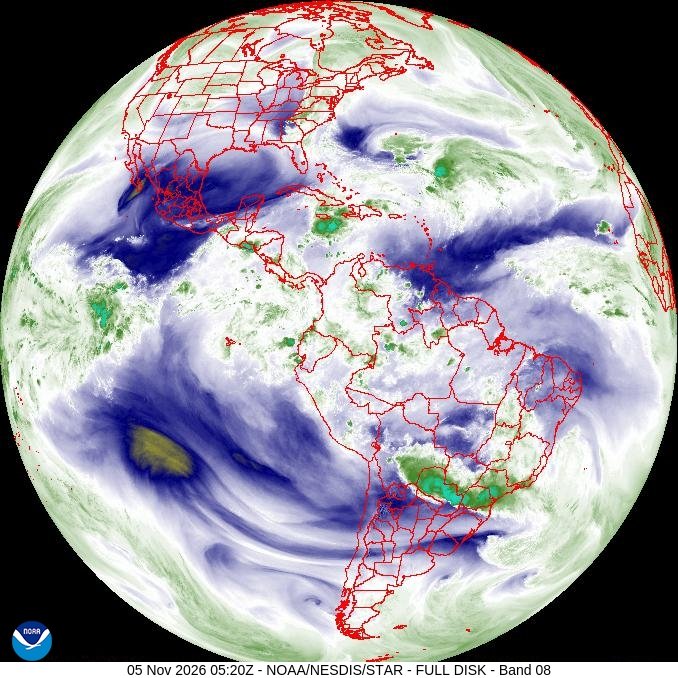
Img C015: Water vapor imagery: what does Band 8 (6.2 um) mainly 'see', and what do bright vs dark areas mean?
Emission from water vapor in the upper troposphere. Bright/white = moist and cold; dark = dry upper air, where the sensor sees down to warmer, lower layers.

Img C016: Why can water vapor bands show moisture even where there are no clouds?
At 6-7 um, water vapor itself absorbs and emits strongly, so the radiance comes from the moist layer, not the surface. The bands map invisible water vapor and upper-air flow.

Img C017: Order the three GOES-R ABI water vapor bands by wavelength and by the height they sense.
Band 8 (6.2 um) upper, Band 9 (6.9 um) mid, Band 10 (7.3 um) lower-level. Longer wavelength = weaker absorption = sees lower and warmer layers.

Img C018: Why does the Band 10 (7.3 um) full disk look much warmer (more yellow/orange) than Band 8 (6.2 um) at the same time?
Band 10 is a weaker water-vapor absorption band, so its signal comes from lower and warmer layers than Band 8 (upper troposphere).

Img C019: This is one of five GOES-19 images of the same place and time (Bands 2, 13, 8, 9, 10). Which band is this, and what gives it away?
Band 2, 0.64 um red visible: it looks like a black-and-white photograph, shows ground features (Appalachian ridges, coasts) and fine cloud texture. It works only in daytime.

Img C020: How can you tell this IR image is a 'window' band (Band 13) and not a water vapor band?
You can see the surface (land, terrain, coastlines) in clear areas. In window bands the atmosphere is nearly transparent; water vapor bands never show the ground because vapor absorbs the surface emission.

Img C021: Why can't you see the ground anywhere in this image, even where there are no clouds?
It is a water vapor band (ABI Band 8, 6.2 um). Water vapor absorbs and re-emits at this wavelength, so the signal comes from the upper troposphere, not the surface.

Img C022: Compared with the Band 8 image, why do more warm (orange-red) areas appear in Band 9?
Band 9 (6.9 um) is a weaker water vapor absorption band, so it senses lower, warmer levels. In dry air it sees even deeper, which gives warm brightness temperatures.

Img C023: Put the three water vapor images (Bands 8, 9, 10) in order from the highest layer sensed to the lowest. Which looks warmest?
Band 8 (6.2 um, upper) > Band 9 (6.9 um, mid) > Band 10 (7.3 um, lower). Band 10 looks warmest because it senses the lowest, warmest layer.

Img C024: Which GOES-R ABI band is this and what does it measure?
ABI Band 2, the 0.64 um red visible band (0.5 km, the finest ABI resolution): reflected sunlight (reflectance). Bright = thick cloud; useful only in daytime.

Img C025: What causes the bumpy, textured dome on top of this thunderstorm anvil in visible imagery?
Overshooting tops: strong updrafts punch above the anvil (equilibrium level). At low sun angles they cast shadows, making the texture stand out.

Img C026: This is GOES ABI Band 13. What does color tell you, and why is the storm core darkest red/black?
Band 13 (10.3 um longwave IR window) shows brightness temperature. Colder = higher cloud top; the dark core is the coldest, highest part of the anvil where overshooting updrafts reach the tropopause.

Img C027: Give two advantages and one disadvantage of IR (Band 13) versus visible (Band 2) for storms.
IR works at night and gives cloud-top temperature/height. Visible has finer resolution (0.5 km vs 2 km) and shows texture, but only in daylight.

Img C028: What is the small white-pink spot in the center of this IR-enhanced thunderstorm anvil, and what does it indicate?
An overshooting top: the coldest, highest cloud top, where a very strong updraft punches above the anvil into the lower stratosphere. It signals a likely severe storm (damaging wind, hail).

Img C029: What is an 'enhanced-V' in IR satellite imagery of a thunderstorm, and why does it matter?
A V-shaped area of very cold cloud top whose point sits at the overshooting top on the upwind side, with arms spreading downwind around a relatively warmer area. It marks an intense, long-lived updraft and is strongly linked to severe weather (large hail, damaging winds, tornadoes).

Img C030: Visible vs IR of the same thunderstorms: which panel shows overshooting tops more clearly at midday, and why?
The IR (Band 13) panel: overshooting tops are much colder than the surrounding anvil, so they show up as distinct cold spots. At high sun the visible anvil looks uniformly bright with few shadows.

Img C031: What are GOES-R 'mesoscale domain sectors'?
Two movable boxes (about 1000 km x 1000 km) that ABI scans every 60 seconds. When placed on the same area they give 30-second imagery, used for severe storms, hurricanes and fires.

Img C032: Why are overshooting tops colder than the surrounding anvil in IR imagery?
The anvil spreads out near the tropopause/equilibrium level. A very strong updraft overshoots higher, cooling as it rises (adiabatic expansion), so its top is colder than the anvil around it.

Img C033: Why do overshooting tops show up best in visible imagery early in the morning or near sunset?
At low sun angles the domes cast long shadows onto the flat anvil, making them stand out. At midday the anvil looks uniformly bright.

Img C034: How often can GOES-R image a storm when both mesoscale sectors are placed on the same area?
Every 30 seconds (each sector is scanned every 60 seconds, offset by 30 seconds).

Img C035: Why does this VIIRS image show a thunderstorm top in much more detail than a GOES Band 13 image?
VIIRS imagery band I5 (11.45 um) has 375 m resolution vs 2 km for ABI IR. But VIIRS flies on polar orbiters, so it sees a given storm only about twice a day, while GOES images it every 1-10 minutes.

Img C036: What does GOES GLM detect, and at what wavelength?
Total lightning (in-cloud and cloud-to-ground) as brief optical flashes at 777.4 nm (an oxygen emission line), day and night, over the Americas and adjacent oceans.

Img C037: Why is lightning watched closely in hurricanes?
Most hurricane lightning is in the outer rainbands. Bursts near the eyewall mark unusually strong convection in the core, and researchers study them as a possible sign of intensity change.

Img C038: In IR imagery of a strong hurricane, why is the eye much warmer than the eyewall?
Air sinks in the eye, so it is mostly clear and the sensor sees down to warm low clouds or the sea surface. The eyewall has the deepest convection and the highest, coldest cloud tops.

Img C039: What are the white dots on this GOES IR image, and which instrument makes them?
Lightning flash locations from the Geostationary Lightning Mapper (GLM) on GOES-19, accumulated over 1 minute.

Img C040: Compare the MODIS and VIIRS true-color images of Hurricane Ian. Why does VIIRS have no black data gap?
VIIRS has a wider swath (about 3,000 km vs MODIS 2,330 km), so adjacent orbits overlap even at low latitudes, giving gap-free daily coverage.

Img C041: How can the VIIRS Day/Night Band be used after a hurricane?
By comparing city lights before and after the storm to map power outages (once clouds clear). Missing lights show where the grid is down.

Img C042: How can a satellite produce a visible-looking picture of a hurricane at night?
The VIIRS Day/Night Band (Suomi NPP, NOAA-20/21) is a very sensitive low-light visible/NIR band (about 0.5-0.9 um). It sees clouds lit by moonlight plus city lights, fires and lightning.

Img C043: What are the bright points of light in this nighttime image, and why are some blurred?
City lights (e.g., Houston at left). Lights under thin cloud are blurred by scattering; under thick cloud they are hidden.

Img C044: On this IR color scale (330 K dark to 170 K white), what does a small, round, much warmer eye inside a very cold ring tell you?
A very intense hurricane: deep eyewall convection (very cold tops) around a clear, sinking eye. A warmer eye and colder ring generally mean a stronger storm (the basis of the Dvorak IR technique).

Img C045: What do the black lens-shaped stripes on this daily global MODIS map represent?
Gaps between adjacent polar-orbit swaths near the equator: places Aqua MODIS did not view that day.

Img C046: This GIBS map shows MODIS cloud fraction. On this color scale, what do red and dark purple mean?
Red = nearly 100% cloud-covered; dark purple = nearly clear (0-5%).

Img C047: On a MODIS cloud-top temperature map, why are tropical thunderstorm clusters the coldest colors?
Deep convection pushes cloud tops up near the tropopause (about 15-17 km in the tropics), where temperatures are about 190-210 K. Colder cloud top = higher cloud top.

Img C048: What physical quantity does this MODIS product show, and from which algorithm/level?
Cloud-top temperature (K) from the MODIS cloud product (MOD06/MYD06, Level 2), derived from thermal IR bands including CO2-slicing for high clouds.

Img C049: What does cloud optical thickness measure, and why can MODIS retrieve it only during the day?
How strongly a cloud attenuates light passing through it (unitless; larger = thicker, darker underneath). It is retrieved from reflected sunlight in visible and shortwave-IR bands, so it needs daylight.

Img C050: On this MODIS cloud-top temperature map, why is the hurricane one solid purple color?
Its cloud tops (anvil cirrus near the tropopause) are colder than about 220 K, the lowest class on the GIBS color scale, so the whole high cloud shield falls in one color.

Img C051: On a monthly MODIS cloud fraction map, why are the Sahara and Arabian Peninsula the clearest places?
They lie under the subtropical high-pressure belt, where sinking air from the Hadley circulation warms and dries, preventing cloud formation.

Img C052: How does a monthly mean cloud fraction map differ from a single day's map?
The monthly mean averages many overpasses, so it fills swath gaps and shows the climatological pattern (ITCZ, storm tracks, subtropical deserts) rather than individual weather systems.

Img C053: IMERG precipitation maps: what time and space resolution do they have, and why are they useful for hurricanes?
Every 30 minutes at 0.1 degree (about 10 km), near-global. They track a storm's rainfall continuously over oceans where there is no ground radar.

Img C054: Compare the GOES Band 13 IR and IMERG images of Isaias at the same time. Which one directly estimates rainfall, and how?
IMERG. It merges passive microwave estimates (which sense rain and ice) from many satellites, calibrated to GPM, filled in with IR. Band 13 only gives cloud-top temperature, which is related to rain but not a direct measure.

Img C055: What product is this, and what does IMERG stand for?
GPM IMERG precipitation rate: Integrated Multi-satellitE Retrievals for GPM. It merges microwave rain estimates from many satellites (calibrated to the GPM Core Observatory) with geostationary IR to make 30-minute, 0.1 degree global maps.

Img C056: What is the narrow band of rain across the tropics just north of the equator?
The Intertropical Convergence Zone (ITCZ), where the trade winds converge and rise.

Img C057: Why are satellite products like GPM IMERG needed for global rainfall maps instead of rain gauges alone?
Gauges and ground radars are sparse or missing over oceans, mountains, polar regions and many developing countries. Satellites give uniform, near-global coverage.

Img C058: What instrument on the GPM Core Observatory makes 3D views of precipitation, and what frequencies does it use?
The Dual-frequency Precipitation Radar (DPR), built by JAXA: Ku band (13.6 GHz) and Ka band (35.5 GHz). Using two frequencies helps estimate drop sizes and separate rain from snow.

Img C059: Which two agencies built the GPM Core Observatory, and when did it launch?
NASA and JAXA (Japan); launched in February 2014. NASA built the spacecraft and the GMI radiometer, and JAXA built the DPR and launched it on an H-IIA rocket.

Img C060: What does a '15 dBZ isosurface' in a GPM DPR 3D image show?
The 3D surface where radar reflectivity equals 15 dBZ (the edge of significant precipitation), colored by height. It shows how tall and where the precipitation towers are, like a CT scan of the storm.

Img C061: GMI vs DPR on the GPM Core Observatory: which is passive and which is active, and what does each give?
GMI = passive microwave radiometer (13 channels, 10-183 GHz), wide swath (about 885 km), surface rain rates. DPR = active radar, narrow swath (about 245 km), 3D vertical structure of precipitation.

Img C062: Why does the 3D radar structure cover only a narrow strip of this hurricane while the flat rain map covers more?
The DPR radar swath is narrow (about 245 km), while the GMI radiometer swath is wide (about 885 km). The 3D structure comes from DPR and the wider flat rain map from GMI.

Img C063: What do two concentric rings of heavy rain around a hurricane's eye indicate?
An eyewall replacement cycle: an outer eyewall forms and contracts while the inner eyewall decays. Intensity usually levels off or drops during the cycle, and the wind field broadens.
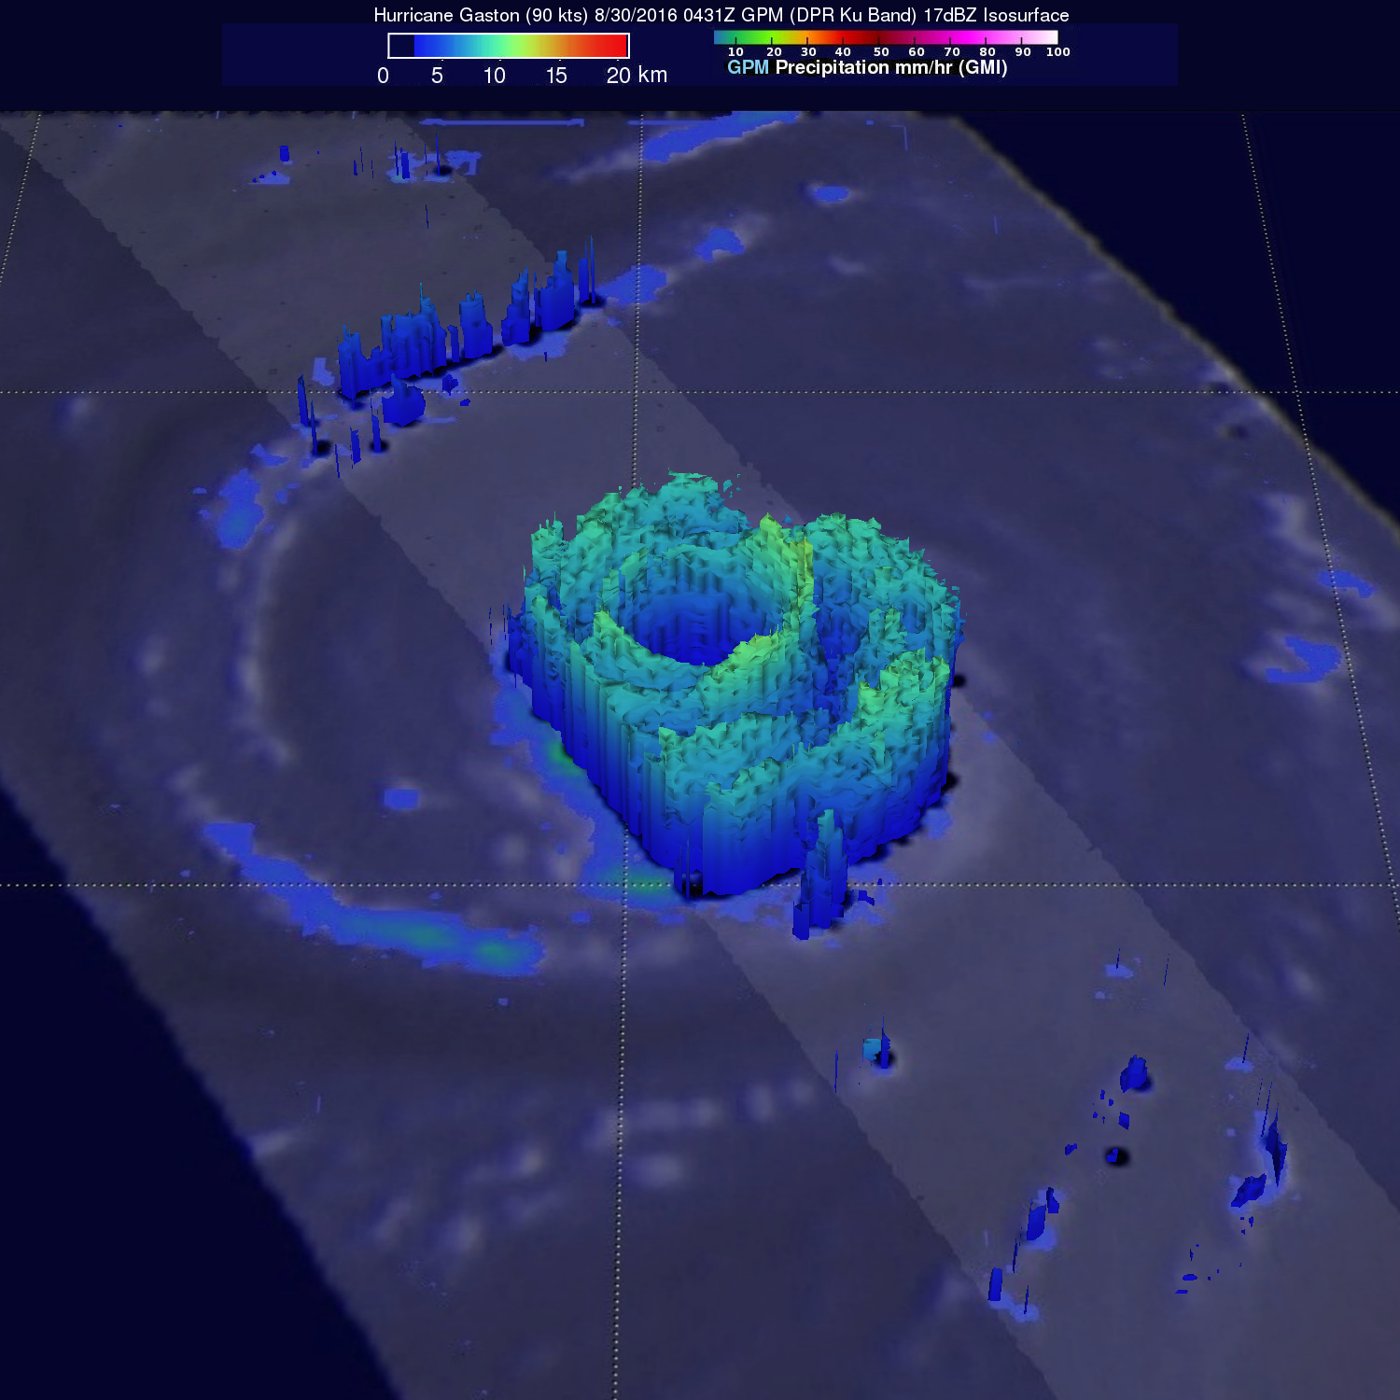
Img C064: A 3D GPM radar image shows two nested rings of precipitation towers around a hurricane's eye. What is happening?
Concentric eyewalls (eyewall replacement cycle): the outer eyewall will contract and replace the inner one.

Img C065: Which radar product is this, and what does it measure?
NEXRAD (WSR-88D) base reflectivity, in dBZ: the strength of the returned pulse, related to the size and number of raindrops/hail. It does not measure wind.

Img C066: Where is the tornado most likely in this reflectivity image, and why?
At the southwest end of the storm, where the hook/appendage holds pink-white (65+ dBZ) returns. In a tornado these can be lofted debris (a debris ball).

Img C067: Reflectivity or velocity? How can you tell, and what do red and green mean here?
Velocity (Doppler radial velocity): red/green rather than a rain-intensity scale. Red = moving away from the radar, green = moving toward the radar.

Img C068: What is a velocity couplet, and why does it matter?
Strong inbound (green) and outbound (red) velocities right next to each other: a rotating column of air. A tight, strong couplet is a tornado vortex signature and triggers tornado warnings.

Img C069: Which physical principle lets a Doppler radar measure wind toward or away from it?
The Doppler effect: the frequency (phase) shift of the returned pulse from moving raindrops gives the radial component of their velocity.
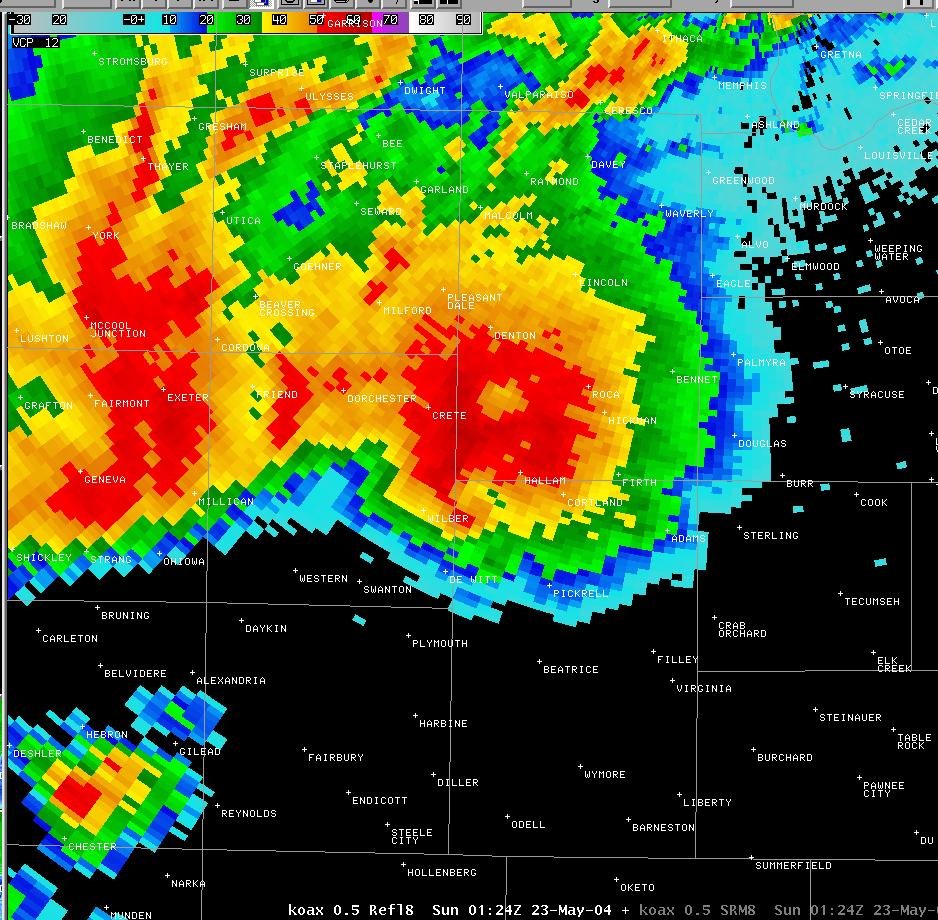
Img C070: Reflectivity or velocity? How can you tell at a glance?
Reflectivity: a single intensity color scale (blue, green, yellow, red, magenta) shaped like rain areas. Velocity images use paired red/green (outbound/inbound) colors on both sides of zero.

Img C071: What is 'storm-relative velocity' (SRM), and why do forecasters use it for tornadoes?
Radial velocity with the storm's own motion subtracted, so the rotation inside the storm stands out instead of being hidden by the storm's overall movement. Tight inbound/outbound couplets mark mesocyclones and tornadoes.

Img C072: A velocity image shows a large area of bright blue right next to bright red/yellow. What does it mean, and which product is it?
A strong rotational (velocity) couplet, the signature of a mesocyclone or tornado, on a Doppler radial or storm-relative velocity product (not reflectivity).

Img C073: In this CALIPSO phase product, why are the 10-15 km clouds ice and the clouds below 3 km liquid water?
Temperature: high clouds are far below 0 C (ice), while low tropical clouds are warm (liquid). CALIOP separates them with depolarization: ice crystals depolarize, droplets do not.
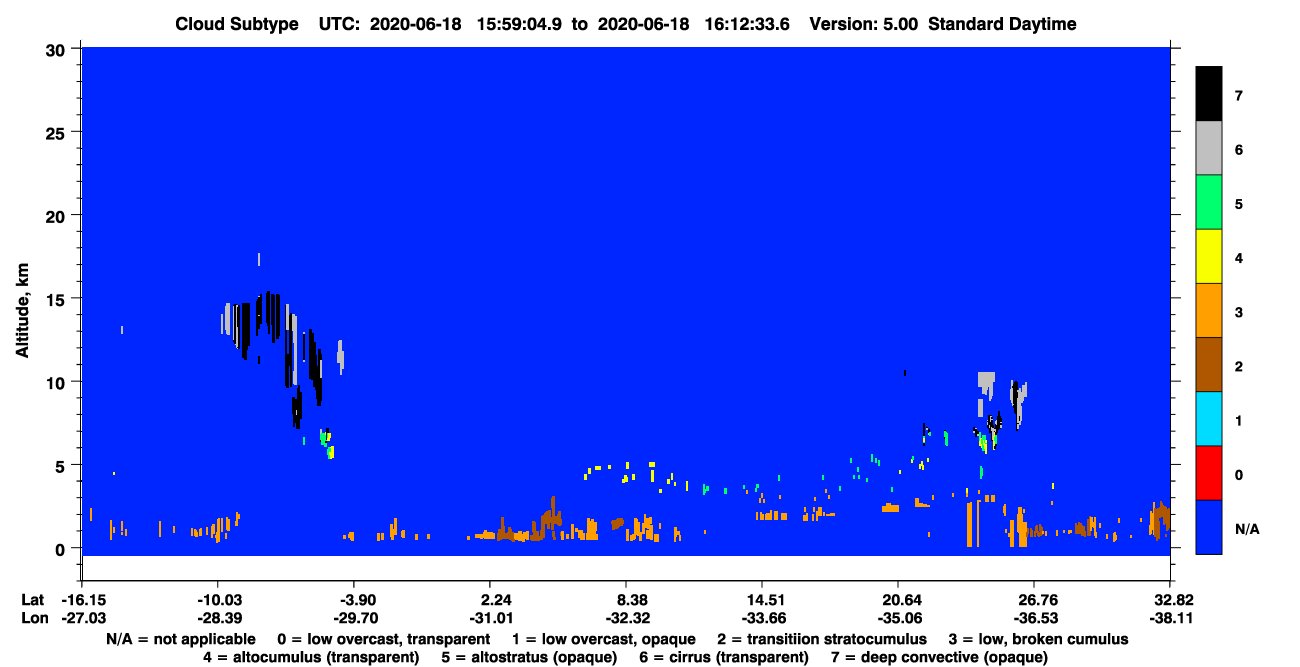
Img C074: How can a lidar classify a cloud as 'deep convective (opaque)' versus 'cirrus (transparent)'?
From the cloud-top height and whether the laser fully attenuates: deep convection is high and opaque (no signal below), while cirrus is high but transmits the beam.

Img C075: Name CALIPSO's three instruments.
CALIOP (two-wavelength polarization lidar, 532 and 1064 nm), IIR (Imaging Infrared Radiometer, 3 channels: 8.65, 10.6, 12.05 um) and WFC (Wide Field Camera, 645 nm visible).

Img C076: Which satellite made the lower 'curtain' image, and what does it measure?
CloudSat's Cloud Profiling Radar (94 GHz, W band, nadir-looking): radar reflectivity (dBZ) vs height along the ground track, showing the vertical structure of clouds and light precipitation.

Img C077: Why does CloudSat use 94 GHz (about 3 mm wavelength) instead of a weather-radar frequency like the NEXRAD S band?
The short wavelength is sensitive to small cloud droplets and ice crystals, so CloudSat can profile clouds, not just rain. The cost is strong attenuation in heavy rain.

Img C078: In a CloudSat curtain, why does the bright surface line sometimes disappear under a storm?
Heavy rain (roughly more than 30 mm/hr) attenuates the 94 GHz signal so strongly that the radar pulse cannot reach the surface and return.

Img C079: What does CloudSat add to a geostationary (GOES) top-down image of a hurricane?
A side view: the vertical structure of clouds and precipitation (heights, ice vs liquid layers, rain intensity) along the ground track, which a top-down imager cannot see.

Img C080: How does a warm front look in a CloudSat curtain compared with a tropical thunderstorm?
A warm front is a wide, sloping, mostly stratiform cloud layer that gradually deepens. Thunderstorms are narrow, tall vertical towers with strong cores and anvils.

Img C081: Same layout as the MODIS AOD map, but different variable. What does this map show and how can you tell?
MODIS (Aqua) cloud fraction. The color bar is 0 to 1 cloud fraction (blue clear to white cloudy), deserts are blue (clear) instead of gray, and the ITCZ and Southern Ocean appear as white bands.

Img C082: Why are the Sahara, Arabia and Australia nearly cloud-free?
They sit under subtropical high-pressure belts (descending branch of the Hadley cell), where sinking air warms and dries.

Img C083: Why does the lidar signal disappear beneath thick clouds in a CALIPSO curtain?
Optically thick clouds fully attenuate the laser beam (cloud optical depth above roughly 3 to 5), so CALIOP sees cloud tops but not what is below. CloudSat's radar penetrates deeper.

Img C084: What ABI band is this and what do the colors show?
Band 13, the clean longwave IR window (10.3 um). Brightness temperature: colored pixels are cold cloud tops, red/dark the coldest and highest.

Img C085: How is GOES ABI SST related to this kind of image?
SST is retrieved from the same infrared window bands (plus others) in cloud-free pixels, many times a day.

Img C086: Which satellite and instrument made this reflectivity curtain, and at what frequency?
CloudSat Cloud Profiling Radar, 94 GHz (W band microwave).

Img C087: In a CloudSat curtain, what do low dBZ values mean, and what direction was the satellite moving here?
Lower backscatter (fewer or smaller cloud particles). Latitude increases along the track, so it moved north.

Img C088: What weather pattern does this CloudSat image show?
A deep convective storm system with cloud tops near 15 km.

Img C089: Identify the severe weather feature shown in this NEXRAD reflectivity image.
A supercell with a hook echo, indicating a rotating mesocyclone and likely tornado.

Img C090: On NEXRAD base reflectivity, what do magenta pixels above about 65 dBZ usually indicate?
Very large or many precipitation particles, usually hail.

Img C091: In this MODIS Terra false-color image of the Great Lakes, what are dark blue, light blue/cyan, and white?
Dark blue = lake ice, light blue/cyan = snow, white = clouds.

Img C092: Why is Lake Erie free of cloud streets while the other Great Lakes have them?
Lake Erie is frozen over, so cold air crossing it picks up little heat and moisture and no lake-effect clouds form.

Img C093: These paired global maps from April 2000 show what, from which instrument?
MODIS vegetation indices: NDVI (top) and EVI (bottom).

Img C094: Why do NDVI and EVI maps differ most over arid and semi-arid regions?
NDVI is more influenced by bare soil (background) reflectance, while EVI includes a soil adjustment term (and also corrects for aerosols and resists saturation).

Img C095: What season does this April image show in each hemisphere, and why is there a green band at the equator?
Spring in the north, autumn in the south. The equatorial band is wet all year because the ITCZ brings rising air and heavy rain.

Img C096: What radar mode is this, and what signature is visible near El Reno?
Base (radial) velocity. A tornado vortex signature: a tight couplet of inbound and outbound winds.

Img C097: On Doppler base velocity, what do green/blue and red mean, and how does a TVS look?
Green/blue = toward the radar, red = away. A TVS is strong opposite velocities right next to each other (tight rotation).

Img C098: How does dual-polarization radar confirm a tornado is on the ground?
Dual-pol sends horizontal and vertical pulses. A low correlation coefficient (debris ball) shows irregular, non-uniform targets, meaning lofted debris.

Img C099: On this elevation map (green low, brown high) east of the Nile, which way does water flow through Soba Valley?
West, downhill toward the River Nile.

Img C100: How do you estimate a stream gradient from a DEM?
Elevation drop divided by channel distance (here about 0.75-0.8 m per km from C' to C).