differentiation vs cost leadership strategy
 Call Kai
 Learn
 Practice Test
 Spaced Repetition
 Match
 Flashcards
 Knowt Play
1/84

There's no tags or description
Looks like no tags are added yet.
85 Terms
Differentiation strategy
Add unique features that will increase the perceived value of goods and services in the minds of consumers so they are willing to pay a higher price.
Value drivers to improve a firm’s strategic position (differentiation):
Product features
Customer Services
Complements
Cost-leadership strategy
Reduce the firm’s cost to manufacture a product or to deliver a service below that of its competitors while offering adequate value/
Cost drivers to improve a firm’s strategic position (cost-leadership):
Cost of input factors (access to lower-cost input factors)
Learning-curve effects - the technology remains constant and cumulative outputs increase
Economies of scale - decrease in cost per unit as output increases
Economise of scope - the technology changes and the cumulative output remains constant
Learning economies
Incremental and predictable decreases in unit costs of output as the cumulative production volume increases
Do learning economies affect all products in the same way?
No, some process and products have greater potential for improvement than others. Usually learning economies can be leveraged most at early stages of the product’s lifecycle.
Why can learning economies be best leveraged at early stages of the product’s lifecycle?
Learning economies are especially valuable early in a product’s life cycle because firms have the most to learn at that stage. Workers are unfamiliar with production, processes are still being refined, and mistakes are more common. As the firm gains experience, it learns how to produce faster, waste fewer materials and make fewer errors, so average costs fall substantially. Later, workers are already experienced and processes are well developed, so additional experience produces smaller cost reductions.
What are the sources for learning economies?
Enhanced human skills
Simplification of product and processes
Better selection of materials
Higher coordination
Higher programmability of activities
How do enhanced human skills contribute to learning economies?
The ability of people to learn to improve their work habits and perform assigned tasks more quickly and better. This applies to all employees and managers, not just those directly involved in production.
How does the simplification or products and processes contribute to learning economies?
When people gain experience regarding a certain product or production process, they can also grasp possible pathways to simplification, leading to greater efficiency at lower costs.
How does a better selection of materials contribute to learning economies?
Understanding which production resources are most appropriate for carrying out a given activity.
How does higher coordination contribute to learning economies?
People must interact and utilise different kinds of plants and equipment as they carry out the activities. With experience, individuals get to know one another and learn to work in teams and coordinate different processes.
How does higher programmability of activities contribute to learning economies?
Events become more predictable and response-time to non-standard circumstances is quicker and more effective. This makes it possible to plan processes more effectively by timing each operation, optimising the mix of different production capacities, coordinating resources, etc.
Economies of scope
Describes the cost-reduction that comes from producing two outputs together, as compared to producing each output individually, while using the same resources and technology.
Drivers of Economies of Scope:
Complementarities in the production and in the distribution of products/services (i.e. shared inputs)
Deployment of unique assets and capabilities across several products (e.g. brand reputation)
Use same advertising campaign for multiple products
Amortising expenses related to generic R&D
Creation of exit barriers and lock-in effects for consumers (e.g. Apple’s product ecosystem)
Benefits v Risks of Threat of Entry - Differentiation
Benefits: protection against entry due to intangible resources such as reputation for innovation, quality, or customer service
Risks: erosion of margins and replacement
Beenfits v Risks of Power of suppliers - Differentiation
Benefits: protection against increase in input prices, which can be passed on to customers
Risks: erosion of margins
Benefits v Risks of Power of buyers - Differentiation
Benefits: protection against decrease in sales prices, because well-differentiated products or services are not perfect imitations
Risks: erosion of margins
Benefits v Risks of Threat of substitutes - Differentiation
Benefits: protection against substitute products due to differential appeal
Risks: replacement, especially when faced with innovation
Benefits v Risks of Threat of entry - Cost leadership
Benefits: protection against entry due to economies of scale
Risks: erosion of margins replacement
Benefits v Risks of Power of suppliers - Cost leadership
Benefits: protection against increase in input prices, which can be absorbed
Risks: erosion of margins
Benefits v Risks of Power of buyers - Cost leadership
Benefits: protection against decrease in sales prices, which can be absorbed
Risks: erosion of margins
Benefits v Risks of Threat of substitutes - Cost leadership
Benefits: protection against substitute products through further lowering of prices
Risks: replacement, especially when faced with innovation
Benefits v risks of rivalry among existing competitors - Differentiation
Benefits: protection against competitors if the product or service has enough differential appeal to command a premium price
Risks: focus of competition shifts to price, increasing differentiation of product features that do not create value but raise costs, increasing differentiation to raise costs above acceptable threshold
Benefits v Risks of rivalry among existing competitors - Cost leadership
Benefits: protection against price wars because lowest-cost firm will win
Risks: focus of competition shifts to non-price attributes, lowering costs to drive value creation below acceptable threshold
Maximum production capacity (MPC)
Maximum units of output that can be produced in a given time interval
Current production capacity (CPC)
Units of output that are actually produced in a given time interval
CPC versus MPC
CPC can be as high as MPC but usually a bit lower as there is some unused capacity. Often CPC<MPC.
Reasons why CPC<MPC
A plant started operations in good times (high demand) or expected a greater demand than its current value
Low prices do not maker it economically efficient to run the plant at full capacity
Technical failures
Degree of utilisation
= CPC / MPC
Average unitary costs (AUC)
= Total production costs / actual quantity produced
Scale economies and AUC
Scale economies have lower average unitary costs, increasing MPC allows for production at a lower cost. Scale economies: lower average costs per unit resulting from increasing maximum production capacity while keeping the degree of utilisation constant. This can happen because fixed costs are spread over more units and larger operations allow greater specialisation. Because a larger production scale can use more efficient machinery and greater specialisation, reducing the cost per unit.
How does degree of utilisation relate to scale economies?
Higher utilisation: producing more using the same capacity. Average costs can fall because fixed costs are spread over more units
Do production costs and production capacity increase proportionally?
No, production costs increase but less than proportionally as production capacity increases. This is why increasing MPC decreases AUC as Q increases more than TC increase and AUC = TC/Q.
Sources of scale economies
Indivisibility of certain inputs - Often inputs cannot be bought in subunits. Related costs do not increase when production capacity increases.
Specialisation - Larger size means that resources can be employed more efficiently.
Bargaining power - Size improves the ability to influence customer/supplier prices.
Learning advantages - Larger organisations are better at solving problems due to broader and more diversified knowledge sources.
Greater technological efficiency - fuel consumption increases less than proportionally to ending power
Geometric properties of containers, as capacity growth by 3rd power, costs are often expressed in terms by surface and grows by 2nd power. Important in logistics, transportation, storage, etc.
Step wise increase in costs
Sometimes for a certain quantity costs suddenly increase a lot, but after that a linear increase does not really increase FC, while Q increases.
Scale vs Learning economies
Scale economies refer to production capacity while learning economies refer to cumulated production over time. Learning economies can be independent of the scale of operations (e.g. often are very small in small or labour-intensive firms). Scale economies could be strong even when the learning curve is flat (i.e. established manufacturing firms).
Limits to scale economies:
Limited market
Cost changes outside certain ranges of variation
How does a limited market limit scale economies?
Insufficient demand: size advantages arise at a scale that is too large for a given company. The firm cannot sell enough to justify operating at the most efficient scale as expanding would leave much of its capacity unused.
Niche markets: suppliers may profitably produce by staying small because the product type makes consumers willing to pay high prices
Declining trends: firms may experience declining demand trends (due e.g. to technological changes, recessions, etc.) which forces them to reduce utilisation rate creating excess capacity. The firm already has large production capacity, but sales fall. It reduces output, so utilisation falls and excess capacity rises. Fixed costs are then spread over fewer units, increasing average costs.
Limits to economies of scale - cost changes outside certain ranges of variation
The assumption may be that total fixed costs remain unchanged as output rises, however, often in reality, fixed costs rise in steps when output requires extra capacity. This is a limitation of economies of scale because you cannot keep spreading the same fixed cost over more units forever: eventually, you reach capacity and must pay for additional resources.
What are diseconomies of scale?
Diseconomies of scale occur when a business or organization grows so large that its long-run average cost per unit starts to increase as production volume expands.
What are sources of diseconomies of scale?
Coordination and administration costs
Excessive bureaucratic organisation
Lack of incentives
Misallocation of resources within the company
All four mean that resources grow faster than useful output, raising average costs.
How do coordination and administration costs contribute to diseconomies of scale?
As a firm grows, it requires more employees, departments and locations require more managers, meetings and communication. Keeping everyone working together becomes more expensive.
How does excessive bureaucratic organisation contribute to diseconomies of scale?
More layers of management and approval procedures slow decisions and create extra paperwork. For example, a simple purchase may need approval from several managers.
How does a lack of incentives contribute to diseconomies of scale?
Employees may feel their individual contribution goes unnoticed and that working harder will not affect their reward (weakened link between effort and reward). Lower motivation and accountability can reduce productivity, increasing cost per unit.
How does a misallocation of resources within a company contribute to diseconomies of scale?
Managers may find it harder to identify where money, staff, and equipment are most needed. Some departments receive more than they need while others face shortages, creating waste and bottlenecks.
What does fixed-cost absorption mean?
It means reducing average unit cost (AUC) by spreading the same total fixed costs over more units of output.
How does fixed-cost absorption work?
Capacity stays the same, but actual production output increases, so utilisation rises. Assuming variable cost per unit stays constant, AUC falls.
How does fixed-cost absorption differ from economies of scale?
Fixed-cost absorption increase production output while keeping capacity the same, increasing utilisation. This differs from economies of scale, where maximum capacity increases while utilisation stays constant.
In what industries does fixed-cost absorption provide greater benefits?
The benefit is greater when fixed costs account for a large share of total costs. For example, a university can spread the cost of its buildings over more students, provided it has spare capacity. However, this depends on the particular business—manufacturing can also have very high fixed costs.
Economies of scale vs Fixed-cost absorption
ES: AUC decreases, production capacity increases, degree of utilisation is constant
FCA: AUC decreases, production capacity is constant, degree of utilisation increases
Why are resources important
Internal resources are key to achieve and sustain competitive advantage.
What is resource heterogeneity?
Resource heterogeneity means that firms possess different combinations of resources, capabilities and competencies, even within the same industry. For example, two brand may differ in:
Resources: money, machinery, patents or brand reputation.
Capabilities: ability to design products or manage supply chains.
Competencies: activities they perform particularly well, such as creating innovative designs.
What is resource immobility?
Resource immobility means that resources are difficult to transfer from one firm to another, so they are described as “sticky” - they tend to stay with the firm.
What are the two types of resources?
Tangible - visible, physical attributes: labour, capital, land, buildings, plants, equipment, supplies
Intangible - invisible, no physical attributes: culture, knowledge, brand equity, reputation, intellectual property (patents, designs, copyrights, trademarks, trade secrets)
3 types of resources
Physical, human, and organisational/intangible
Physical resources
Tangible assets a firm uses, such as land, buildings, factories and machinery:
Acquired at market prices - e.g. property, plants, and equipment, if competitors can buy the same equipment, owning it alone is unlikely to provide a lasting competitive advantage
Heterogeneously distributed - firms still differ in the physical resources they own or can access due to firm location, geographic access to key inputs (lower/higher transport costs)
So, similar machinery may be widely available, while an advantageous location can be scarce and difficult to replicate.
Human resources
Human resources concern the people in a firm and its ability to attract talent:
Recruiting skills: the firm’s ability to identify, attract and select suitable employees.
Employees’ knowledge, skills and experience: what employees know and can do. Knowledge developed within the firm can be especially difficult for rivals to replicate.
These resources can support competitive advantage because competitors cannot simply buy or copy them immediately.
Organisational/intangible resources
Nonphysical assets associated with the organisation:
Corporate culture: shared values, habits, and ways of working that are idiosyncratic to the firm (distinctive to the firm). Culture is hard to imitate because it develops over time through people’s interactions.
Brand loyalty: customers’ attachment to a brand, making them more likely to keep buying it
Reputation: how customers and other stakeholders perceive the firm (e.g. reliable, innovative or high quality).
These resources can support competitive advantage because competitors cannot simply buy or copy them immediately.
Competencies vs Resources
Competencies come from learning/know-how and resides in people more than in physical lasts, while resources are things that you own/things that were assigned to you. The distinction is what a firm has versus what it knows how to do well.
What does the VRIO framework do?
The VRIO framework assesses whether a resource can give a firm a sustained competitive advantage:
What dose VRIO stand for?
Valuable - does the resource increase the economic value created by the firm, V - C (where V is customer’s willingness to pay and C is cost of production). A resource is valuable if it increases willingness to pay, lowers costs, or both.
Rare - do only one or a few competing firms possess this resource? If everyone has it, it may be necessary to compete but provides no advantage over rivals.
Imitation (Costly to imitate) - would competitors find it expensive or difficult to copy the resource directly or find a substitute that delivers the same benefits? If competitor firms do not possess the resource and are unable to develop or buy the resource at a reasonable price, this helps prevent competitors from catching up.
Organised to capture value - does the firm have the organisational structure, coordinating systems, and incentives needed to exploit the resource? For example, talented researchers create little benefit if the firm cannot turn their discoveries into products.
Competitive outcome of a firm that has a resource that is is not valuable
Competitive disadvantage
Competitive outcome of a firm that has a resource that is only valuable
Competitive parity (it is not rare, nor costly to imitate)
Competitive outcome of a firm that has a resource that is valuable and rare
Temporary competitive advantage
Competitive outcome of a firm that has a resource that is valuable, rare, and costly to imitate, but the firm is not organised
Unexploited competitive advantage
Competitive outcome of a firm that has resources that meet all four VRIO criteria (valuable, rare, costly to imitate, and the firm is well-organised)
Sustained competitive advantage
Core competencies
Allow a firm to gain and sustain competitive advantage by differentiating its products and services from rivals, creating higher value for the customer, and offering products at lower costs, and offering products at lower costs. Core competencies are unique strengths, embedded deep within the firm. They must be constantly nourished and may be invisible (intangible).
Resources
Any assets that a firm can draw on when formulating or implementing a strategy (tangible or intangible).
Capabilities
Organisational and managerial skills necessary to deploy a diverse set of resources (intangible).
Activities
Distinct and fine-grained business processes that enable firms to add incremental value by transforming inputs into goods and services.
Difference between resources, capabilities, activities, and competencies
Resources: Assets the firm can draw on
Capabilities: Ability to organise and deploy resources effectively
Activities: Specific tasks or processes the firm performs
Competencies: Expertise developed through learning that enables the firm to perform activities well
Activities are the tasks; competencies are the know-how that makes the firm good at those tasks. Capabilities concern putting resources and skills to work effectively.
Economies of scale - Core focus, primary driver, output type, cost metric
Core focus: increasing the volume of a single product
Primary driver: spreading fixed costs over more units of the same item (bulk production, specialisation)
Output type: high quantity of a standardised identical good
Cost Metric: Lowers the average cost per unit as output scale goes up
Economies of scope - Core focus, primary driver, output type, cost metric
Core focus: increasing the variety of different products
Primary driver: sharing resources, infrastructure, technology, or brand equity across multiple product lines
Output type: multiple complementary or distinct goods using shared facilities
Cost Metric: Lowers total production cost when making joint products together rather than separately
What is the break even point?
Where total revenue equals total cost, profit is zero. This is the break-even point, at output Q. Profit = total revenue - total cost. Below Q, costs > revenue => a loss. At Q, costs = revenue, profit = 0, break even point. After Q, profit is positive as costs < revenue. The vertical gap between the two lines measures the profit or loss at any given output.

What is operating profit?
Operating profit = sales revenue - operating costs
What affects operating profit?
Purchasing and selling prices: higher selling prices increase revenue per unit; lower input prices reduce costs.
Structural determinants: choices such as factory size, automation and production technology determine capacity and the balance between fixed and variable costs.
Volumes: selling more units increases revenue, but also increases variable costs. Each extra unit contributes to covering fixed costs and then profit, provided its price exceeds its variable costs
Operative Break-even Point
Amount of sales that allows the firm to cover its operating costs.
Operative Break-even in Quantity
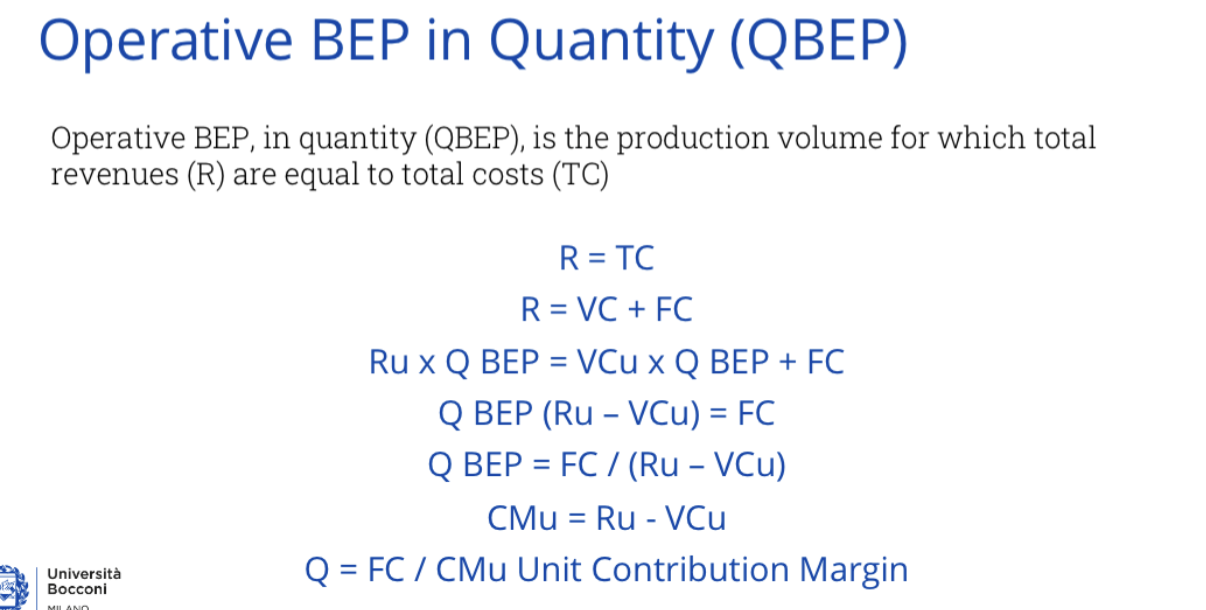
Operative BEP in quantity (QBEP) is the production volume for which total revenues (R) are equal to total costs (TC).
Revenue = Total costs
Revenue = Revenue per unit x quantity
QBEP = FC / (revenue per unit - variable cost per unit)
QBEP = FC / CMu
What is the unit contribution margin?
How much each unit contributes to profit
CMu = Price (revenue per unit) - VC per unit
Contribution margin
Contribution margin is revenue left after paying variable costs. It covers fixed costs and then profit. CMu = Revenue - VC
Contribution margin ratio
CM ratio = CMu/Ru = (revenue - VC)/revenue or = (price - variable cost per unit) / price
basically how much is left as actual revenue (contribution margin) compared to immediate revenue
Calculating break even point in revenues
Break-even revenue is the amount of sales money needed to cover all your costs. Contribution ratio tells you what percentage of revenue contributes towards fixed costs and then profit. By dividing fixed costs by the percent of revenue contributing to fixed costs you get break even revenue. Because the contribution margin tells you how much you keep after paying variable costs. You need to divide FC by this percentage to work out the full 100% of revenue you need to pay everything.
RBEP = FC / CM%
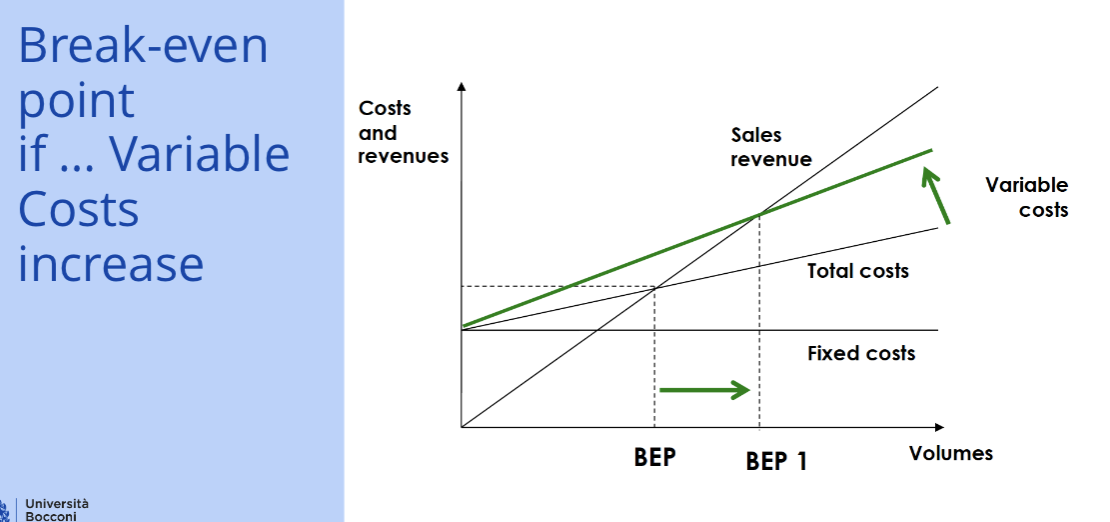
increasing variable costs - break even point
increases slope of total costs (and variable costs), so, break even point is at a higher revenue and quantity
break-even point if fixed costs decrease
shifts fixed costs down and total costs down by y-intercept, break even point is at a lower quantity and revenue
