ECON 1110 - Macroeconomics Exam 1
 Call Kai
 Learn
 Practice Test
 Spaced Repetition
 Match
 Flashcards
 Knowt Play
1/88

Earn XP
Description and Tags
Includes chapters 1-6. Economic Methods and Models, Addressing Scarcity, The Demand and Supply Model, Unemployment and Inflation, and Output and Income.
89 Terms
Economy
All of the decisions, or choices, made by economic agents within a given geographic area that involve the use of scarce resources.
Microeconomics
Studies the individual part of the economy: the households, firms, markets, and the various organizations that exist within the economy.
Macroeconomics
Uses measures of total economic activity, or economic aggregates, such as gross domestic product, inflation, and the national rate to gauge the performance of the overall economy.
Positive economics
Uses factual information and economic analysis to identify what is without making a value judgement.
Normative economics
Evaluates a situation with respect to what should be which requires a value judgement.
Scarcity
The basic economic problem that societies have to decide: What outputs to produce, How to produce the outputs, and who ultimately gets to consume the outputs.
Scarce Resources
Land
Labor
Capital
Entrepreneurship
Land
Natural resources (timber, water, minerals, climate).
Labor
Human effort applied to the production process.
Capital
Equipment and buildings used in production (factories, machines, computers, delivery trucks).
Entreprenuership
Ability to combine inputs and to produce an output, which requires innovating and risk-taking.
Opportunity Cost
The value of the best alternative foregone when a choice is made.
ceteris paribus assumption
When studying the relationship between two variables, the Ceteris Paribus Assumption is keeping all other variables constant to isolate the two in question. (Literally: “other things being equal/constant”)
Ceteris paribus
Latin phrase that translates as "“with other conditions remaining the same” or “all other things remain constant”.
Laissez-faire
“to let do, let pass”, let things work on their own.
Gov takes a hands off approach.
Fallacy of false cause (post hoc fallacy)
“After this therefore because of this”. Association (or correlation) does not implement causation.
The fallacy of composition
Assumed if something is true for a part, it must also be true for the whole.
The fallacy of division
Assumed if something is true for a whole, it must also be true for the part.
The sunk cost fallacy
A belief that what has already disappeared can somehow be regained through further investment of money, time, or effort.
Circular Flow Model

Production Possibilities Model (PPM)
Simple model illustrating the output choices available to society. (Usually presented as a PPF graph)
Production Possibilities Frontier (PPF)
Shows maximum output combinations of two different goods an economy can produce with available resources and technology.
Straight Line PPF
When resources has constant opportunity cost because its resources are perfectly adaptable and equally efficient at producing either good.

Bowed-Out PPF
When resources cannot produce all outputs with equal ease, increasing the opportunity cost production of one output by equal increments require giving up increasing amounts of the other output.
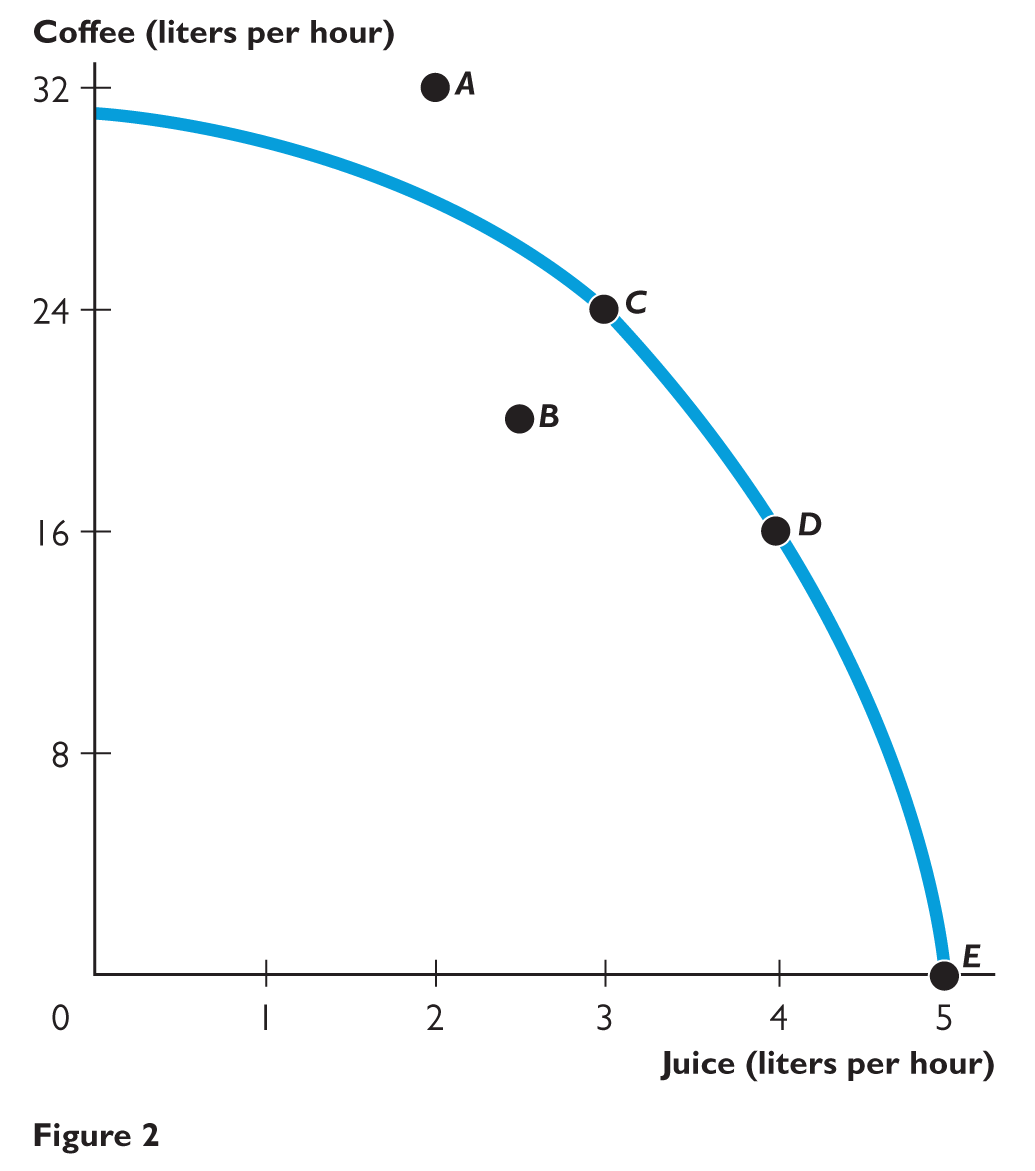
Graphing a PPF assumes:
The amount of resources available for production is fixed
The technology used in production is constant
Available resources are fully employed
Production is efficient
Points on PPF
Combinations on the PPF line are achievable and efficient
Combinations inside the PPF are achievable and inefficient
Combinations outside the PPF are unachievable.
Economic Growth on PPF
A right shift on a PPF represents an increase in an economy’s ability to produce output.

Economic Growth on PPF of one Industry
Growth can also occur within a specific industry; not all resources and technology are used to produce all types of outputs.

Invisible hand
The pursuit of self-interest guides resources to their highest-valued use which is more likely to increase the wealth of a nation.
Capitalism
Private ownership of the factors of production.
Characteristics of capitalism
incentives
profit-motive
private property
own satisfaction
Socialism and communism
Government control of resources and government direction of production and consumption
Mixed economy
Elements of both a market economy and a planned economy.
We have businesses and firms that rise up and operate on their own, but also have government intervention in certain areas of the economy.
Role of government in businesses
Fiscal policy, monetary policy, and involvement in market failures.
Fiscal Policy
The use of the federal government’s budget for the purpose of altering economic outcomes.
Federal government giving money (subsidies or checks) or decreasing taxes.
Monetary Policy
Federal Reserve uses monetary policy to influence the money supply and credit conditions to help achieve the economy of macroeconomic goals.
It’s how the Federal Reserve (the central bank of the US) controls inflation, using interest rates.
Demand
The willingness and ability of consumers to make a purchase.
Law of Demand
Decrease in price causes increase in quantity demanded, and an
increase in price causes decrease in quantity demanded.
Demand curve
The downward facing slope.

Demand Schedule
Price and quantity demanded are inversely (negatively) related.
Inverted slope.
How much consumers are willing to pay at different price points. Demand decreases as prices increase.

Supply
Total amount of a specific good or service that producers are willing and able to offer to buyers at a set price.
Law of Supply
Increase in price causes increase in quantity supplied, and a
Decrease in price causes a decrease in quantity supplied.
Supply Curve
Upward facing slope.
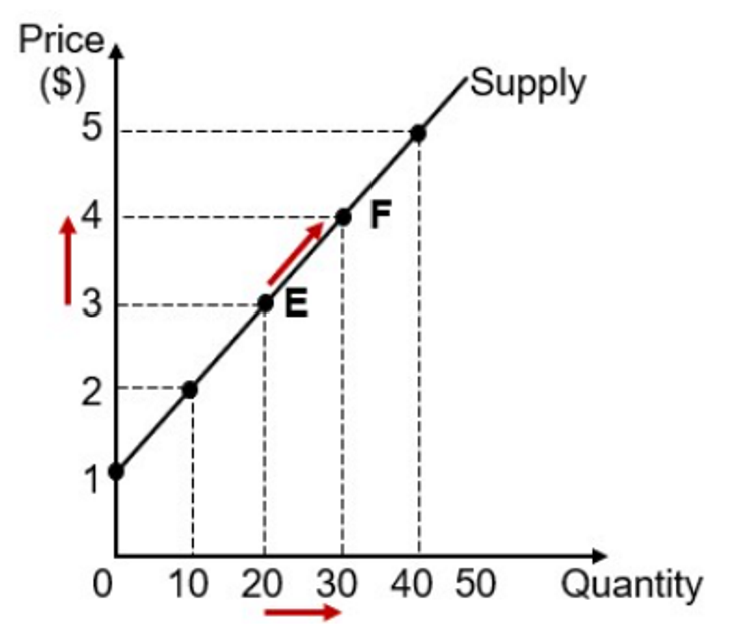
Supply Schedule
Price and quantity are directly (positively) related.
Market Equilibrium
Quantity demanded is equal to quantity supplied

Market Surplus
Quantity supplied exceeds quantity demanded (When the price in a market is above the equilibrium price).
Market Shortage
Quantity demanded exceeds quantity supplied (When the price in a market is below the equilibrium price).
Price ceiling
When policymakers set a maximum legal price, to protect buyers/consumers from prices considered to be unfairly high (established below the equilibrium price).
Policy makers do this to protect consumers (=average people) from corporate price gouging.
Price floor
When policymakers set a minimum legal price, to protect sellers in the particular market. (established above the equilibrium price).
Changes in Demand and Supply
A change in price leads to a change in quantity and a movement along a given demand or supply curve.
If a non-price factor that influences demand or supply changes, the curve shifts to the right or left.
Demand Shifts Factors
A change in tastes and preferences
A change in income (direction depends on if product is normal or inferior)
A change in the price of a related good or service (direction depends if product is a substitute or complement)
A change in the number of buyers in the market
A change in the expectation of buyers
Normal goods
increases in income lead to increases in demand, and vice versa. (direct; positive)
Inferior goods
demand decreases when income increases, and vice versa. (inverse; negative)
Complements
demand decreases following an increase in the price of a complementary product, and vice versa. (inverse; negative)
Substitutes
demand increases following an increase in the price of a substitute product, and vice versa. (direct; positive)
Labor Force
Includes people over the age of 16 who are working or actively seeking employment and excludes military members and those who have been institutionalized.
People employed + unemployed (people seeking work) - military
Employed classifications
A respondent must meet only ONE of the four:
Worked for pay for at least 1 hour
Worked at least 1 hour as self-employed in their own business, profession, trade or farm
Were absent temporarily from their job, business, or farm, whether or not for paid time off, OR
Worked without pay for at least 15 hours in a business or farm owned by a family member
Unemployed classifications
A respondent must meet ALL of the three:
Currently unemployed
available to work, AND
actively looking for a job in the last 4 weeks
Discouraged workers
People who are marginally attached to the labor force; they are willing and able to work but have not actively searched for work in the past 4 weeks.
Unemployment rate
(Unemployed/Labor Force) * 100
Cyclical unemployment
When there is a downturn in overall economic activity that such the number of job seekers exceeds the number of jobs available.
Frictional unemployment (short term)
When people with skills demanded in the labor market leave one job search to another.
Structural unemployment (long term)
When there is a mismatch between skills or location of job seekers.
When people are unemployed because there’s no longer a need for their skillset.
Seasonal unemployment
When people are out of work because the demand for labor drops during specific times of the year.
(Example: retail needs less workers in spring than late fall and winter)
Full employment
The unemployment rate is equal to the noncyclical rate, or natural rate, of unemployment.
[U = UN and UC = 0]
Natural rate of unemployment (UN)
When the economy is operating at it’s potential, the unemployment rate is equal to the noncyclical, or natural rate, of unemployment.
UN = [Frictional Unemployment + Structural Unemployment]
Inflation
Increase in the general price level over time, or the average of all prices.
Purchasing Power
The amount of goods and services that a specific amount of money can buy.
CPI
Consumer Price Index: how economists measure the purchasing power of consumers (aka “the price that consumers pay on a selection of goods, like gas, housing, groceries, etc.”). It’s generally seen as a good indication of inflation.
Real Income Formula
Real Incomet = (Nominal Incomet / CPIt) * 100
Annual Inflation Rate Formula
Annual Inflation Rate = (CPIt - CPIt-1 / CPIt-1) 100
(current - earlier/earlier) * 100
GDP (Gross Domestic Product)
GDP is the total market value of all final goods and services produced in a country in a year.
Measuring GDP
The four components of GDP are: Personal consumption expenditures (C), gross private domestic investment (I), government consumption expenditures and gross investment (G), and the net exports of goods and services (NX).
GDP = C + I + G + NX
Personal consumption expenditures (C)
(PCE or C) By far, is the largest component of GDP.
Gross private domestic investment (I)
(GDPI = I) Includes business spending on new structures, equipment, and intellectual property products.
Government consumption spending and gross investment (G)
(G) Includes spending by all government entities. Does NOT include outlays for transfers such as social security or stimulus checks.
Net exports (NX)
Net exports is the difference between exports (EX) and imports (IM).
[NX = EX = IM]
Exports (EX)
Exports are outputs produced in the US and purchased by foreigners. (Exports are made in the US, but EXIT the country)
Imports (IM)
Imports are outputs produced in other countries and purchased in the U.S
Trade Surplus
When exports exceeds imports; net exports will be positive (exports > imports).
Trade Deficit
When imports exceeds exports; net exports will be negative.
Double Counting
GDP adds only the prices of final goods and services to avoid the problem of double counting.
Spending Not included in GDP
Sales of previously sold final goods and purely financial transactions.
Deprecation
When an asset declines in economic value over time (“consumption of a fixed capital“)
Net domestic product (NDP)
NDP = GDP - Depreciation
Net Investment (Net private domestic investment)
Net private domestic investment = Gross private domestic Investment (I) - Depreciation
Disposable (Personal) Income (DI)
The income available to households for spending or saving.
The amount money people have left over to save or spend after paying to live (paying bills, paying gas to get to work, paying for groceries to eat).
Calculating Economic Growth Rate
%Change in Real GDP = (Current GDP - Earlier GDP / Earlier GDP) * 100