EBP Ch 6 pt 2
 Call Kai
 Learn
 Practice Test
 Spaced Repetition
 Match
 Flashcards
 Knowt Play
1/28

There's no tags or description
Looks like no tags are added yet.
29 Terms
define raw data
raw data is the info we collect before organizing it in a meaningful way
ex: writing down the ages of 100 ppl
define frequency distribution
frequency distribution is a table which indicates how many ppl in a sample fall into each category
what type of distribution involves categorical/nominal variables
frequency distribution
what type of distribution use bar charts to represent their data
frequency distribution

define grouped frequency distributions
grouped frequency distributions puts # into ranges instead of listing out every possibility
what type of distributions involves continuous data
grouped frequency distribution

what distribution uses histograms to represent their data
grouped frequency distribution
define a frequency curve
a frequency curve is basically a grouped frequency distribution but instead of bars, they use lines
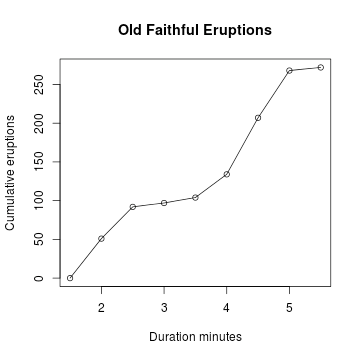
what distribution is most useful at representing trends in data
frequency curve
define descriptive statistics
these are numbers we use to summarize and describe our data
what are the measures of central tendency
mean, median mode
define dispersion/spread
dispersion/spread tells us how spread out the data is
define the mean
-the average
-there is only 1 in a data set
-it is affected by outliers
define the median
-the middle #
-there is only 1 in a data set
-used in skewed distributions
define the mode
-the most frequent #
-there can be multiple in a data set
-it is NOT affected by outliers
define distribution
-the overall pattern of scores
-normal distributions are symmetrical and bell-shaped
-in normal, the measures of central tendency will all fall at the top point of the curve
what measure of central tendency is affected by outliers
mean
what measures of central tendency is not affected by outliers
mode
define outliers
outliers are extreme scores in a distribution which can make the pattern look uneven or skewed
describe skewed distributions
-skewed distributions can be positively skewed (exam scores) or negatively skewed (ages at death)
-the measures of central tendency will fall at diff points
how will skewed distributions look
the median will always be bt the mean and mode. the mean will be closer to the tail
describe the dispersion/spread
dispersion/spread says that a curve that is tall/skinny means that the data is close to the measures of central tendency, while a curve that is short/wide means the # are more spread out w variability
define the range
-most simple measure of dispersion and least useful
-(highest # - lowest # = range)
define variance/s²
-another type of dispersion
-uses all the scores in a data set to calculate the amount of variation from the mean (in squared units)
-used to find the standard deviation (s)
define standard deviation/s
-most common way to measure dispersion
-like variance, it tells us how far scores are from the mean in simple terms
-square root of s² = s
what does a small/big standard deviation tell us
small s: scores are close to the mean
big s: scores are more spread
define the empirical rule
the empirical rule tells us approximately how much data falls within 1, 2, or 3 standard deviations of the mean in a normal distributions
68% scores fall within ( ) s of the mean
95% scores fall within ( ) s of the mean
99% scores fall within ( ) s of the mean
68% = ±1
95% = ±2
99% = ±3
what is the purpose of margin of error and how do we minimize it
when we collect data from a sample, the results may not perfectly match up w the whole population.
we use margin of error it to see how far our sample results could be from the actual population results. we do this by INCREASING THE SAMPLE SIZE