Images: Gases & Aerosols
 Call Kai
 Learn
 Practice Test
 Spaced Repetition
 Match
 Flashcards
 Knowt Play
1/162

There's no tags or description
Looks like no tags are added yet.
163 Terms
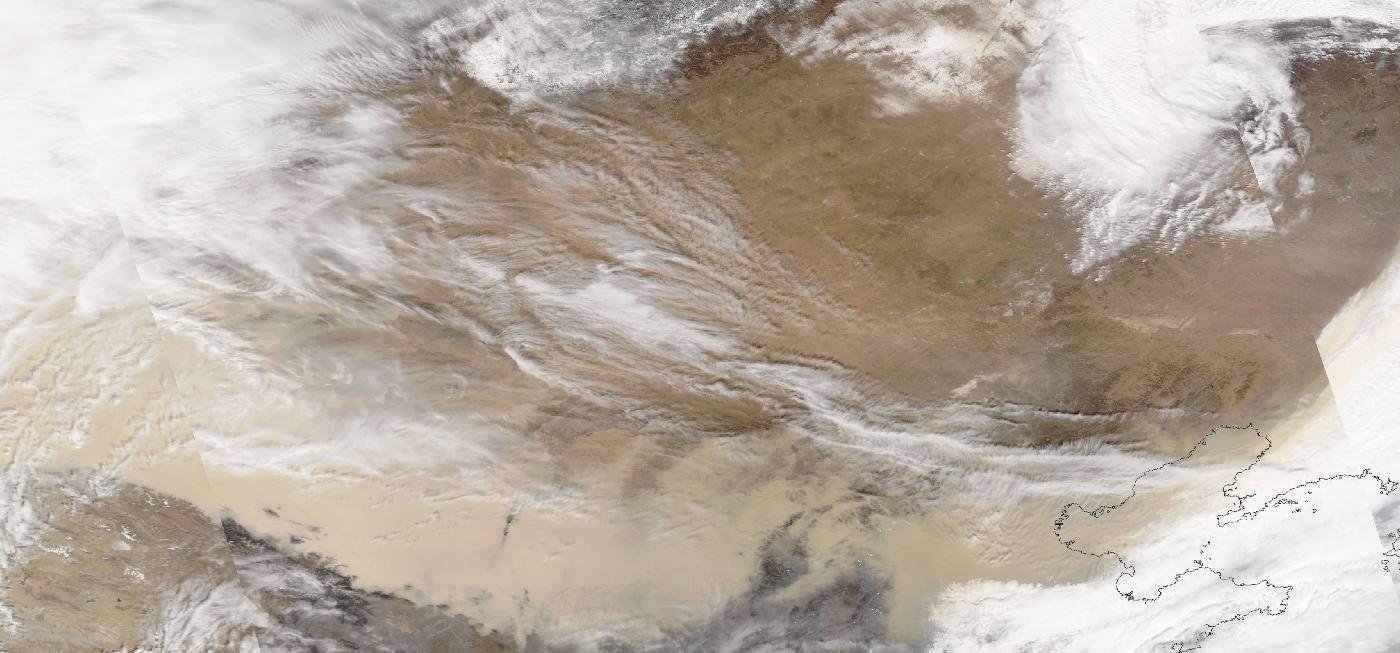
Img G001: In a MODIS true-color image, how do you tell a dust storm from smoke and from cloud?
Dust is tan/beige-brown and comes from deserts; smoke is gray-white to bluish with fire sources and plumes; clouds are bright white with sharper texture.

Img G002: Where and when is this dust event, and what season are East Asian dust storms most common?
Gobi/Inner Mongolia and northern China, March 2021. Asian dust storms peak in spring (March to May) with strong cold-front winds over dry, bare soil.

Img G003: Where does the tan haze over the tropical Atlantic come from, and what season is it most common?
Saharan dust carried west by the trade winds in the Saharan Air Layer. It peaks in late spring and summer (June to August).

Img G004: Name two effects of Saharan dust on Atlantic hurricanes or climate.
The dry, dusty Saharan Air Layer can suppress hurricane formation (dry air, stable layer, wind shear). Dust also scatters sunlight (cooling the surface below) and fertilizes the ocean and Amazon with iron and phosphorus.

Img G005: How do you recognize wildfire smoke in a MODIS true-color image?
Gray to brownish, smooth, semi-transparent haze that starts as narrow plumes at fire locations and spreads downwind; it lacks the bright, lumpy texture of clouds.

Img G006: What is the gray-tan haze spreading over the Pacific in this MODIS true-color image, and how can you tell?
Wildfire smoke from the September 2020 Oregon/California fires. It is smooth and gray-brown, starts as plumes at fire locations, and is semi-transparent, unlike bright, textured clouds.

Img G007: What RGB product is this, and what do red/orange, green and white mean?
GOES ABI Air Mass RGB. Red/orange = dry, ozone-rich upper air (stratospheric intrusion, jet); green = warm, moist tropical air; blue/purple = cold polar air; white = thick, cold high cloud.

Img G008: Which ABI bands go into the Air Mass RGB?
Red: 6.2 minus 7.3 um (water vapor difference); Green: 9.6 minus 10.3 um (ozone band minus IR window); Blue: 6.2 um water vapor (inverted).

Img G009: Why do CALIPSO products come with an orbit-track map instead of a wide image?
CALIOP is a nadir-pointing lidar: it profiles a single narrow line (about 70-100 m footprint) under the satellite, giving a vertical curtain along the ground track, not a wide swath.

Img G010: Which instrument made this curtain, and what quantity is plotted?
CALIOP lidar on CALIPSO: 532 nm total attenuated backscatter coefficient (km^-1 sr^-1) vs altitude along the ground track.

Img G011: What is the yellow-orange layer at about 2-6 km stretching from about the equator to 28 N over the Atlantic in June?
The Saharan Air Layer: an elevated layer of desert dust blown west from Africa over the Atlantic.

Img G012: Why is the top of this CALIPSO daytime image much noisier than a nighttime one?
Sunlight adds background photons at 532 nm, lowering the signal-to-noise ratio of the lidar during the day.

Img G013: In the standard CALIPSO 532 nm backscatter color scale, what do blue, yellow-red and gray-white usually mean?
Blue = clear air (weak molecular scattering); yellow, orange and red = aerosols and thin cloud; gray to white = strong scattering from clouds.

Img G014: What does the thick dark line at about 16 km in this CALIPSO overplot mark?
The tropopause height (from the GEOS model meteorology), the boundary between troposphere and stratosphere.

Img G015: Why do dust and ice clouds stand out in CALIOP's perpendicular (depolarization) channel?
Irregular, non-spherical particles (ice crystals, mineral dust) change the polarization of the returned laser light; spherical droplets mostly do not. That is how CALIPSO separates dust from smoke and ice from water.

Img G016: What CALIPSO product is this, and what does it show?
The CALIOP Level 2 Vertical Feature Mask: each altitude bin classified as clear air, cloud, tropospheric aerosol, stratospheric aerosol, surface, subsurface or totally attenuated.

Img G017: What does 'totally attenuated' (black) mean in a CALIPSO VFM, and why does it happen?
The laser was fully absorbed/scattered by an opaque layer above (thick cloud or dense aerosol), so nothing below can be classified. Lidar cannot see through thick clouds.

Img G018: Which CALIPSO product classifies aerosol layers as dust, smoke, marine, etc., and what is this layer?
The CALIOP Level 2 aerosol subtype (part of the Vertical Feature Mask). The yellow layer at 2-6 km is classified as desert dust (Saharan dust over the Atlantic).

Img G019: Name four CALIPSO aerosol subtypes shown in its legend.
Any four of: marine, desert dust, polluted continental/smoke, clean continental, polluted dust, elevated smoke, dusty marine, polar stratospheric aerosol, volcanic ash, sulfate.

Img G020: Which satellite made this map and what quantity is shown (units)?
OCO-2 (Orbiting Carbon Observatory-2). XCO2, the column-averaged dry-air mole fraction of CO2, in ppm.

Img G021: OCO-2 retrieves CO2 from which spectral bands?
Reflected sunlight in three near-IR bands: the O2 A-band near 0.765 um (for surface pressure/path length) and CO2 bands near 1.61 um and 2.06 um.

Img G022: Why are the high latitudes blank on this Oct to Nov map?
OCO-2 is a passive sensor that measures reflected sunlight, so it cannot retrieve where the sun is too low or absent (high latitudes in autumn/winter).

Img G023: This OCO-2 map does not show CO2. What does it show and why does it matter for the carbon cycle?
Solar-induced fluorescence (SIF), light re-emitted by chlorophyll. It is a proxy for photosynthesis (gross primary productivity), i.e. where plants are drawing down CO2.

Img G024: How can OCO-2 measure SIF?
It fills in solar Fraunhofer absorption lines near 757 nm and 771 nm in the O2 A-band region of its spectrometer. Fluorescence adds light inside these dark lines.

Img G025: Why is SIF high over India and the Sahel in Aug to Oct but low over the Sahara?
Monsoon rains make Aug to Oct the growing season in India and the Sahel. The Sahara has almost no vegetation.

Img G026: Why is CO2 higher across the Northern Hemisphere than the Southern Hemisphere in this OCO-2 map?
Most fossil-fuel emissions are in the NH, and in NH winter/spring plant respiration and decay exceed photosynthesis, so CO2 builds up until the summer growing-season drawdown.

Img G027: In which months is NH atmospheric CO2 highest and lowest?
Highest around May (end of the dormant season), lowest around September to October (end of the growing season).

Img G028: Why does this OCO-2 map have no data gaps, unlike raw OCO-2 swath maps?
It is a Level 3 gridded product made by assimilating OCO-2 soundings into the GEOS model, which fills gaps (clouds, darkness, between orbits).

Img G029: Compare this Feb 2022 map (mean 416 ppm) with the 2014 to 2015 maps (about 395 to 400 ppm). What trend does it show?
Global CO2 increased by roughly 2 to 2.5 ppm per year, mainly from fossil-fuel burning.

Img G030: Why is CO2 lower over Europe and western Russia than over the Middle East in this June 2015 OCO-2 map?
June is the start of the NH growing season. Photosynthesis by forests and crops is drawing CO2 down over vegetated Eurasia, while deserts have little vegetation uptake.

Img G031: What season is it in the Southern Hemisphere, and how can you tell from the map?
SH winter (June). The far southern latitudes have no data because OCO-2 needs sunlight at adequate angles.

Img G032: Identify the instrument and variable. What is the Antarctic minimum here and why does it occur in Sept to Oct?
Aura OMI total column ozone (Dobson units). Below about 220 DU = ozone hole. In Antarctic spring, returning sunlight activates chlorine released on polar stratospheric clouds during the cold polar night, which destroys ozone.

Img G033: One Dobson unit equals what?
A 0.01 mm thick layer of pure ozone at standard temperature and pressure (about 2.69 x 10^16 molecules/cm2). Typical total column is about 300 DU (3 mm).

Img G034: What instrument and satellite produced this south-polar map, and what threshold defines the ozone hole?
OMI on Aura (Ozone Watch daily map). Ozone hole = total column ozone below 220 Dobson units.

Img G035: Why does the Antarctic ozone hole form in September to October and not in midwinter?
Chlorine is activated on polar stratospheric clouds during the dark, very cold winter, but ozone destruction (Cl + O3 catalysis) needs sunlight to photolyze Cl2. Sunlight returns in Antarctic spring.

Img G036: This ozone hole map looks just like an OMI map but was made by a different satellite. Which instrument on which satellite?
OMPS (Ozone Mapping and Profiler Suite) Nadir Mapper on Suomi NPP. NASA Ozone Watch switched from OMI to OMPS as its main source for recent years.
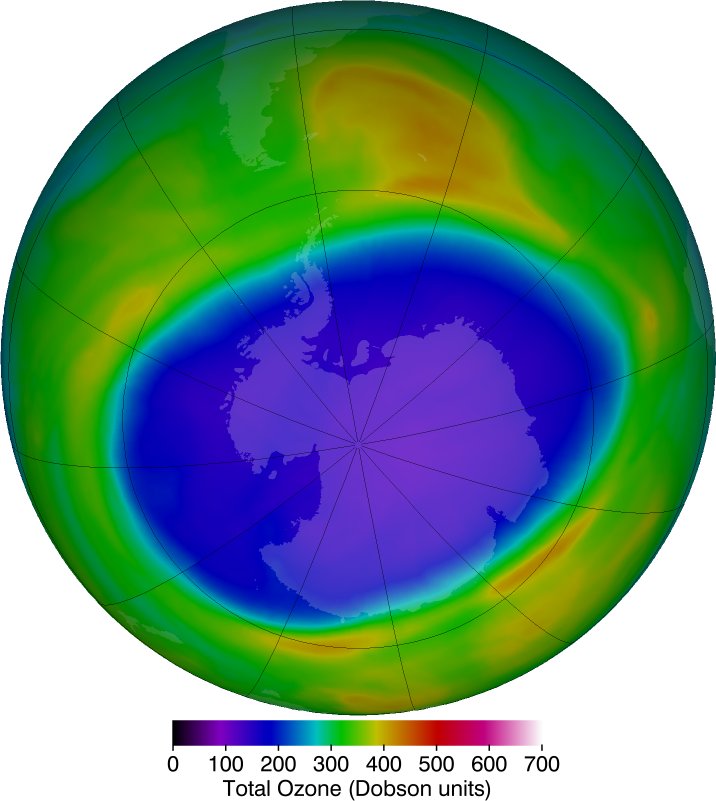
Img G037: Why was the 2020 ozone hole so round and long-lived?
A strong, stable, very cold polar vortex kept polar stratospheric clouds around longer and isolated the polar air, prolonging chlorine-driven ozone loss.

Img G038: In this map red marks the ozone hole, but in Ozone Watch maps the hole is blue/purple. What is the safest way to read any ozone map?
Read the color bar: the hole is total column ozone below 220 Dobson units, whatever color that value is drawn in.

Img G039: What date range is used to compare ozone hole size year to year?
NASA Ozone Watch uses the average area from Sept 7 to Oct 13 (and minimum ozone from Sept 21 to Oct 16).

Img G040: According to this record, in which year was the average Antarctic ozone hole largest, and in which year was minimum ozone lowest?
Largest area: 2006 (about 27 million km2). Lowest minimum: 1994 (92 DU).

Img G041: What treaty explains the slow recovery trend, and what chemicals did it target?
The Montreal Protocol (1987) phased out CFCs, halons and other ozone-depleting substances. Long atmospheric lifetimes mean full recovery is expected around the 2060s.

Img G042: Why is a deep Arctic ozone depletion like March 2020 rare compared with the Antarctic ozone hole?
The Arctic polar vortex is usually weaker and warmer (more planetary-wave disturbance from NH mountains and land-sea contrast), so fewer polar stratospheric clouds form and less chlorine is activated.
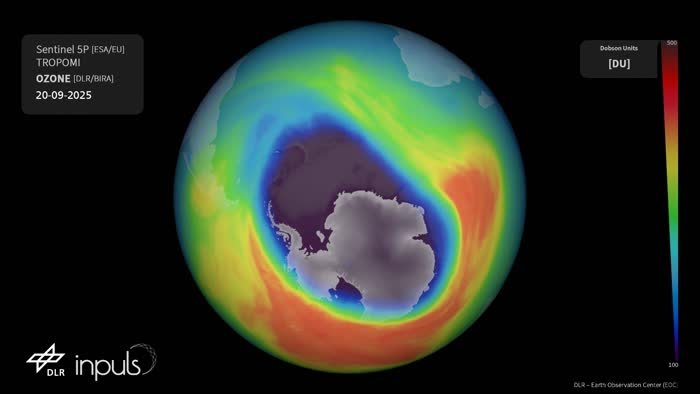
Img G043: Name three satellite instruments that can map the Antarctic ozone hole from backscattered UV.
OMI (Aura), OMPS (Suomi NPP and NOAA-20), and TROPOMI (Sentinel-5P). Earlier: TOMS.

Img G044: Which Aura instrument measures chlorine monoxide (ClO) like this, and how?
MLS, the Microwave Limb Sounder. It measures thermal microwave emission from the atmospheric limb, giving vertical profiles day or night and through thin clouds/aerosol.

Img G045: Why does high ClO over Antarctica in spring indicate ozone destruction?
ClO is the reactive (activated) form of chlorine, released from reservoirs (HCl, ClONO2) on polar stratospheric clouds. ClO catalytically destroys ozone when sunlight is present.

Img G046: Inside the Antarctic vortex in late winter, MLS shows high ClO but low HCl and HNO3. Explain.
On polar stratospheric clouds, the reservoir HCl reacts with ClONO2 to release Cl2 (later ClO), so HCl drops and ClO rises. HNO3 is taken up into PSC particles and sediments out (denitrification), which keeps chlorine active longer.

Img G047: Why is a limb sounder like MLS better than a nadir mapper like OMI for this chemistry?
Limb viewing gives vertical profiles (altitude resolution) of many trace gases in the stratosphere, and microwave emission works in polar night.

Img G048: Why does this ozone map look like thin dotted stripes instead of a filled map like OMI?
It is from MLS, a limb sounder. It measures vertical profiles at points along the orbit track only (no wide cross-track swath), so daily coverage is a set of orbit lines.

Img G049: 46 hPa corresponds to roughly what altitude, and why is ozone low there over Antarctica in September?
About 20 to 21 km in the lower stratosphere, the core altitude of polar ozone destruction by activated chlorine in spring.

Img G050: Comparing March 2020 with the 2015 to 2019 March average, NO2 over the NE US cities dropped sharply. Why, and why does NO2 respond so fast?
COVID-19 lockdowns cut vehicle and industrial combustion. NO2 has a short lifetime (hours to a day), so column amounts track emissions closely and stay concentrated near sources.

Img G051: Which instrument on which satellite produced this NO2 map?
OMI (Ozone Monitoring Instrument) on NASA's Aura.

Img G052: What causes the NO2 maximum centered on New York City?
Fossil-fuel combustion (traffic, power generation, heating, industry) emits NOx. NO2's short lifetime keeps it close to dense urban sources.

Img G053: Units on this map are 10^15 molecules/cm2. What kind of measurement is that?
A vertical column density: the number of NO2 molecules above each cm2 of surface (here the tropospheric part), from UV-visible absorption spectroscopy (DOAS).

Img G054: This OMI map is a difference map. What does purple mean and why is it over US cities?
Purple = NO2 decreased from 2005 to 2014. Emission controls (vehicle standards, power-plant NOx controls under the Clean Air Act) cut urban NO2.

Img G055: How can you tell a difference/anomaly map from a concentration map?
A diverging color bar centered on 0 with negative and positive values (here -2.5 to +2.5 x10^15 molecules/cm2).

Img G056: Which instrument made these maps, and what explains the difference between the two panels?
TROPOMI on Sentinel-5P (tropospheric NO2). Left: COVID-19 lockdown (Feb 2020) cut combustion emissions. Right: emissions rebounded by Apr to May 2020 as activity resumed.
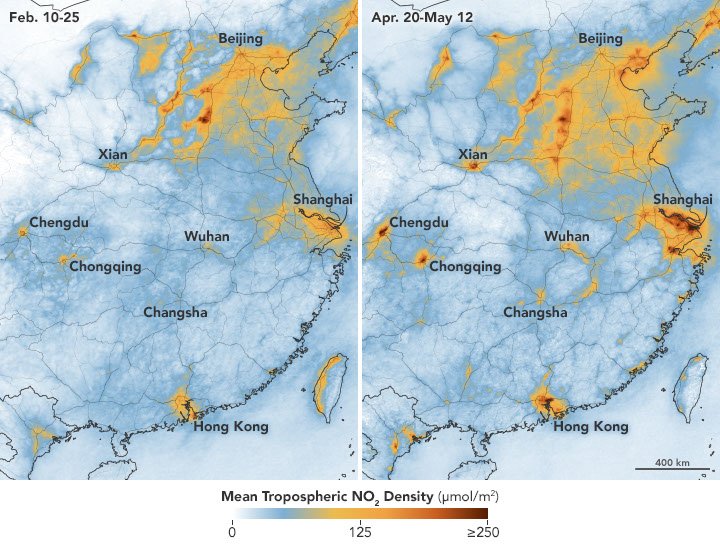
Img G057: Why can TROPOMI resolve individual cities better than OMI?
TROPOMI's ground pixels are about 5.5 x 3.5 km (since 2019) versus about 13 x 24 km for OMI at nadir.

Img G058: In these weekly TROPOMI maps, a faint NO2 line runs down the Central Valley. What source does that suggest?
Vehicle (especially diesel truck) traffic along Highway 99 and I-5, plus agriculture/industry in the valley. NO2 maps outline major transport corridors.
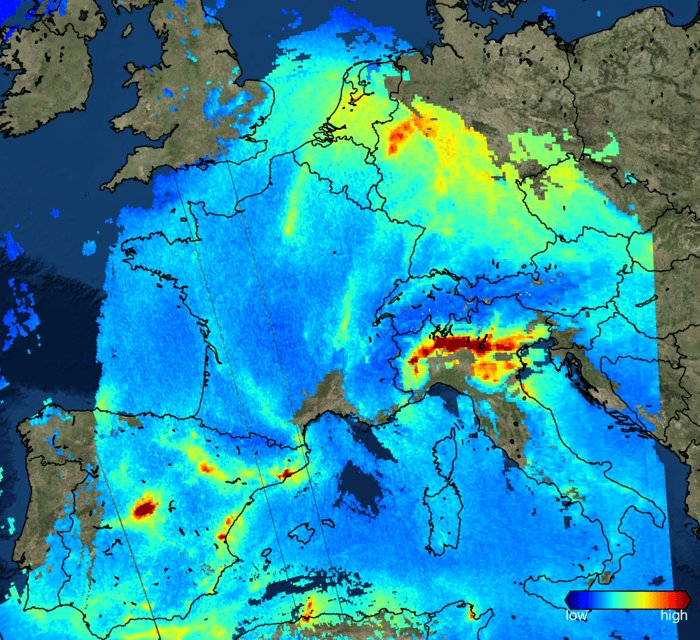
Img G059: This Nov 2017 image was one of the first from which mission? Name two hotspots visible.
Copernicus Sentinel-5P (TROPOMI). Hotspots: Po Valley (northern Italy) and the Ruhr area/Benelux (also Madrid).

Img G060: NO2 is high over Europe and also over central Africa in this TROPOMI image. What are the main sources in each?
Europe: fossil-fuel combustion (traffic, power, industry). Central Africa: savanna/agricultural biomass burning (plus soil and lightning NOx).

Img G061: What gas and what instrument produced this map of 'ultra-emitters'?
Methane (CH4), detected by TROPOMI on Sentinel-5P using its shortwave-infrared band near 2.3 um.

Img G062: Why does finding methane super-emitters matter for climate?
CH4 is a potent greenhouse gas (about 80 times CO2's warming over 20 years) with a short lifetime (about a decade), so fixing large leaks and venting cuts near-term warming quickly.

Img G063: Which gas is mapped (units ppb, 1700 to 2000) and which instrument?
Methane, XCH4 (column-averaged dry-air mole fraction), from TROPOMI on Sentinel-5P.

Img G064: Why is the ocean mostly blank in a TROPOMI methane map?
Water is very dark in the shortwave IR, so there is too little reflected sunlight to retrieve CH4 except in sunglint.

Img G065: Name three major sources of atmospheric methane.
Wetlands (natural), agriculture (ruminant livestock, rice paddies), fossil fuels (oil/gas leaks, coal mining), plus landfills and biomass burning.

Img G066: Which gas is mapped (mmol/m2) and what process causes the hotspot over central Africa in July?
Carbon monoxide (CO) from TROPOMI. Southern-hemisphere African dry-season biomass burning (savanna and agricultural fires) peaks in June to August.

Img G067: Why does CO spread much farther from its sources than NO2?
CO has a lifetime of about 1 to 2 months versus hours for NO2, so CO plumes are carried across continents and oceans.

Img G068: Why is CO column low over Tibet and the Andes even though they are not unusually clean?
High surface elevation means a shorter atmospheric column (less air above), so the total column is smaller.

Img G069: Identify the satellite/instrument and gas in this volcanic map, and what does 'STL' mean?
Suomi NPP OMPS (Nadir Mapper), sulfur dioxide column in Dobson units. STL = retrieval that assumes the SO2 sits in the upper troposphere/lower stratosphere (other products assume the boundary layer, lower or middle troposphere).

Img G070: Why do climate scientists care how much SO2 reaches the stratosphere?
Stratospheric SO2 converts to sulfate aerosol that reflects sunlight for 1 to 2 years and cools the surface (e.g., Pinatubo 1991 cooled the globe about 0.5 C).

Img G071: An SO2 cloud of about 830 kt with max 331 DU appears over the North Pacific in June 2019. Which eruption and which instrument?
Raikoke volcano (Kuril Islands), seen by OMPS on Suomi NPP.

Img G072: How does a UV spectrometer like OMPS or OMI detect SO2?
SO2 has strong absorption bands in the UV (about 300 to 320 nm). The instrument measures backscattered sunlight and retrieves the column from that absorption (here with a principal-component (PCA) algorithm).

Img G073: What does the UV Aerosol Index measure, and which particles give positive values?
It measures the spectral contrast between two UV wavelengths compared with a pure-Rayleigh atmosphere. Positive values flag UV-absorbing aerosols: volcanic ash, smoke (black/brown carbon) and desert dust. It is unitless.

Img G074: Compare this map with the OMPS Hunga Tonga map. Why does TROPOMI show so much more structure?
TROPOMI pixels are about 5.5 x 3.5 km versus about 50 x 50 km for OMPS Nadir Mapper, so it resolves fine filaments of the plume.
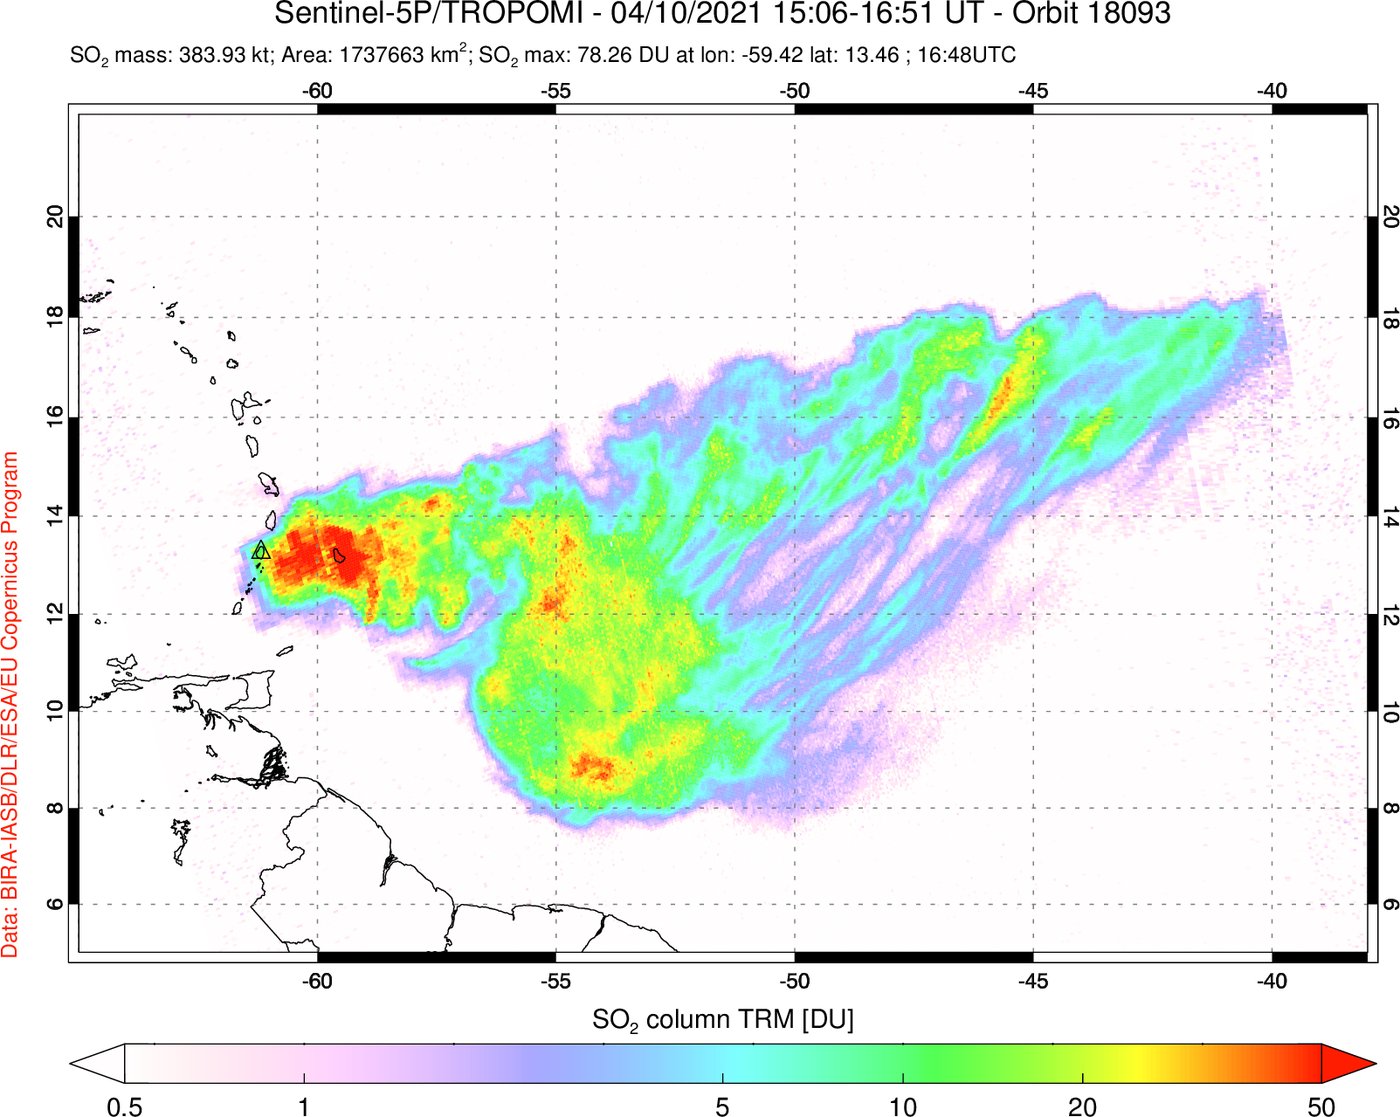
Img G075: Which instrument and gas? What does the triangle near 13 N, 61 W mark?
TROPOMI on Sentinel-5P, sulfur dioxide (DU). The triangle marks La Soufriere volcano on St Vincent.

Img G076: Which instrument made this 2011 SO2 map?
OMI on Aura (title reads Aura/OMI). It shows the Nabro (Eritrea) eruption plume on June 13, 2011.

Img G077: Both panels come from instruments on one satellite. Which satellite and which two instruments?
Suomi NPP: VIIRS (true-color imagery and fire detections) and OMPS (UV aerosol index).

Img G078: This Worldview map uses a black-blue-white palette. Which gas and instrument, and what event?
Sulfur dioxide (total vertical column, DU) from TROPOMI on Sentinel-5P. The plume from the Nov 2025 Hayli Gubbi eruption in Ethiopia drifting over Arabia toward South Asia.

Img G079: What product is this, and which aerosol types make the colored patches?
TROPOMI UV Absorbing Aerosol Index. Biomass-burning smoke (South America, North America) and desert dust (Sahara).

Img G080: Which Suomi NPP instrument made this, and what event in June 2020 does it show?
OMPS Aerosol Index. The record 'Godzilla' Saharan dust plume crossing the Atlantic to the Caribbean (June 2020).

Img G081: Aerosol Index vs Aerosol Optical Depth: what is the difference?
AOD (e.g., MODIS) measures total extinction by all aerosols (unitless optical thickness). AI (UV, e.g., OMPS/OMI/TROPOMI) is a qualitative index flagging UV-absorbing aerosols (smoke, dust, ash) and works over clouds and bright surfaces.

Img G082: Which instrument and product? What do the dark brown regions over Africa and Siberia in August mean?
Aqua MODIS aerosol optical depth (monthly). Dark brown = high AOD from smoke: the African savanna burning season and (likely) Siberian boreal wildfires.

Img G083: Why is the Sahara gray (no data) on this AOD map even though it is very dusty?
The Dark Target AOD retrieval needs a dark surface. Bright deserts are handled by the separate Deep Blue algorithm, not shown in this product.

Img G084: What does an AOD of 1.0 mean physically?
Optical depth tau = 1: direct sunlight transmission is e^-1, about 37%. AOD below 0.1 is clean air, and above 1 is very hazy or smoky.

Img G085: Aqua MODIS AOD over the US Northeast on June 7, 2023 is dark red. What caused it?
Smoke from the Quebec wildfires transported south, producing record poor air quality in New York City.
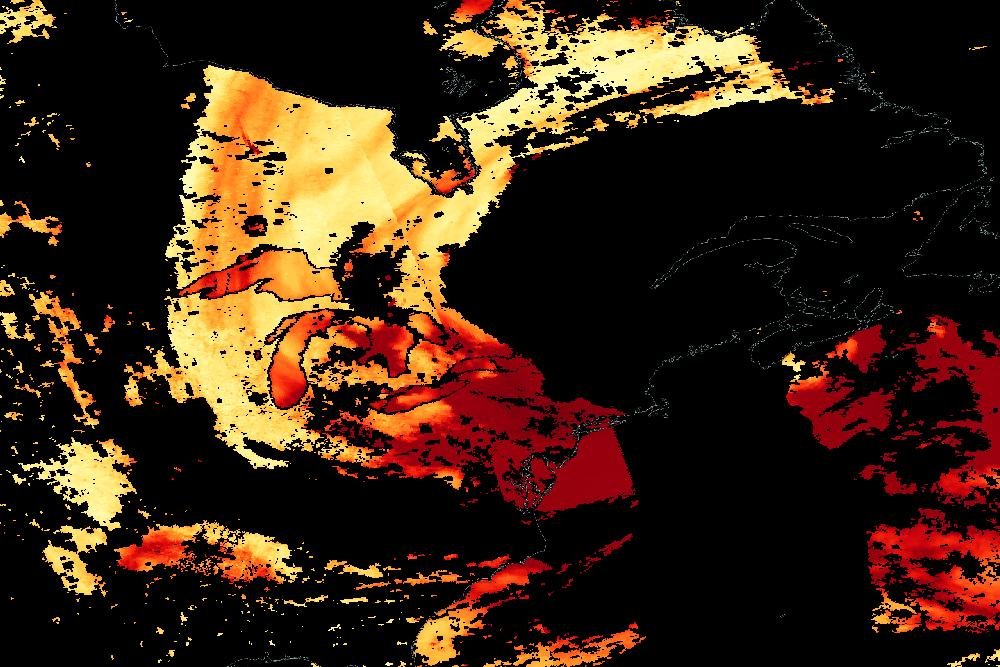
Img G086: This AOD map looks like a MODIS product. Which other instrument produces AOD with the same Deep Blue/Dark Target algorithms?
VIIRS on Suomi NPP (and NOAA-20/21), the successor to MODIS.

Img G087: Why are there black wedge-shaped gaps between swaths near the equator but not at high latitudes?
MODIS has a 2330 km swath. Adjacent orbits overlap at high latitudes but leave gaps near the equator, where orbit tracks are farthest apart.

Img G088: In true color, the tan haze over the Atlantic is what aerosol, and where does it come from?
Mineral dust from the Sahara, carried west by the trade winds (Saharan Air Layer), sometimes reaching the Caribbean and the Americas.

Img G089: What aerosol type is the tan plume and why does it matter for the Amazon and the Caribbean?
Saharan mineral dust. It fertilizes the Amazon (phosphorus), affects Caribbean air quality, and suppresses Atlantic hurricane formation (dry, stable Saharan Air Layer).

Img G090: Which instrument made this and what produced the very high values over the Tasman Sea in Jan 2020?
OMPS on Suomi NPP (UV aerosol index). Smoke from the 2019 to 2020 Australian 'Black Summer' bushfires.

Img G091: What is the advantage of GOES-16 ABI AOD compared with MODIS AOD?
GOES-16 is geostationary, so ABI retrieves AOD every 5 to 15 minutes over the same area, tracking smoke movement through the day. MODIS (polar orbit) sees each place about once per day.

Img G092: How can you tell smoke from cloud in a true-color image like this?
Smoke is diffuse, milky gray-brown and partly translucent (surface features faintly visible). Clouds are bright white, opaque, with sharp textured edges.

Img G093: GOES ABI lacks a green band. How is a true-color/GeoColor image made?
Green is simulated from the blue (0.47 um), red (0.64 um) and veggie near-IR (0.86 um) bands.

Img G094: Which GOES bands detect volcanic SO2 in the SO2 RGB, and what color does SO2 appear?
ABI 7.3 um (band 10) and 8.5 um (band 11) SO2 absorption channels differenced with clean IR (10.35 um). SO2 shows bright green/yellow-green.

Img G095: Why is the 3.9 um shortwave IR band used to detect active fires?
Fires (about 800 to 1200 K) emit strongly near 3 to 4 um (Wien's law), so even a small fire raises a pixel's 3.9 um brightness temperature far more than its 11 um temperature.

Img G096: What does a CALIPSO 'curtain' show that a MODIS AOD map cannot?
The vertical distribution (altitude and thickness) of aerosol and cloud layers along the orbit track, from the CALIOP lidar.
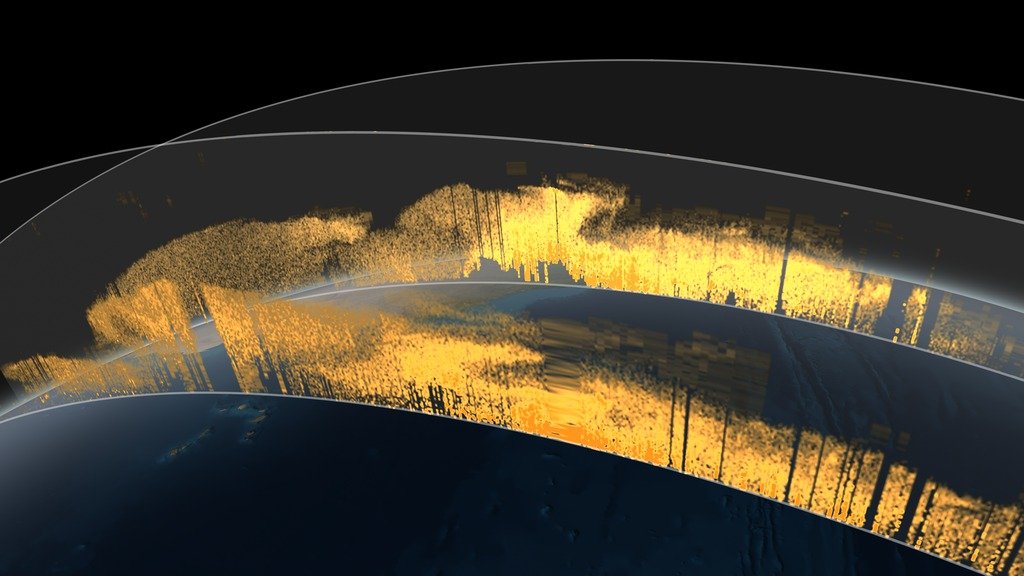
Img G097: CALIOP is what kind of instrument?
An active two-wavelength (532 and 1064 nm) polarization-sensitive lidar. Depolarization at 532 nm helps distinguish nonspherical dust and ice from spherical droplets/smoke.

Img G098: Why do CALIPSO observations appear as thin diagonal curtains rather than a full map?
CALIOP is a nadir-pointing lidar with a tiny footprint and no cross-track scanning, so it samples only a narrow line beneath each orbit (16-day repeat).

Img G099: Why combine CALIPSO and MODIS in one view?
Both flew in the A-Train within minutes of each other. MODIS maps where the aerosol is horizontally (and AOD). CALIPSO shows how high and how thick the layers are.

Img G100: In a CALIPSO 532 nm total attenuated backscatter curtain, how do you tell aerosol from clouds?
Aerosol layers show weak to moderate backscatter (green/yellow/orange), usually low and diffuse. Clouds give strong backscatter (red/white/gray) and often block the signal below them (attenuation).