Quiz 3 material - BIEB150
 Call Kai
 Learn
 Practice Test
 Spaced Repetition
 Match
 Flashcards
 Knowt Play
1/138

There's no tags or description
Looks like no tags are added yet.
139 Terms
if we know the components that constitute phenotypic variation:
Vp = Vg +Ve, we can calculate heritability as:
h²=Vg/Vp = Vg/Vg+Ve
h² is the…
proportion of variation due to genetic effects, NOT the degree to which a trait is driven by genes
Quantifying the strength of selection:
if only “red” individuals breed, we have selection (non-random success of phenotypes)
the difference between mean phenotype of total population and mean of selected group (e.g. group that breed) is the seleciton differential, S
S = P*-P
P* = mean of group after selection
P = mean of population before selection

selection does not equal evolution by natural selection:
need h²>0 for evolution by natural selection
The Breeder’s Equation - Predicting Evolutionary Reponse/heritability
R = h² x S
change in a trait = heritability x strength of selection
techincal terminology:
R - response to selection
h²: heritability
S: strength of selection (related to s)
The Breeder’s Equation in words:
heritability combined with the strength of selection, determines the evolution of a trait
one can predict response to selection. one can even use this equation to estimate heritability by manipulating S and seeing what R is
Example of selection differential and breeder’s equation/heritability:
mean before selection = 80.1
mean after selection = 84.7
selection differential: S = Pafter - Pbefore
S = 84.7-80.1=4.6
What is the expected evolutionary response? (what is the expected change in the average phenotype?)
Breeder’s equation R = h² x S
if h² = 0.9; R = 0.9×4.6 = 4.14 (increase in mean by 4.14)
if h² = 0.0; R=0.0×4.6 = 0.00 (no response to selection)
You study a population of frogs in southern florida for one season. Unfortunately, the invasive Burmese python invaded the area. After Burmese Pythons established themselves, the average snout-vent length (a measure of body size) of the frogs decreased from 79.7cm to 73.0cm.
1) How strong was selection on frog size?
2) Assuming a heritability of 0.5, what is the expected evolutionary change in size in the next generation?
1) S = Pafter - Pbefore
S = 73.0cm - 79.7 cm = -6.7
2) R = 0.5*-6.7 = -3.35 (decrease in mean)
How does selection on quantitative traits operate in the wild?
One can look at the relationship between the trait value and relative
fitness (e.g., probability of contributing to the next generation): this
is a fitness function. Three types of fitness functions:
1. Directional
2. Disruptive
3. Stabilizing
Modes of selection on a Quantitative trait:
general graph set-up on pic
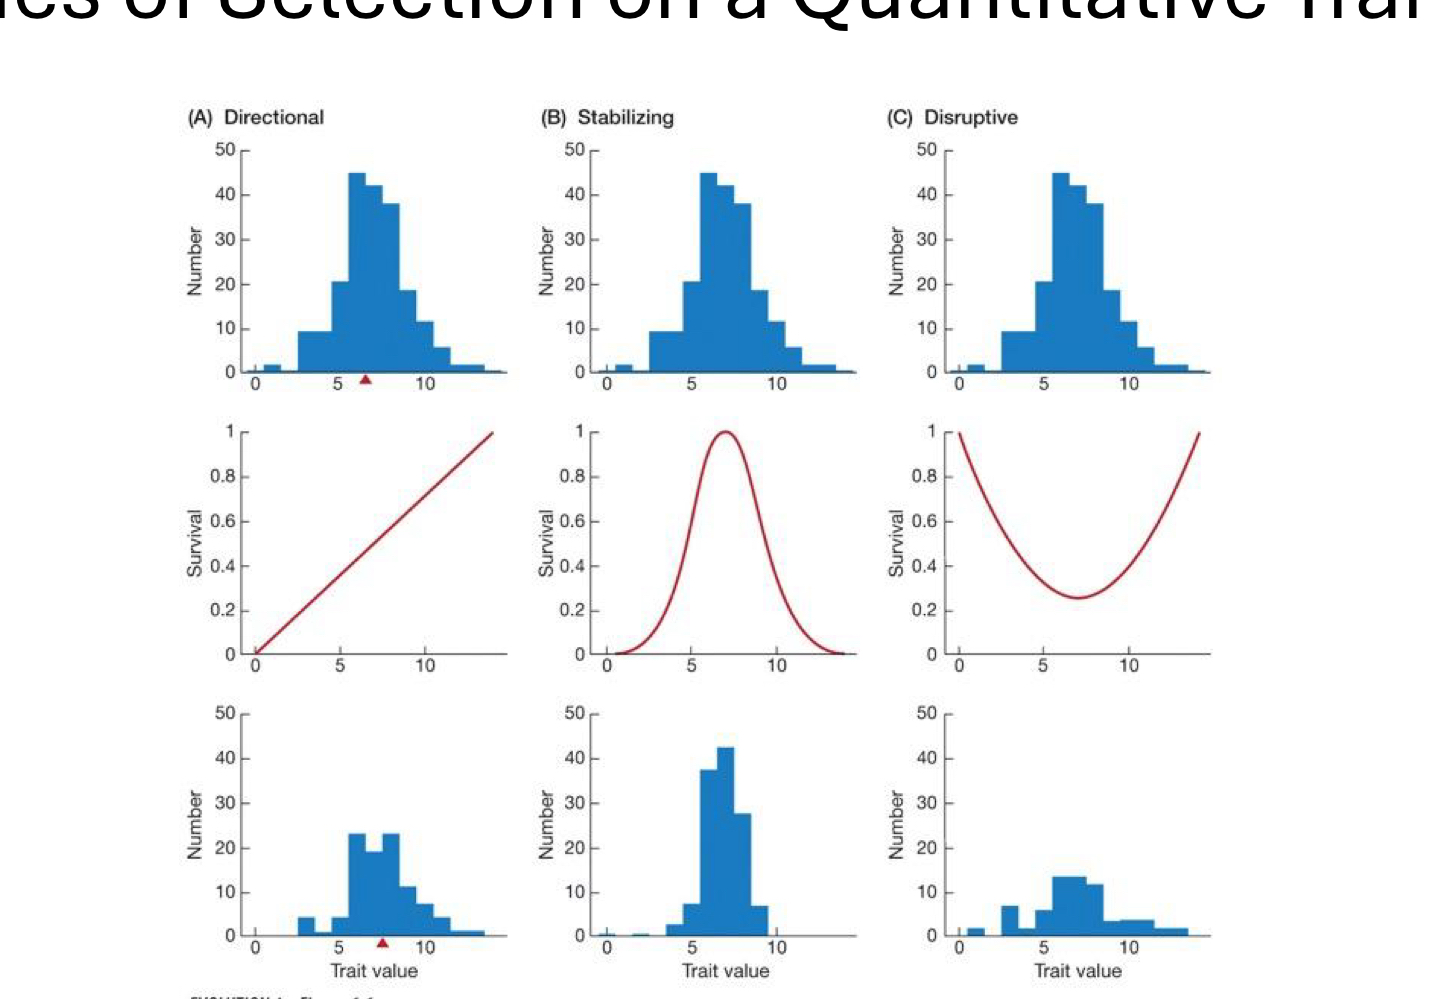
fitness functions: directional
refer to graphs, larger or smaller trait values have higher fitness

directional fitness functions in moths
pre-industrial revolution moths were white to match white bark on trees, post industrial revolution moths became darker to match bark that changed color bc of soot. Fitness of different colors was linear, showing directional fitness
directional fitness functions: lizards
the bigger the toe pads on these tree climbing lizards contributed linearly to their fitness
fitness functions: disruptive
refer to graph, extreme trait values have higher fitness

disruptive fitness functions: fishes/fishing
most fish are caught are of a standard size dictated by the mesh of the nets (mid-size fish most likely caught)
prediction: if you grow fast (and mature late) you can get too big to be caught, and so you can reproduce. Or if you grow slow but mature early, then you reproduce before you get caught
small fish grew slow and could swim through fishing nets, large fish too big for nets and grew fast
fitness functions: stabilizing
refer to graph, intermediate trait values have higher fitness

stabilizing fitness functions: beak width
survival in juvenile, yearling and adult crossbills is all highest among intermediate bill width
stabilizing fitness functions: human birth weight
babies born at intermediate weight have really low mortality rate
stabilizing fitness functions: internal fertilization with a rigid exoskeleton
average genetalia size is favored because genetalia are very rigid making incompatibility a large problem, big doesn’t fit, small doesn’t create stimulation
explain how directional, stabilizing, and disruptive selection impact the mean and variance of a trait:
stabilizing: no change in mean, decrease in variance because extreme phenotypes become less common
directional: mean shifts toward the favored extreme, variance decreases because unfavored end of phenotype is selected against
disruptive: no change in mean, increase in variance because extreme phenotypes are favored
adaptive landscape:
a useful way to visualize the evolutionary process
can look at relationship between phenotypes or gentoypes and fitness

in the real world things/adaptive landscapes are more complex:
many genes/phenotypes interact in determining function or fitness
selection acts on the combination of these effects
natural selection is conceived as a hill climbing algorithm
predicts how population traits will move
selection usually pushes populations to the top of the adaptive peaks
crossbill beaks adaptive landscape:
crossed structure is needed for pinecones, selection will favor the bill depth and groove needed for these pinecones
what’s the effect of different evolutionary forces? (adaptive landscape)
mutation - will pull away from adaptive peaks
drift - population will randomly move around, equally likely to move close or away from peak
selection - pushes populations to top of peak
migration - counteract influence of selection, pull populations away from fitness peak
The shape of adaptive landscapes matters!
spikey peaks make it hard for populations to move around
smoother peaks allow populations to move to different peaks
adaptive radiation
comes from animals mating within their adaptive landscape peak
adaptation:
• Natural selection continuously nudges populations toward optimal trait expression
• Despite this, most populations elude perfect adaptation to their environment.
• Evolutionary outcomes represent a compromise reflecting the diverse needs and functions of organisms
• A variety of factors limit the ability of a population to become perfectly adapted -> this imperfect adaptation or failure to adapt is called maladaptation
there are variety of mechanisms thought to lead to maladaptation including:
• Fundamental constraints and trade-offs that limit adaptive evolution (e.g., no genetic variation in traits upon which selection may act).
• Functional trade-offs, where the same trait is used for multiple functions and all these functions cannot be optimized at once.
• Recurrent input of new alleles through mutation and migration, and genetic drift.
• A shift in ecological (selective) conditions.
fundamental constraints and trade-offs that limit adaptive evolution
no genetic variation in traits upon which selection may act

example of maladapation/constraints:
Animals and plants are exposed to all kinds of novel stressors (chemicals, pesticides, microplastics, light pollution, etc.)
This often has detrimental effects
Many species can’t evolve because there is simply no genetic variation
flies swarm around light until they die of exhaustion, no heritable variation for selection to act upon, have to wait for new mutations to arise
functional trade-offs:
the same trait is used for multiple functions and all these functions cannot be optimized at once
example of functional trade-off, birds
Developing colored feathers is one example: doing so helps attract a mate, but colorful
birds tend to be more easily spotted by predators.
example of functional trade-off, cheetah
Example: Cheetahs could be faster with longer legs. But longer legs would be more fragile
arms race between cheetahs and predators to run faster
recurrent input:
of new alleles through mutation and migration, and the inescapable effects of genetic drift
gene flow example of maladaptation
• Gene flow and founder effects result in introduction of maladapted (mismatched) color variants.
• Imperfect camouflage increases bird predation and reduces overall population size of all individuals.
a shift in…
ecological (selective) conditions, can change the way selection acts on a trait
ex: seasonality, white hares do better in winter (blending w snow), without snow they stand out
maladaptation in humans:
brain volume increasing while pelvis size does not, babies get stuck during birth
if babies get stuck it can cause stretching of the brachial plexus (shoulder)
reconstructing the evolutionary history of any trait is difficult:
we cannot easily identify the origin of a trait based on its current function
what looks like an obvious adaptation might simply be due to chance
Inferring Adaptation:
1. Observations among populations or species
2. Experimentation
3. Comparative method
observation
looking for an association between phenotype or performance and features of the environment/ecology
observation - performance vs. environment in iguanas
iguanas perform best in terms of speed, digestive efficiency, endurance, and hearing at the range of temps that they experience in the wild
meaning speed, digestive efficiency and endurance are all driven by selection
observation - parallel evolution
• Repeated evolution of a trait across independent replicate populations or species is strong evidence for adaptation.
• Drift is unlikely to repeatedly generate the same phenotype.
• Here we find repeated evolution of color patterns in Anolis across the lesser Antilles.
• Pale pigmentation is repeatedly found in low moisture habitats and green pigmentation in mountain habitats.
comparative method
1) chimpanzees are smaller than gorillas but have larger testes
2) chimpanzees are polygamous while gorillas are monogomous
hypothesis: sperm competition exists in polygamous species more than in monogamous ones and this explains the difference in testes size
how common is monogamy in humans?
monogamy 16.7%
1.1% polyandry, women married to multiple males
one male being married to multipl females is norm
comparative method - teste size and body size
collect trait data for many polygamous/monogamous species and determine if there is a statistically significant testes size difference
polygamous taxa had larger testes than monogamous taxa
could also be from polygamy developing many times independently and testes shift happens each time
In this example:
whenever a species evolves a more polygamous mating system, relative testis size increases as well
this is evidence for adaptation to sperm competition
experimentation - transplant experiments
if we transplant species into a foreign environment we expect it to do worse
in graph A, population A outperforms population B in its native environment
in graph B, population B outperforms population A in its native environment
C and D A outperforms B showing no evidnece for local adaptation, breaks perfect match between fitness and environment

rapid local adaptation in Drosophilia
can lay eggs into intact fruits
flies near fields of certain fruits prefer to lay eggs on those fruits
offspring from cherry tree grow up best in cherry environment
experimentation - transplant experiment of Killifish
adapted to the salinity of their environment
swimming endurance of from fresh and brackish water populations were best in their ‘home’ environment
co-evoltution
the joint evolution of two (or more) ecologically interacting species, each of which evolves in response to selection imposed by the other
Co-evolution and Interactions
We will consider coevolution and other evolutionary consequences of:
• Competitive interactions
• Predator-prey interactions
• Host-parasite interactions
• Mutualistic interactions
coevolution (strictly)
reciprocal evolutionary change of interacting species
Competitive interactions & Ecological character displacement
The process whereby one species influences the evolution of another via interspecific competition.
Similar to coevolution of competitors, but also includes cases of non-reciprocal evolution (one species affects a second, but not vice-versa)
Ecological character displacement
The term is usually applied in the case of resource exploitation competition
Resource use competition: if species compete for the same resources, there are two options:
1. One species outcompetes the other one (competitive exclusion)
2. One (or both) species evolve to reduce competition and facilitate coexistence (ecological
character displacement)
Graph:
sides are competition only within species
middle is competition within AND between species
sepcies evolve to evade direct competition and partition resources, graph shifts to 2 separate peaks

assumptions + additional predictions of ecological character displacement
assumptions:
- Competition is symmetric
- No other sources of selection on resource utilization
additional predictions:
- Divergence occurs most rapidly when there is an initial difference in utilization between the species.
example in small and medium ground finches of ecological character displacement
• On islands where they do not co-occur (Los Hermanos and Daphne Major) there is
more overlap in their bill depth.
• Where they do co-occur (and compete for resources) the fulignosa and fortis beaks are more different.
example of non-reciprocal character displacement in native green anoles
• Some islands only have green anoles, some have green and brown anoles
• Brown anoles usually stay on the ground (that’s why they are brown)
• On islands where invasive brown anoles were introduced, green anoles show evolution in toe-pad characteristics.
• Toe pads evolved due to competition other species
predation
one species kills and consumes members of another species (host-parasite coevolution dealt w separately)
Evolution of predator-prey interactions Example: Tephritid
Tephritid flies and their jumping spider predators.
The flies have evolved pigmentation patterns and wing displays that mimic aggressive spider displays.
When being hunted they exhibit the display to scare predators off.
evolution of predator-prey interactions - example newts and snakes
• Newts produce one of the most potent defenses against predators: the neurotoxin “tetrodotoxin” (TTX)
• Newts produce one of the most potent defenses against predators: the neurotoxin
“tetrodotoxin” (TTX)
• There is a match between newt toxicity and snake resistance across the range where both species co-occur, indicating coevolution!
evolution of predator-prey interactions example aposematic coloration
The evolution of conspicuous coloration by prey as advertisement of noxious properties to predators is called aposematic coloration.
Rough skinned newts (Taricha granulosa) exhibit defensive posturing that shows colorful belly to signal that it is toxic
experiments on aposematic coloration show:
• Predators are capable of learning rapidly to associate noxious prey with bright colors
• This leads to positive frequency-dependent selection in favor of common warning color phenotypes in prey populations
• Birds have some degree of unlearned aversion to prey with certain color patterns,
but this is thought not to be sufficient to explain the evolution of warning coloration.
Batesian mimicry
• Toxic butterflies evolve bright warning coloration, to warn off predators (birds). Mimics gain protection by looking like the toxic species, but actually being palatable. Batesian mimics are cheating.
Mullerian mimicry
• Heliconius erato: a toxic butterfly that has different wing patterns in different populations
• H. melpomene is also toxic and evolved the exact same patterns in all populations
• This helps both species because predators learn to not eat either of the species. There
is a mutual benefit
sexual mimicry: when organisms exploit sexual signals
Sexual mimicry occurs when an organism mimics the appearance, behavior, or signals of one sex in order to gain a reproductive or survival advantage.
This can occur:
• Within a species (e.g., males mimicking
females)
• Between species (e.g., orchids mimicking
female insects)
Arms race:
• “Arms races” occur when an adaptation in one lineage (e.g., predators) may change the selection pressure on another lineage (e.g., prey), giving rise to a counter-adaptation.
• If this occurs reciprocally, an unstable runaway escalation may result.
• Such escalating co-evolution is not limited to predator-prey interactions
arms race analogy - predator-prey interactions
ex: escalation of predators and prey through the fossil record
relative brain sizes of carnivores and herbivores through the fossil record
what is an evolutionary arms race and how can we recognize it?
An evolutionary arms race occurs when two species exert selective pressure on each other, causing each to evolve new adaptations and counter-adaptations over time. It is a form of coevolution where improvements in one species favor improvements in the other.
A classic pattern is:
Species A evolves a trait that gives it an advantage.
Species B evolves a response to reduce that advantage.
Species A then evolves another improvement.
The cycle continues across generations.
mutualism
individuals of two species interacr with the result that both benefit
Contrast with “symbiosis”, which is any long-term intimate relationship between members of two species, whether mutualistic, parasitic, or commensal, etc.
symbiotic mutualism
• Micorrhizal associations between plants and fungi
• Corals and photosynthetic dinoflagellates
• Lichens (algae and fungi)
example of coevolution/mutualism
Example: Approximately 80% to 95% of all terrestrial plant species form symbiotic
relationships with mycorrhizal fungi, which are essential for nutrient and water absorption
Mycorrhizal fungi provide their host plants with mineral nutrients (nitrogen and phosphorus)
In exchange, the plants provide sugars (carbon)
visitor mutualisms:
• Plant-pollinator
• Plants and frugivores
• Cleaner fish and “clients”
For at least some systems, the extent to which the associations are truly mutualistic varies with environment
another mutualism example:
joint diversification of angiosperms (flowering plants) and pollinators
obligate mutualism
the fig tree depends on the wasp for pollination, the fig wasp depends on the fig to reproduce
mutualism can lead to what?
co-speciation
co-speciation:
a form of coevolution in which two closely associated species speciate in parallel, so that when one species splits into two species, the other species also splits into corresponding lineages.
Darwin’s arms race hypothesis:
Selection alternates between plant and pollinator, causing a continual
and gradual elongation of the pollinator’s tongue and the flower’s spur
parasitism:
Individuals of one species live on or in members of another species,
which are not killed immediately. One party (parasite) gains at the
expense of the other (host).
virulence:
severity of harmfulness of an infection
selection might often favor an intermediate degree of virulence
evolution of Myxoma virulence
in the long term: virus strains with intermediate virulence are most successful
Individuals of one species live on or in members of another species,
which are not killed immediately. One party (parasite) gains at the
expense of the other (host).
transmission-virulence trade-off
Pathogens that replicate themselves most effectively are expected to have highest fitness
However: increased replication is expected to harm the host
This is because pathogen growth damages the host and increases host mortality. If the host dies, the pathogen is harmed too
There is some Goldilocks scenario where virulence is high enough to allow effective pathogen replication without affecting host survival too much
Whether increased or decreased virulence evolves depends on the initial virulence relative to the optimal virulence
virulence and mode of transmission of human diseases:
Direct transmission (e.g., lice) If the parasite is transmitted directly from host to host, virulence tends to be lower. (host needs to survive to spread the parasite)
Transmission through vector (e.g., malaria) If the parasite is transmitted through a vector, virulence tends to be higher. (parasite can survive in the vector even though the host might be long dead)
brood parasitism - coevolution between European cuckoos and hosts
Hosts frequently parasitized by common cuckoo in the UK are reed warbler, meadow pipit, pied wagtail, and dunnock.
brood parasitism - an arms race?
adaptation: newly-hatched cuckoo chicks eject host eggs and chicks
counteradaptation: host species have evolved rejection of eggs unlike their own
Counter-counter adaptation: Cuckoos have evolved egg mimicry (or not, in case of dunnock)
relationship w other vertically-inherited symbionts
dung beetles carry symbiotic nematodes on their genitalia
these nematodes are sexually transmitted
transmit from mother to offspring
presence of nematodes benefits larval growth
not all beetles carry nematodes in the wild (10-50% depending on population)
the genital worms of dung beetles are an example of a sexually transmitted mutualist
what defines males and females?
sexes are defined by gamete size
isogamy
gametes are same size, so no males and females (found in some algae and protists).
• In these cases, we talk about +/- mating types
• Usually, mating types are incompatible with their own mating type
• Common in most unicellular eukaryotes, many fungi, and green algae
Mushrooms are especially weird and some species have thousands of mating types
anisogamy
Males produce large numbers of small, energetically cheap, and more motile gametes, females produce small numbers of large, energetically expensive, and less motile gametes
universal in most sexually reproducing multicellular plants and all multicellular animals
hermaphrodites
individuals capable of producing both eggs and sperm (both small and large gametes).
bluehead wrasse: large females develop into males
primary sexual characteristics:
genitalia, large or small gametes, gametes, eggs
sequential hermaphrodites:
individuals capable of switching from egg to sperm production (or other way around)
ex: clownfish, large males develop into females
sex: biological
biological classification based on gamete type and reproductive anatomy
typically defined by the production. of
large gametes (eggs)/female
small gametes (sperm)/male
sex determination can be genetic or environmental, can also change over time and sometimes individuals are both simultaneously (hermaphrodites)
we often study: chromosomes, gametes, reproductive success, mate competition
gender (social)
a social and cultural category related to identity, roles, expression, and expectations
well-studied in humans
studied in sociology, psychology, anthroplogy
researchers often study: identity, gender roles, cultural norms, expression
genome organization - distinguishing the sexes
chromosomes
Y chromosome (SRY, sex-determing region Y] gene)
sexes often differ in karyotype
but: sex chromosomes are not needed for having separate sexes
many species have environmental sex determination
secondary sexual characteristics - distinguishing the sexes
coloration
anatomy
behavior
characteristics
risk strategies
social parameters
sexes often differ in phenotype
but sometimes its REALLY hard to tell
no general secondary sexual feature to distinguish males from females
primary sexual characters:
are characters unique to one sex that are essential for reproduction.
secondary sexual characters
are characters unique to one sex that are not essential for reproduction: bright plumes, behavioral displays, antlers etc
sex & asymmetries
There are differences in parental investment:
1) Gamete production: individual eggs are “expensive,” individual
sperm are “cheap;” in almost all species, more sperm than eggs are
produced (so per zygote investment greater for females, by
definition).
2) Parental care: cost of bearing (pregnancy) & raising offspring;
variable, but often greater for females.
3) Reproductive Success: females are limited by resources (usually)
while males are limited by access to females (usually).
bateman gradient
variability in reproductive success (or reproductive variance) is greater in males than in females

costs of sexual repro/benefits of asexual repro:
• Asexual females produce twice as many (childbearing) offspring as sexual females
• Asexual reproduction has a massive fitness advantage
why do we use sexual repro:
• Recombination!
• By mixing the genes of two individuals, unique genetic combinations are created which can increase the likelihood of some individuals surviving changing or challenging environments.
• This is so beneficial that it outweighs the costs of producing males