biostatistics chapter 6
 Call Kai
 Learn
 Practice Test
 Spaced Repetition
 Match
 Flashcards
 Knowt Play
1/33

There's no tags or description
Looks like no tags are added yet.
34 Terms
hypothesis testing
Like estimation, uses sample data to make inferences about the population from which the sample was taken.
Unlike estimation, however, which puts bounds on the value of a population parameter, hypothesis testing asks only whether the parameter differs from a specific “null” expectation.
Estimation asks, “How large is the effect?”
Hypothesis testing asks, “Is there any effect at all?”
How to think about a Null hypothesis
The Null hypothesis (H0):The defendant is innocent.
We assume this is true at the start.
The Alternative Hypothesis (HA): The defendant is guilty. This is what the prosecution (the researcher) is trying to prove.
The Evidence: The data collected.
The Verdict: We don't "prove" innocence; we simply find the defendant "not guilty" due to lack of evidence. Similarly, we "fail to reject" the null.
Null hypothesis
The null hypothesis is a specific statement about a population parameter made for the purposes of argument.
A good null hypothesis is a statement that would be interesting to reject
“default” hypothesis that has an interest of zero
e.g., no effect, no preference, no correlation, no difference
• Abbreviated as H0
• Null hypothesis (H0):The defendant is innocent.
• We assume this is true at the start.
Alternative Hypothesis
The alternative hypothesis includes all other feasible values for the population parameter besides the value stated in the null hypothesis
Includes possibilities that are biologically interesting
e.g., there IS an effect, preference, correlation, difference
• Abbreviated as HA
• (HA): The defendant is guilty.
Reject H0 or not
The H0 is what is being tested
If data are consistent with H0 then you “fail to reject” it
If data are inconsistent with H0 then you reject it
“rule out” the null hypothesis
You do not “prove” the HA, you can only “reject” or “fail to reject” the H0
Example: Null hypothesis
Tested whether individual toads prefer to use one forelimb over another (display “handedness”)
what is the H0 and HA
Question: Do right- and left-handed toads differ in frequency?
H0: Right and left-handed toads are equally frequent
…or H0: pR = pL
…or H0: pR = 0.5
…or H0: pL = 0.5
We will use: H0: pR = 0.5
H0: pR = 0.5
There are two alternative possibilities: pR < 0.5 and pR > 0.5
In a two-sided (or two-tailed) test, the alternative hypothesis includes parameter values on both sides of the parameter value specified by the null hypothesis
HA: pR ≠ 0.5

Two-sided (or two-tailed) test
In a two-sided (or two-tailed) test, the alternative hypothesis includes
parameter values on both sides of the parameter value specified by the
null hypothesis
P-Value
P-value is the probability of obtaining the data (or data showing as
great or greater difference from the null hypothesis) given that the null
hypothesis is true
The p-value answers the question:
What is the probability of obtaining a value as extreme as the # observed (or more extreme) assuming the null hypothesis is true?
In a two-sided test, this means
a value at the # or more
or an equally extreme result on the other side of the distribution

Test statistic
The test statistic is the value calculated from the data to evaluate
compatibility with the null hypothesis.
Why can we not immediately reject H0
Samples are subject to random error
Even if the null hypothesis is true, we may observe values different from the expectation by chance
The key question is not:
Is 14 different from 9?
The real question is:
Is 14 sufficiently different from 9, given the null distribution, to reject the null hypothesis?
We use the P-value to help us with this:
The P-value is the probability of obtaining the data (or data showing as great or greater difference from the null hypothesis) given that the null hypothesis is true
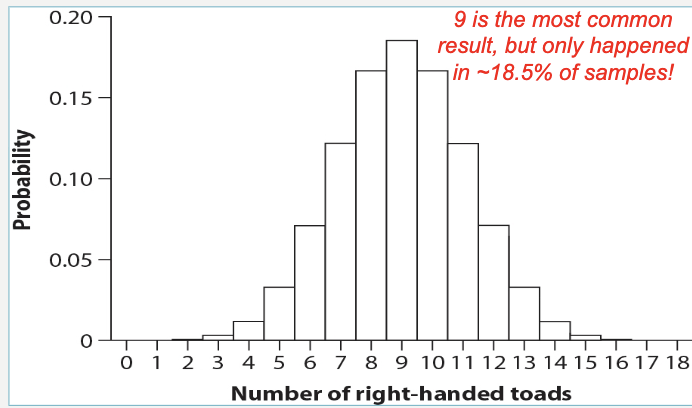
Null distribution
The null distribution is the sampling distribution of the test statistic assuming the null hypothesis is true.
This distribution tells us:
•How much variation we expect by chance alone
•How likely values are under H0

Significance level
The significance level, α ( = 0.05), is a probability used as a criterion for rejecting the null hypothesis.
If the P-value is less than or equal to α, then the null hypothesis is rejected.
If the P-value is greater than α, then the null hypothesis is not rejected.
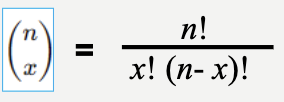
Binomial distribution
equation for solving for probability when there are many trials

Example: Null hypothesis
Number of toads sampled: 18
Number of right-handed toads observed: 14
In this study, 18 toads were sampled and 14 were observed to be right-handed
a) What is the test statistic?
b) what do we expect if H0 is true
c) what does the null distribution tell us
d) What does the p-value tell us about the data? Calculate the P-value
a) The test statistic is the value calculated from the data to evaluate compatibility with the null hypothesis.
In this study, 18 toads were sampled and 14 were observed to be right-handed
In this case the test statistic is 14 (or pR = 14/18 = 0.7778)
b) If H0 is true: E (X) = n X p = 18 x 0.5 = 9
Observed: 14 right-handed toads
This does not immediately reject H0
c) Here: X ∼ Binomial (n=18, p=0.5)
This distribution tells us:
how much variation we expect by chance alone
How likely values like 14 are under H0
d) P value tells us what the probability of obtaining a value as extreme as 14 — or more extreme — assuming the null hypothesis is true
Because this is a two-sided test, “as extreme as 14” means:
14 or more right-handed toads
or an equally extreme result on the other side of the distribution


Example: Binomial/Null distribution
Number of toads sampled: 18
Number of right-handed toads observed: 14
In this study, 18 toads were sampled and 14 were observed to be right-handed
What is the p-value, use binomial distribution?
take the range from 14 to 18 and do a binomial distribution for each
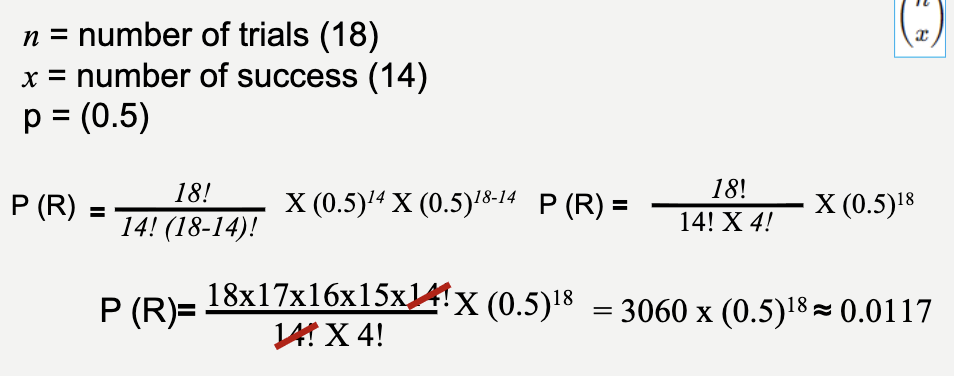
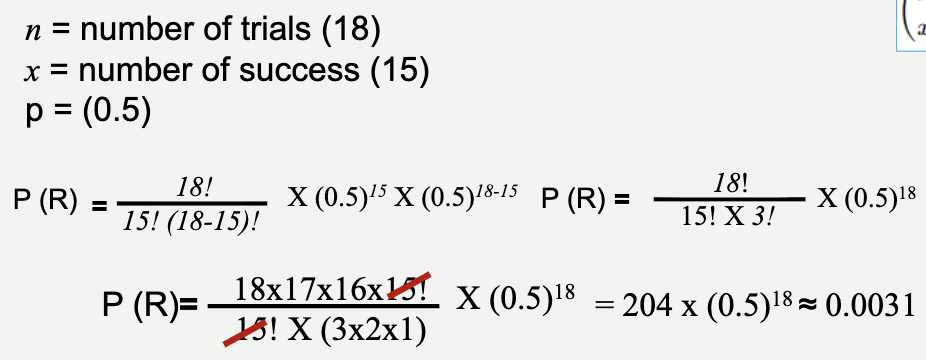


Calculate the P-value by adding all these values together
Multiply by 2 because this is a two-sided distribution

This means:
There is a 3.1% chance of the observed data given that the null hypothesis is true
The significance level, α ( = 0.05), is a probability used as a criterion for rejecting the null hypothesis.
Here, the P-value is less than alpha so the null hypothesis is rejected.
Example: P-value using table
Number of toads sampled: 18
Number of right-handed toads observed: 14
In this study, 18 toads were sampled and 14 were observed to be right-handed
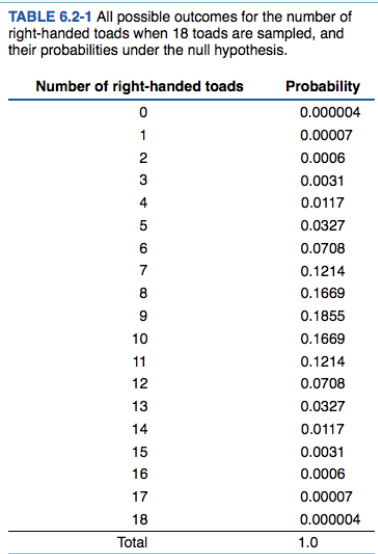
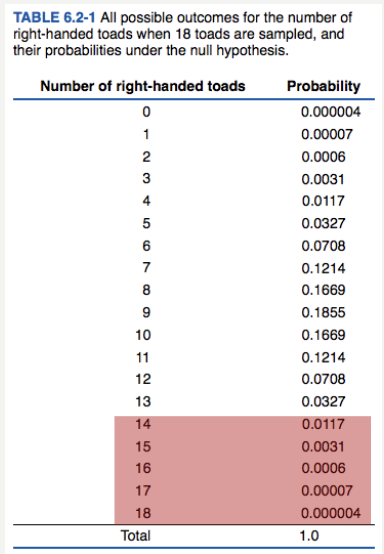
Observations of 0, 1, 2, 3, etc. right- handed toads are mutually exclusive
So sum the probabilities of getting values as extreme as 14
Pr[14 or more right-handed] = Pr[14] + Pr[15] + Pr[16] + Pr[17] + Pr[18]
Pr[14 or more right-handed] = 0.0155
But test is two-sided, so you need to also account for getting values as extreme in the other direction (i.e., values ≤ 4)
Quickest way to calculate is to multiply Pr[14 or more right-handed] by 2 if distribution is perfectly symmetric
P = 0.0155 x 2 = 0.031
Error in hypothesis testing
Type I error is rejecting a true null hypothesis.
The significance level α sets the probability of committing a Type I error.
Type II error is failing to reject a false null hypothesis.
The power of a test is the probability that a random sample will lead to rejection of a false null hypothesis

Example: Genetics of mirror image flowers
Most flowering plants are hermaphrodites, with flowers that include female (style) and male (anther) reproductive organs
To avoid self-fertilization, some species have mixture of right and left “handed” flowers
Study of genetics of this trait
Produce pure strains right/left individuals
Crossing pure strain of left X pure strain of right produced all right-handed offspring
Crossed these offspring and expected 1:3 of left : right F2 under simple model of inheritance

a) What is the H0
b) What is the HA
c) What is the test statistic of a study that resulted in a sample of 27 offspring with 6 that were left handed?
d) How would you find the null distribution (binomial)
e) Calculate the p-value using the binomial distribution, is the null hypothesis rejected?
a) H0: left and right-handed offspring occur at 1:3 ratio
H0: pL = 0.25
b) HA: left and right-handed offspring do not occur at 3:1
HA: pL ≠ 0.25
c) Study resulted in sample of 27 offspring with 6 that were left handed
Test statistic: pL = 6/27 = 0.222
d) P(num left ≤ 6) = P(6)+P(5)+P(4)…P(0)

e)

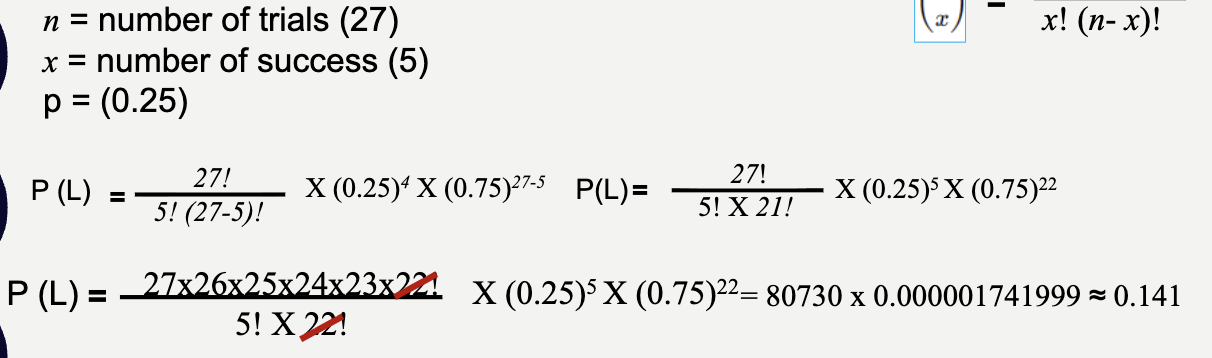

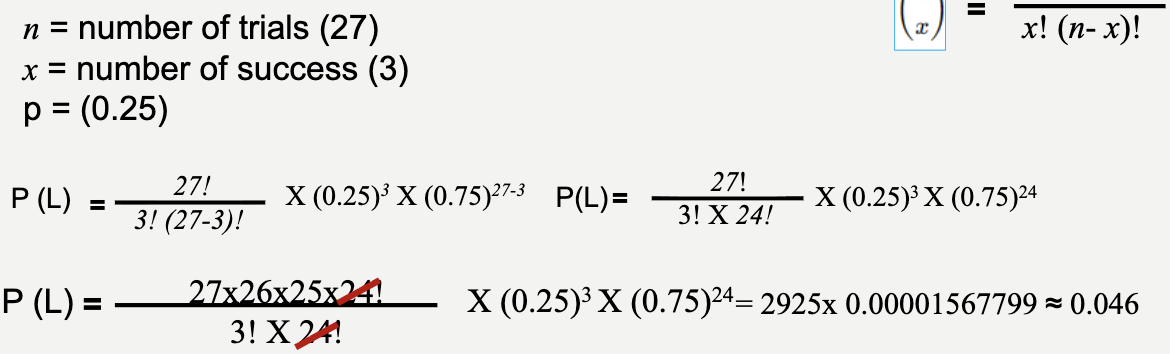
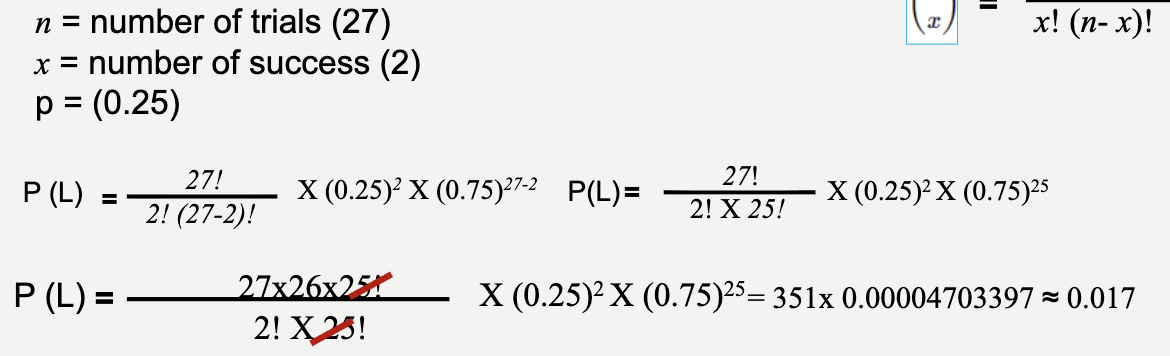


P-value

There is a 94.4% probability of the observed data given that the null hypothesis is true
Data are compatible or consistent with the null hypothesis
“Fail to reject” the null hypothesis
One-sided (one tailed) test
In a one-sided (or one-tailed) test, the alternative hypothesis includes parameter values on only one side of the value specified by the null hypothesis
H0 is rejected only if the data depart from it in the direction stated by HA
In practice one-sided tests are used sparingly

Example: One sided test
Example: Candy Preference Test, a researcher claims that students prefer dark chocolate over milk chocolate. He randomly give 8 students a choice.
• Hypothesis:
• H0: p = 0.5 (no preference – just random)
• HA: p > 0.5 (students prefer dark chocolate)
Notice: Only greater matters -> one-sided test
Solve for p-value using binomial distribution if 7 out of 8 students choose dark chocolate.


There is a 3.5% chance of the observed data given that the null hypothesis is true
Reject the null hypothesis
Example: quiz vs. test performance
Research Question: We expected that at least 80% of students who scored ≥90% on the quizzes would also score ≥90% on the exam.
p = proportion of high-quiz students who also achieve ≥90% on the exam.
Null Hypothesis (H₀): p≥0.80
Alternative Hypothesis (H₁): p<0.80
This is a left-tailed binomial test.
Solve for the p-value


Statistical Evidence
Exact binomial test:
p=0.0138 Since: p<0.05p
We reject the null hypothesis.
When to use one sided vs. two sided hypothesis test
When the hypothesis says less than or greater than, it is one-sided
Less = left-tailed
Greater = right-tailed
When the hypothesis says something is different = two-sided
How to detect a stronger association based on the P-Value
When the p-value is really low
for example, a p-value of 0.0002
To make a p-value more reliable:
Need to have a representative sample
A large sample size
With borderline p-values like 0.49, you need to be careful what you are suggesting and what statements you are making about what you found
A good limitations section in a research paper can show if they were careful about this
Hypothesis testing example: marshmallow test
It was believed that delayed gratification predicted future success. People believed and cited the original study for over 50 yrs
Not measuring willpower, measuring whether the children thought the adults would keep their promises
Predicted by socioeconomic background
If a promise was broken before the experiment, they didn't wait as long
Hypothesis of original study:
The researchers hypothesized that children who were able to delay gratification for longer in preschool would show better cognitive, academic, and self-regulatory outcomes later in adolescence.
1) What should the null hypothesis (H0) be?
2) What should the alternative hypothesis (Ha) be?
3) Considering the possible confounders, how could the original hypothesis have been formulated more appropriately?
What should the null hypothesis (H₀) be?
H₀: There is no association between the amount of time a child delays gratification in preschool and their later cognitive/academic outcomes.
Statistically: ρ = 0
What should the alternative hypothesis (Hₐ) be?
Hₐ: Children who delay gratification longer have better later cognitive/academic outcomes.
Statistically: ρ > 0
More appropriate:
H₀: After accounting for potential confounders, such as family background, early cognitive ability, and the home environment, there is no association between preschool delay of gratification and later academic achievement.
Hₐ: After accounting for potential confounders, such as family background, early cognitive ability, and the home environment, longer preschool delay of gratification is associated with higher later academic achievement.
Need to be critical of this kind of thing in studies (what is there method, confounding variables). Confounders must be associated with the outcome and the exposure
Example: Hypothesis testing —> frog color
In a species of frogs, 50% are expected to be green. A researcher samples 24 frogs and finds 16 green. Formulate H₀ and HA. Indicate whether the test is one-sided or two-sided. Perform the appropriate hypothesis test, report the p-value, and state your conclusion at α=0.05.
H0: p(green frogs) = 0.5
HA: p(green frogs) ≠ 0.5
p-value = 0.152
Test: Two-sided
There is a 15.2% chance of observing these results (or more extreme) if the null hypothesis is true. Since is greater than α = 0.05, we fail to reject the null hypothesis.
Example: Hypothesis testing —> Coin bias
A coin is believed to land heads 50% of the time. A student suspects it lands heads more often than 50%. The student flips the coin 40 times and observes 26 heads. Formulate H₀ and HA. Indicate whether the test is one-sided or two-sided. Perform the appropriate hypothesis test, report the p-value, and state your conclusion at α=0.05.
H0: p(heads) = 0.5
HA: p(heads) > 0.5
P-Value = 0.040
Test: One-sided (right-tailed)
There is a 4.0% chance of observing these results (or more extreme) if the null hypothesis is true. Since is lower than α = 0.05, we reject the null hypothesis.
Example: Hypothesis testing —> Mendelian trait
According to Mendelian inheritance, the recessive phenotype is expected to occur in 25% of offspring. A researcher wants to evaluate whether the observed data are consistent with this Mendelian expectation. In a sample of 36 offspring, 14 display the recessive trait. Formulate H₀ and HA. Indicate whether the test is one-sided or two-sided. Perform the appropriate hypothesis test, report the p-value, and state your conclusion at α=0.05
H0: p(recessive trait) = 0.25
HA: p(recessive trait) ≠ 0.25
Test: Two-sided
P-value = 0.080
There is an 8.0% chance of observing these results (or more extreme) if the null hypothesis is true. Since is greater than α = 0.05, we fail to reject the null hypothesis.
Example: Hypothesis testing —> Vaccine side effects
It is claimed that 30% of people develop mild side effects from a vaccine. A researcher wants to test whether the true proportion is less than 30%. He follows 50 individuals, and 10 develop mild side effects. Formulate H₀ and HA. Indicate whether the test is one-sided or two-sided. Perform the appropriate hypothesis test, report the p- value, and state your conclusion at α=0
H0: p(side effects) = 0.30
HA: p(side effects) < 0.30
Test: One-sided (left-tailed)
P-value = = 0.079
There is a 7.9% chance of observing these results (or more extreme) if the null hypothesis is true. Since is greater than α = 0.05, we fail to reject the null hypothesis.
Example: Hypothesis testing —> Hand Preference
It is believed that 85% of individuals are right-handed. A researcher wants to evaluate whether the true proportion of right-handed individuals differs from that. In a sample of 22 individuals, 16 are right-handed. Formulate H₀ and HA. Indicate whether the test is one-sided or two- sided. Perform the appropriate hypothesis test, report the p-value, and state your conclusion at α=0.05.
H0: p(right-handed) = 0.85
HA: p(right-handed) ≠ 0.85
Test: Two-sided
P-Value = 0.128
There is a 12.8% chance of observing these results (or more extreme) if the null hypothesis is true. Since is greater than α = 0.05, we fail to reject the null hypothesis.
Example: Hypothesis testing —> Seed germination
Historically, 80% of seeds germinate. A farmer wants to evaluate whether the new batch has a lower germination rate. He plants 30 seeds, and 10 germinate. Formulate H₀ and HA. Indicate whether the test is one-sided or two-sided. Perform the appropriate hypothesis test, report the p- value, and state your conclusion at α=0.05.
H0: p(seeds germinate) = 0.80
HA: p(seeds germinate) < 0.80
Test: One-sided (left-tailed)
P-value = 0.0002
There is a 0.02% chance of observing these results (or more extreme) if the null hypothesis is true. Since is lower than α = 0.05, we reject the null hypothesis.
Example: Hypothesis testing —> Defective products
A company claims that only 5% of its products are defective. A customer suspects that the defect rate is higher. She randomly inspects 80 products and finds 9 defective. Formulate H₀ and HA. Indicate whether the test is one-sided or two-sided. Perform the appropriate hypothesis test, report the p- value, and state your conclusion at α=0.05.
H0: p(defective products) = 0.05
HA: p(defective products) > 0.05
Test: One-sided (right-tailed)
P-Value = 0.018
There is a 1.8% chance of observing these results (or more extreme) if the null hypothesis is true. Since is lower than α = 0.05, we reject the null hypothesis.
Example: Hypothesis testing —> Blood type
It is believed that 40% of the population has blood type O. A researcher wants to evaluate whether the true proportion differs from 0.40. She randomly samples 50 individuals, and 14 have blood type O. Formulate H₀ and HA. Indicate whether the test is one-sided or two-sided. Perform the appropriate hypothesis test, report the p-value, and state your conclusion at α=0.
H0: p(blood type O) = 0.40
HA: p(blood type O) ≠ 0.40
Test: Two-sided
P-value = 0.111
There is an 11.1% chance of observing these results (or more extreme) if the null hypothesis is true. Since is greater than α = 0.05, we fail to reject the null hypothesis.
Example: Hypothesis testing —> Plant trait
A trait is expected to appear in 75% of plants. A biologist wants to evaluate whether the observed proportion is lower than 0.75. She examines 28 plants, and 12 display the trait. Formulate H₀ and HA. Indicate whether the test is one-sided or two-sided. Perform the appropriate hypothesis test, report the p-value, and state your conclusion at α=0.05.
H0: p(trait) = 0.75
HA: p(trait) < 0.75
Test: One-sided (left-tailed)
P-value = 0.0003
There is a 0.03% chance of observing these results (or more extreme) if the null hypothesis is true. Since is lower than α = 0.05, we reject the null hypothesis.
Example: Hypothesis testing —> Smoking rate
A public health report states that 18% of adults smoke. A researcher believes that the smoking rate has increased above 18% in the past year. She surveys 120 adults, and 30 report that they smoke. Formulate H₀ and HA. Indicate whether the test is one-sided or two-sided. Perform the appropriate hypothesis test, report the p-value, and state your conclusion at α=0.05.
H0: p(smoke prevalence) = 0.18
HA: p(smoke prevalence) > 0.18
Test: One-sided (right-tailed)
P-value = 0.034
There is a 3.4% chance of observing these results (or more extreme) if the null hypothesis is true. Since is lower than α = 0.05, we reject the null hypothesis.