Business Analytics Exam 1
 Call Kai
 Learn
 Practice Test
 Spaced Repetition
 Match
 Flashcards
 Knowt Play
1/23

There's no tags or description
Looks like no tags are added yet.
24 Terms
observation
row of data
multicollinearity
strong correlation between 2 independent variables
residual
observed minus predicted, error, what was gotten wrong
first step of data mining
Purpose
second step of data mining
Obtain
third step of data mining
Clean
fourth step of data mining
Build
fifth step of data mining
Evaluate
sixth step of data mining
Deploy
If p ≤ α
reject null hypothesis
Contingency tables
used to study relationship between two or more categorical variables
normality
means that leftover errors (residuals) will represent bell shaped curve centered at 0

independence
means that leftover error for one data point has no relationship to another
constant variance
messiness of leftover errors is represented everywhere
Distinctive Capabilities
integrated business processes and capabilities that together serve customers in different ways from competitiors
R2
coefficient of determination, measures how much of the ups and downs (variation) in one thing (dependent) can be explained or predicted by another thing (independent) (ranges from 0 to 1)
nominal variable
label, category, not having a numerical value (favorite color or type of pet you have)
data partitioning
dividing data into subsets of training and validation
histogram
graph that shows how often numbers fall into specific groups or ranges (0-10, 11-20, etc.), looks like spectrum analyzer soundwave visual almost

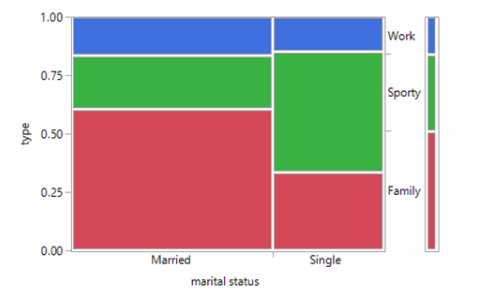
mosaic
a graphical visualization of a contingency table that displays the relationship between two or more categorical or ordinal variables
box plot
a simple way to summarize a long list of numbers using just five key points
