Principles of Macroeconomics Midterm #1
 Call Kai
 Learn
Learn Practice Test
 Spaced Repetition
 Match
Match Flashcards
 Knowt Play
1/65

Earn XP
Description and Tags
everything from the study guide, also do practice quizzes and stuff!!!
Name | Mastery | Learn | Test | Matching | Spaced | Call with Kai | Chat |
|---|
No analytics yet
Send a link to your students to track their progress
66 Terms
What does economics study?
The study of how society manages its scarce resources
What is scarcity?
The limited nature of society’s resources (society has limited resources and cannot produce all the goods & services people wish to have)
How does a rational decision maker behave?
Rational people make decisions by evaluating costs and benefits of marginal
changes. (Rational people think at the margin) (you want marginal benefit to exceed marginal cost)
- Marginal means “extra” or “additional”
- Marginal changes: small incremental adjustments to a plan of action
- Marginal benefit (MB): addition benefit of a plan of action
- Marginal cost (MC): addition cost of a plan of action
What is invisible hand?
A metaphor for the unseen forces that move the free market economy (self-interest, supply and demand, etc.)
(ex: A baker sells bread to make money (self-interest), but customers get bread they want (greater benefit)
What is a market economy?
An economic system where the production and allocation of goods & services are determined by the interactions of buyers and sellers in a market. The behaviors of both buyers and sellers are driven by their own self-interest. (from answer key)
(from slides: firms produce goods & services that meet the wants of customers)
Role of government
Government intervention can sometimes improve market outcomes or intervene if needed (ex: Great Depression, 2007-2008 housing crisis, etc.)
ex: national defense, law & order, can impose taxes on firms with negative environmental impact, etc.)
Calculate oppurtunity cost
In simple terms, it is the value or profit you miss out on when you choose one path over another. It is calculated by subtracting the return of your chosen option from the return of the best alternative option you passed up.
ex: A student spends three hours and $20 at the movies the night before an exam. The oppurtunity cost is time spent studying and that money to spend on something else.
What is the role of assumptions?
Models have to be simplified to be useful. Assumptions are simplifications!
Behavior assumptions about the motives of consumers and firms – Self-interest.
Consumers: maximize their own satisfaction or well-being
Firms: maximize profits
What are the two markets in a circular-flow diagram?
Two markets: Markets for goods & services and Markets for factors of production
Who is the buyer and seller in the product market? (circular-flow diagram)
Goods & services are bought and sold
Households=buyers, Firms=sellers
Who is the buyer and seller in the factor market? (circular-flow diagram)
Inputs are bought and sold (land, labor, capital)
Firms=buyers, Households=sellers
Microeconomics
*must be able to determine whether a topic is micro/macro
The study of how households make choices, how they interact in markets, and how the government attempts to influence their choices
Macroeconomics
*must be able to determine whether a topic is micro/macro
The study of the economy as a whole, including topics such as inflation, unemployment, and economic growth
Law of demand
Demand: Price ↑ → Quantity Demanded ↓ (downward slope: ↘)
When price goes up, quantity demanded goes down; when price goes down, quantity demanded goes up. (holding everything else constant)
Ex: If pizza goes from $10→$15, people will generally buy fewer pizzas
Factors that shift the demand curve
Shifts in the demand curve are caused by changes in:
• Income
• Prices of related goods
• Tastes
• Expectations about future prices
• Population and Demographics (age, race, gender, etc.)
What happens when demand increases?
Demand shifts right → Price ↑ and Quantity ↑
What happens when demand decreases?
Demand shifts left → Price ↓ and Quantity ↓.
Law of supply
Supply: Price ↑ → Quantity Supplied ↑ (upward slope:↗)
When price goes up, quantity supplied goes up; when price goes down, quantity supplied goes down. (holding everything else constant)
Ex: If pizza prices rise from $10→$15, restaurants will generally want to make more pizza
Factors that shift the supply curve
Prices of inputs
Inputs are things used in the production of a good or service
Example: for an athletic shoe, the inputs would be rubber, plastic, and labor
An Increase in input prices
Makes the production less profitable at each output price
Firms supply a smaller quantity at each price: the supply curve shifts to the left (a decrease in supply)
A decrease in input prices increases the profitability of selling the good, causing an increase in supply.
What happens when supply increases?
Supply shifts right → Price ↓ and Quantity ↑.
What happens when supply decreases?
Supply shifts left → Price ↑ and Quantity ↓.
What is shortage?
When quantity demanded > quantity supplied. There aren't enough goods for everyone who wants them.
How does a shortage affect market prices?
Shortage → prices tend to rise because buyers compete for limited goods, and sellers realize they can raise prices while selling the same quantity
What is surplus?
When quantity supplied > quantity demanded. Sellers have more goods than consumers want to buy.
How does a surplus affect market prices?
Surplus → prices tend to fall because sellers lower prices to attract buyers and compete with other sellers.
Market Equilibrium
Market equilibrium is a situation in which quantity demanded equals quantity supplied. (no surplus or shortages)
What is demand shock?
An unexpected event that shifts the demand curve.
Example of positive demand shock
A sudden spike in demand. This shifts the demand curve to the right, causing shortages and higher prices because suppliers cannot make goods fast enough.
(Consumers suddenly want more of a product → Demand ↑ → Price ↑, Quantity ↑.)
Example of negative demand shock
A sudden drop in demand. This shifts the demand curve to the left, causing a surplus and lower prices because too many items remain unsold.
(Consumers suddenly want less → Demand ↓ → Price ↓, Quantity ↓.
What is a supply shock?
An unexpected event that shifts the supply curve.
Example of positive supply shock?
An event that unexpectedly increases availability or lowers production costs.
(Better technology makes production easier → Supply ↑ → Price ↓, Quantity ↑)
Example of negative supply shock?
An event that abruptly decreases supply or raises production costs.
(A drought reduces crops → Supply ↓ → Price ↑, Quantity ↓)
What happens when demand and supply both increase?
Quantity definitely ↑, but the effect on price is uncertain
What happens when demand and supply both decrease?
Quantity definitely ↓, but the effect on price is uncertain
What happens when demand ↑ and supply ↓?
Price definitely ↑, but the effect on quantity is uncertain
What happens when demand ↓ and supply ↑?
Price definitely ↓, but the effect on quantity is uncertain
What is Gross Domestic Product (GDP)?
The market value of all final goods & services produced in a country during a given period
Who measures GDP? How often does the agency report GDP data?
Bureau of Economic Analysis (BEA) reports GDP data every 3 months (quarterly)
Whats left out of GDP?
Financial Transactions
Shift of money from one person to another; no new production
Example: purchasing stocks from the stock market (transfer of ownership) is NOT included in GDP
Illegal activities: prostitution and sales of illegal drugs
Used goods
GDP includes currently produced goods, not goods produced in the past.
The four components of GDP
• Consumption (C)
• Investment (I)
• Government Purchases (G)
• Net Exports (NX)
These components add up to GDP (denoted Y): Y = C + I + G + NX
Consumption (C)
Consumption is spending by households on goods and services, not including spending on new houses (which are counted instead in investment)
In BEA statistics, consumption is further divided into expenditure on
Services (medical care, haircuts, education, etc.)
Nondurable Goods (food, clothing, gas, etc.) (items that typically last under three years)
Durable Goods (automobiles, furniture, jewelry, etc.) (Items that typically last over three years and resist quick wear and tear)
Investment (I)
Investment is spending by firms on new factories, office buildings, machinery, and additions to inventories, plus spending by households and firms on new houses.
The BEA measures the following categories of investment:
Business investment (business capital), such as new factories, office buildings, and machinery.
Residential investment, i.e. new single-family and multi-unit houses.
Changes in business inventories, i.e. goods that have been produced but not yet sold.
*NOTE: investment does not mean purchasing stocks and bonds like it does in finance
Government Purchases (G)
All spending on the goods and services purchased by the government (federal, state, and local)
This includes wages of public school teachers, spending on highways, military bases, and national defense.
note: Excludes Transfer payments such as social security or unemployement insurance benefits
Net Exports (NX)
Net exports, NX = exports – imports
• Exports: Goods/services produced domestically and sold to other countries → added to GDP
• Imports: Goods/services produced in other countries and bought domestically → subtracted from GDP
Easy way to remember the four GDP components + examples
Ask who is doing the spending?
Household → Consumption
ex: You buy a new laptop → Consumption
Business buying capital → Investment
ex: Apple builds a new factory → Investment
Government → Government spending
ex: The government builds a bridge → Government spending
Foreign buyers/domestic buyers → Net exports
ex: The U.S. sells wheat to Japan → Export → Net exports
ex: The U.S. buys cars made in Japan → Import → Net exports (subtracts from GDP)
What are transfer payments and government compensation? Are they considered under
a country’s GDP? Why/why not?
Transfer payments and government compensation is when the government gives individuals or group money and/or benefits without receiving any goods, services, or outputs in exchange (ex: social security, welfare programs, unemployement insurance, etc.)
Not considered under GDP: Transfer payments do not represent current production or economic output. They are merely a redistribution of existing tax revenue from one group of citizens to another. Counting them in GDP would result in double-counting
Nominal GDP
GDP measured using current-year prices
A change in nominal GDP reflects both prices and quantities.
Real GDP
GDP measured using base-year prices
The change in real GDP is the amount that GDP would change if prices were constant (i.e., if zero inflation)
Real GDP is corrected for inflation
Real GDP growth is true economic growth
GDP Deflator
A measure of the price level, Measures the current level of prices relative to the level of
prices in the base year

Economy’s inflation rate (GDP)
Compute the percentage increase in the GDP deflator from one year to the next

Remember: You're measuring the percentage change in the GDP deflator, not just subtracting the two numbers.
What does a change in the GDP deflator reflect?
An increase in the GDP deflator means the overall price level has increased → inflation.
A decrease means the overall price level has decreased → deflation.
What is Gross National Product (GNP)?
the value of all final goods and services produced by a country's citizens/nationals, regardless of where they produce them.
GNP vs. GDP
Main difference:
GDP → location of production
GNP → nationality/ownership of the producers
Example:
A U.S.-owned company produces something in Japan → counts toward U.S. GNP, but Japanese GDP.
A Japanese-owned company produces something in the U.S. → counts toward U.S. GDP, but Japanese GNP.
A useful way to remember it:
GDP = “Produced here”
GNP = “Produced by our people”
Calculate the growth rate of real GDP
Measures a percentage change in inflation-adjusted economic output between two specific periods

result should be a percentage (ex: 5% growth rate)
What does the level of real GDP per person measure?
Real GDP per capita = ”per person”
Main indicator of the average person’s standard of living

Real GDP distinctions
Real GDP → size of the economy
Real GDP growth rate → how quickly the economy is growing
Real GDP per person → average economic output per person / rough measure of living standards
Is GDP a perfect measure of the well-being of a society? Is GDP still useful?
GDP is a good measure of economic well-being for most—but not all—purposes. It is not perfect, but it’s still very useful.
GDP does not value:
Quality of the environment (negative effects of production)
Leisure time
Non-market activity
childcare a parent provides at home
volunteer work
An equitable distribution of income
What were the U.S. nominal GDP and real GDP in the second quarter of 2026? (MEMORIZE BOTH IN TRILLIONS!!!)
Nominal GDP in Q2 of 2026: $32.6 trillion ($32,563.030 billion on FRED)
Real GDP (base year 2017) in Q2 of 2026: $24.4 trillion ($24,408.011 billion on FRED)
Market Basket
A market basket is a collection of goods and services that represents what a typical consumer purchases. (ex: gasoline, car insurance, garbage collection, etc.)
How does inflation affect the purchasing power of money?
Inflation decreases the purchasing power of money.
Purchasing power = how much goods and services your money can buy.
Inflation ↑ → purchasing power ↓
Inflation ↓ → purchasing power ↑
Example: If $100 could buy 20 items last year but only 18 items this year, your $100 has less purchasing power.
How is a market basket constructed? (also how CPI is calculated im p sure??)
The Bureau of Labor Statistics (BLS) surveys consumers to determine what they buy and how much they buy.
It selects a fixed set of goods and services.
Each item is given a weight based on how much consumers spend on it.
The prices of those items are then tracked over time.
Key idea: The market basket represents typical consumer spending.
Formula to compute CPI
CPI=[Basket’s cost in current year / Basket’s cost in base year] X 100
How inflation is calculated using CPI
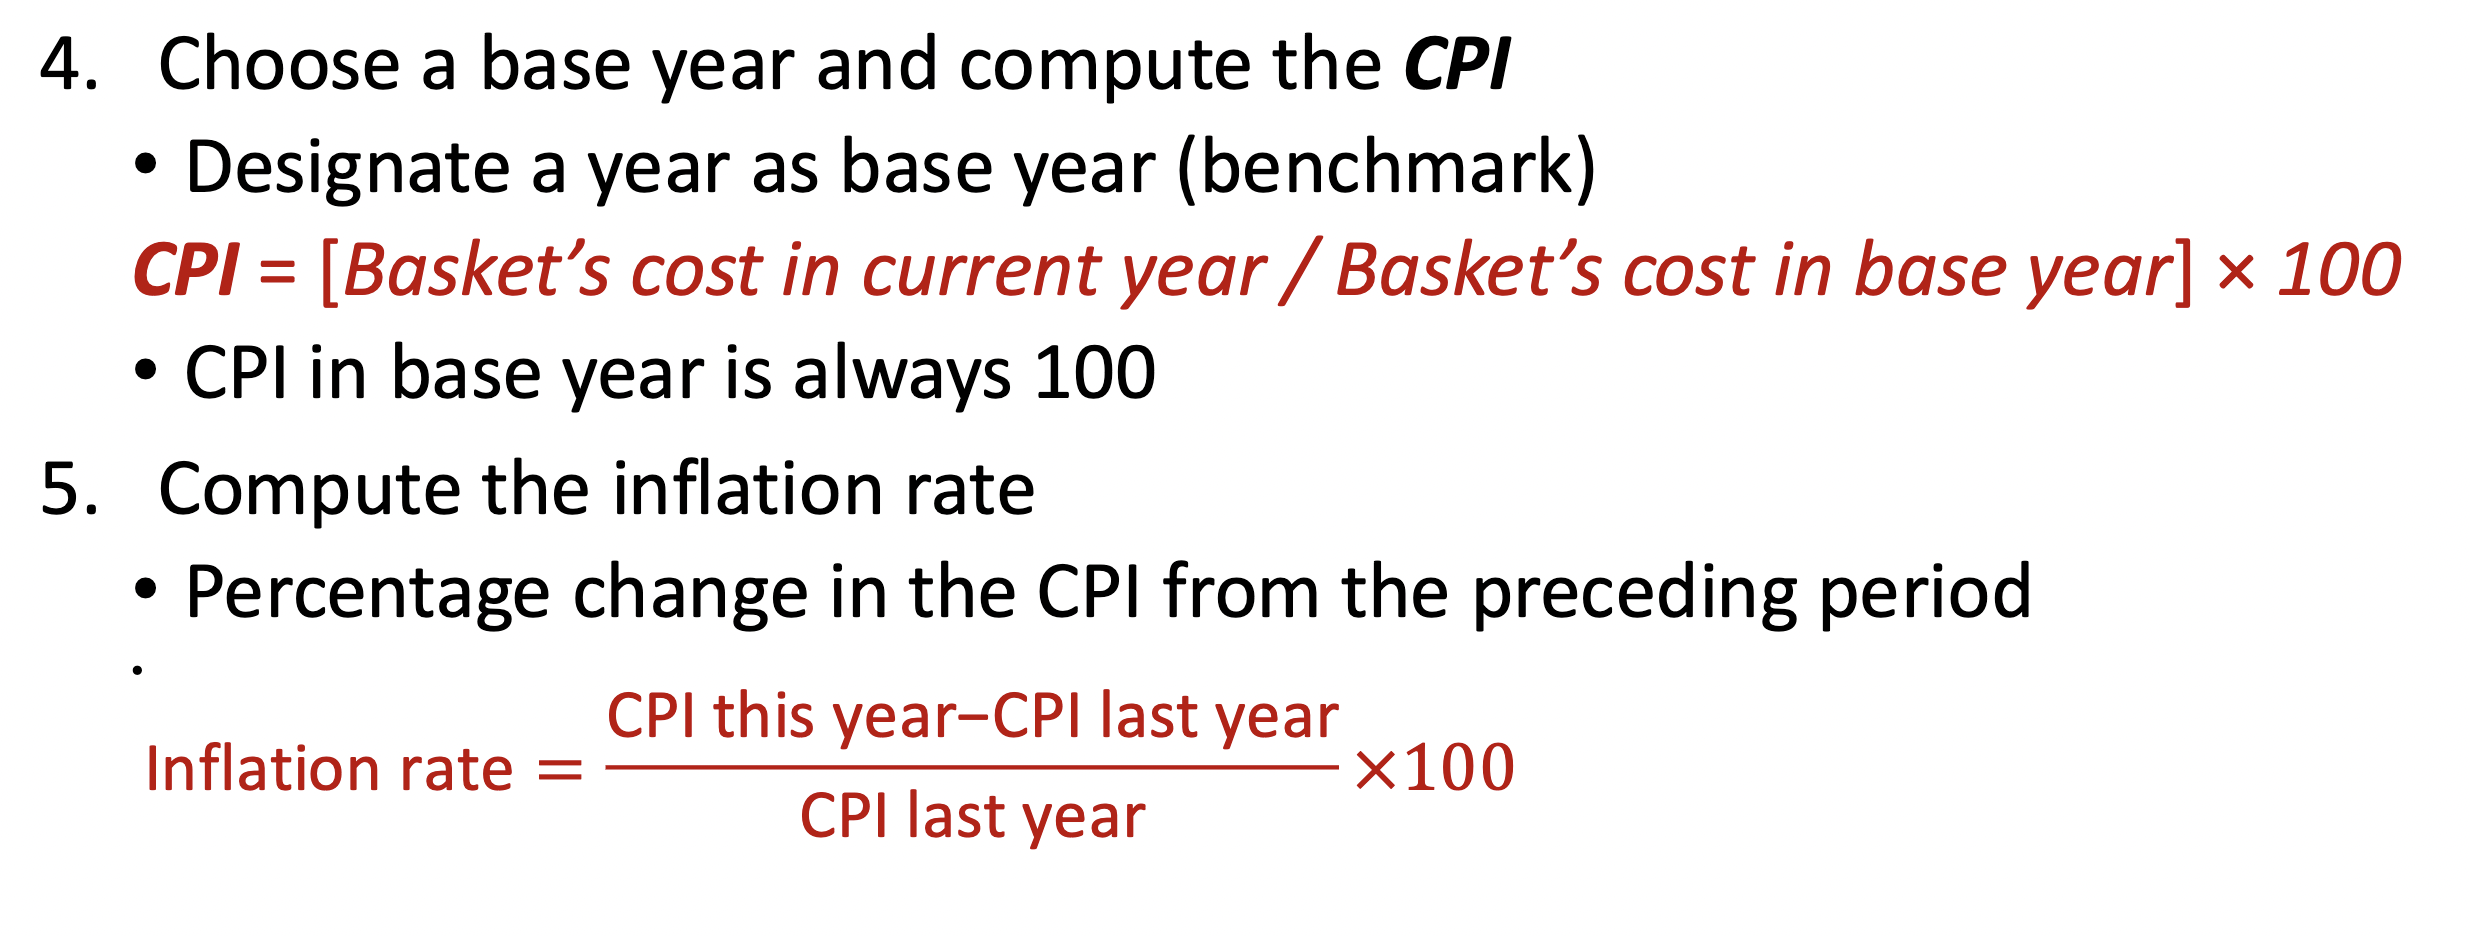
We assume the market basket remains fixed—consumers purchase the same quantities of the goods and services in the basket. This lets us measure how much the cost of the same basket changes over time.
Which agency reports and publishes CPI data? How frequent does the agency publish
CPI data?
The U.S. Bureau of Labor Statistics (BLS) reports and publishes CPI data.
Agency: Bureau of Labor Statistics (BLS)
Frequency: Monthly
Important distinction for the exam:
CPI → BLS → monthly
GDP → BEA → quarterly
Difference between CPI and GDP deflator. Be able to determine whether an increase in the value of a good is reflected in CPI and/or GDP deflator. ←ADD LATER!!
Imported consumer goods:
Included in CPI but excluded from GDP deflator
Capital goods:
Excluded from CPI but included in GDP deflator (if produced domestically)
The basket:
CPI: fixed basket; prices of all goods and services bought by consumers
GDP deflator: prices of all goods and services currently produced domestically
STILL GOTTA ADD EVERYTHING AFTER CHAPTER 11 #5!!