STATS ex 2 - Normality of Distribution
 Call Kai
 Learn
Learn Practice Test
 Spaced Repetition
 Match
Match Flashcards
 Knowt Play
1/22

There's no tags or description
Looks like no tags are added yet.
Name | Mastery | Learn | Test | Matching | Spaced | Call with Kai | Chat |
|---|
No analytics yet
Send a link to your students to track their progress
23 Terms
Normality of a Distribution
display the frequency of a continuous variable
normal curve has a symmetrical or equal distribution of scores around the mean with a small number of outliers in the two tails
can be displayed in a table or a figure
frequency table
method of organizing data by listing every possible value in the first column of numbers and the frequency of each value as the second column
steps to normality of distribution is on slide deck
okkk
Normal Curve
theoretical normal curve is an expression of statistical theory
it is a theoretical frequency distribution of all possible scores
however, no real distribution exactly fits the normal curve
the theoretical curve is symmetrical, unimodal and has continuous values (mean, median and mode are equal)
Skewness
any frequency distribution that is not symmetrical is referred to as skewed or asymmetrical
in skewed distribution mean, median, and mode are not equal
skewness interferes with validity of many statistical analyses
Positively Skewed
largest portion of data is below the mean
mean is greater than the median which is greater than the mode
Negatively skewed
largest portion of data is above the mean
the mean is less than the median which is less than the mode
Kurtosis
explains the degree of peakedness of the frequency distribution, which is related to the spread of variance of scores
extreme kurtosis can affect the validity of statistical analysis because the scores have little variance
Leptokurtic
extremely peaked distribution
Mesokurtic
intermediate degree of kurtosis
Platykurtic
relatively flat distribution
kurtosis indications
0 - indicates curve is mesokurtic
value above 0 - indicate curve is leptokurtic
values below 0 (negative) - indicate platykurtic curve
skewness and kurtosis should be assessed when
prior to statistical analysis - importance of such non-normality needs to be determined by both the researcher and the statistician
Skewness and Kurtosis statistic values of ≥+1 or ≤ -1 are..
fairly severe and could impact outcomes form parametric analysis techniques
if kurtosis and skewness is severe nonparametric testing should be considered
Shapiro-Wilk’s W test
is a formal test of normality that assesses whether a variable’s distribution is skewed and or kurtotic
this test has the ability to calculate both skewness and kurtosis by comparing the shape of the variable’s frequency distribution to that of a perfect normal curve

Looking at result for “Number of Times Fired from Job” what can you conclude
positively skewed (>1)
Kurtosis = 0.576 (slightly leptokurtic)
Significant deviation from normal (p=.001)

Looking at the results for “Age of 1st arrest” what can you conclude
positively skewed (>1)
Kurtosis = 2.043 (Leptokurtic)
Shapiro Wilk = 0.017 (Significant deviation from normal)

Looking at age enrollment what did you conclude ?
appeared to be negatively skewed but did not yield skewness nor kurtosis or Shapiro-Wilk values that indicated deviations from normality (p=.373)
What is skewness
measure of asymmetry of the distribution
What is kurtosis
the degree of peakedness of the frequency distribution
(≥+1 or ≤ -1 are fairly severe)
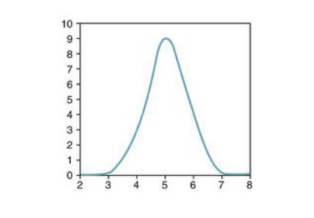
How would you characterize the kurtosis of this distribution
leptokurtic - small variation.

How would you characterize the skewness of the distribution
negatively skewed (tail on left)

how would you characterize the kurtosis of the distribution
platykurtic
does not have extreme kurtosis (=-.575)
positively skewed