APES Notes
AP Environmental Science Notes
Unit 1 Introduction to Ecosystem
Ecosystems
Ecosystem: all living and nonliving things in an area
Biome: large area with similar climate conditions that determine plant and animal species there
Organism interactions –
Competition: organisms fighting over a resource like food or shelter; limits population size
Predation: one organism using another for energy source (hunters, parasites, even herbivores)
Mutualism: relationship that benefits both organism
Commensalism: relationship that benefits one organism and doesn’t impact the other
Predation
Herbivores: (plant eaters) eat plants for energy
True predators: (carnivores) kill and eat prey for energy.
Parasites: use a host organism for energy, often without killing the host and often living inside host
Parasitoids: lay eggs inside a host organism; eggs hatch and larvae eat host for energy
Symbiosis (sym = together | bio = living | osis = condition)
Any close and long-term interaction between two organisms of different species
Mutualism, commensalism, and parasitism are all symbiotic relationships.
Competition: reduces population size since there are fewer resources available and fewer organisms can survive
Resource partitioning: different species using the same resources in different ways.
Temporal partitioning: using resources at different times, such as wolves and coyotes hunting at different times.
Spatial partitioning: using different areas of a shared habitat.
Morphological partitioning: using different resources based on different evolved body features.
Terrestrial (Land) Biomes
Biome: an area that shares a combination of average yearly temperature and precipitation (climate)
The community of organisms (plants and animals) in a biome are uniquely adapted to live in that biome.
Nutrient availability - plants need soil nutrients to grow, so availability determines which plants can survive in a biome.
Shifting biomes - biomes shift in location on earth as climate changes.
Aquatic Biomes
Characteristics of Aquatic Biomes
Salinity: how much salt there is in a body of water, determines which species can survive and usability for drinking
Depth: influences how much sunlight can penetrate and reach plants below the surface for photosynthesis
Flow: determines which plants and organism can survive, how much O2 can dissolve in water
Temperature: warmer water holds less dissolve O2 so it can support fewer aquatic organisms
Freshwater: Rivers and Lakes
Rivers have high O2 due to flow mixing water and air also carry nutrient-rich sediments (deltas and flood plains = fertile soil)
Lakes = standing bodies of fresh H2O (key drinking H2O source)
Littoral: shallow water with emergent plants
Limnetic: where light can reach (photosynthesis)
No rooted plants, only phytoplankton
Profundal: too Deep for sunlight (no photosynthesis)
Benthic: murky bottom where inverts (bugs) live, nutrient-rich sediments
Freshwater: Wetlands
Wetland: are with soil submerged/saturated in water for at least part of the year, but shallow enough for emergent plants
Plants living here have to be adapted to living with roots submerged in standing water (cattails, lily pads, reeds)
Benefits of wetlands
Stores excess water during storms, lessening floods.
Recharges groundwater by absorbing rainfall into soil.
Roots of wetland plants filter pollutants
Highly plant growth due to lots of water and nutrients (dead organic matter) in sediments
Estuaries: areas where rivers empty into the ocean
Mix of fresh and salt water (species adapt to this)
High productivity (plant growth) due to nutrients in sediments deposited in estuaries by river.
Salt marsh:
Estuary habitat along coast in temperate climates
Breeding ground for man fish and shellfish species
Mangrove swamps:
Estuary habitat along coast of tropical climates
Mangrove trees with long, stilt roots stabilize shoreline and provide habitat for many species of fish and shellfish.
Coral Reef
Warm shallow waters beyond the shoreline; most diverse marine biome on earth
Mutualistic relationship between coral (animals) and algae (plant
Coral takes CO2 out of ocean to create calcium carbonate exoskeleton (the reef) and provides CO2 to the algae.
Algae lives in the reef and provides sugar (energy) to the coral through photosynthesis.
Both species rely on the other:
Coral couldn’t survive without energy from algae.
Algae need the home of the reef of CO2 from the coral.
Intertidal Zones
Narrow band of coastline between high and low tide
Organisms must be adapted to survive crashing waves and direct sunlight/heat during low tide.
Shells and tough outer skin can prevent drying out (desiccation) during low tides.
Different organisms are adapted to live in different zones.
Open Ocean
Low productivity/area as only algae and phytoplankton can survive in most of the ocean.
So large though, that algae and phytoplankton of ocean produce a lot of earth’s O2 and absorb a lot of atmospheric CO2.
Photic zone = area where sunlight can reach (photosynthesis)
Aphotic zone (abyssal) = area to deep for sunlight
Carbon Cycle
Movement of molecules that contain Carbon (CO2, glucose, CH4) between sources and sinks.
Some steps are very quick (FF combustion); some are very slow (sedimentation and burial)
Leads to imbalance in which reservoirs or sinks are storing carbon.
The atmosphere is a key C reservoir, increasing levels of C in atmosphere. Leads to global warming.
Carbon sink: a carbon reservoir that stores more carbon than it releases.
Ocean (algae and sediments), plants, soil
Carbon source: processes that add C to atmosphere.
Fossil fuel (oil, coal, natural gas) combustion
Animal (cow burps and farts = CH4)
Deforestation, releases CO2 from trees
Photosynthesis and Cellular Respiration
Both processes are very quick
Cycle C between biosphere and atmosphere in balanced amount (no net C increases in atmosphere)
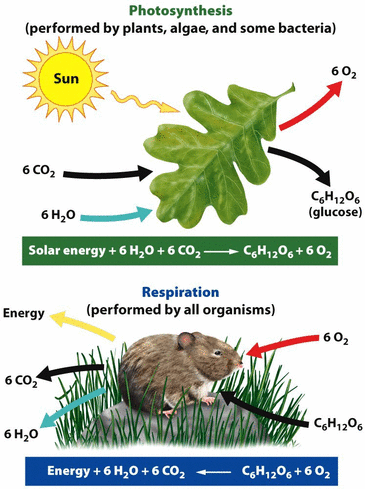 Photosynthesis
Plants, algae, phytoplankton
Removes CO2 from the atmosphere and converts it to glucose.
Glucose = biological form of C and stored (chemical) energy in form of sugar
CO2 sink
Cellular Respiration
Done by plants and animals to release stored energy.
Uses O2 to break glucose down and releases energy.
Releases CO2 into atmosphere
CO2 source (adds CO2 to atmosphere)
Ocean and Atmosphere
Direct exchange: CO2 moves directly between atmoshpere and the ocean by dissolving into and out of ocean water at the surface
Happens very quickly and in equal directions, balancing levels of CO2 between atmosphere and ocean
Because of direct exchange, increasing atmospheric CO2 also increases ocean CO2, leading to ocean acidification
Algae and phytoplankton take CO2 out of the ocean and atmosphere through photosynthesis
Coral reef and marine organisms with shells also take CO2 out of the ocean to make calcium carbonate exoskeletons
Sedimentation: when marine organisms die, their bodies sink to the ocean floor where they’re broken down into sediments that contain C
Burial: over long, periods of time, pressure of water compresses C – containing sediments on the ocean floor into sedimentary stone (limestone, sandstone) - long term C reservoir
Burial, Extraction, and Combustion
Burial: slow, geological process that stores C in underground sinks like sedimentary rock or fossil fuels
Sediments (bits of rock, soil, organic matter) compressed into sedimentary rock or fossil fuels by pressure from overlying rock layers or water.
Fossil Fuels (FF): coal, oil, and natural gases are formed from fossilized remains of organic matter.
Extraction and Combustion: digging up or mining fossil fuels and burning them as energy source, releases CO2 into the atmosphere
Burial (formation of fossil fuels) takes far longer than extraction and combustion, which means they increase concentration of CO2 in the atmosphere
Nitrogen Cycle
Movement of Nitrogen containing molecules between sources and sinks/reservoirs
Sources releases N into atmosphere; sinks take N out of the atmosphere in increasing amounts.
Nitrogen reservoirs hold nitrogen for relatively short periods of time compared to the Carbon cycle.
Atmosphere = main Nitrogen reservoir
Nitrogen in the atmosphere exists mostly as N2 gas, not usable by plants or animas.
Nitrogen = critical plant and animal nutrient
All living things need nitrogen for DNA and amino acids to make proteins.
Nitrogen fixation
Process of N2 gas being converted into biologically available (useable by plants) NH3 (ammonia) or NO3- (nitrate)
Bacterial fixation: certain bacteria that live in the soil, or in symbiotic relationships with plant root nodules convert N2 into ammonia (NH3)
Synthetic fixation: humans combust fossil fuels to convert N2 gas into nitrate (NO3-)
Other Nitrogen Cycle Steps
Assimilation: plants and animals taking nitrogen in and incorporating it into their body
Ammonification: soil bacteria, microbes and decomposers converting waste and dead biomass back into NH3 and returning it to soil
Nitrification: conversion of NH4 into nitrite (NO2) into nitrous oxide (N2O) gas which returns to atmosphere
Human impacts on nitrogen cycle
Climate: N2O (nitrous oxide) = greenhouse gas which warms earth’s climat4
Ammonia volatilization: excess fertilizer use can lead to NH3 gas entering the atmosphere.
Leaching and eutrophication: synthetic fertilizer use leads to nitrates (NO3-) leaching, or being carried out of soil by water.
Phosphorus Cycle
Phosphorus cycle basics
Movement of phosphorus atoms and molecules between sources and sinks/reservoirs
Rocks and sediments containing phosphorous minerals = major reservoirs
Phosphorus cycle is very slow compared to Carbon, water, nitrogen cycles.
Takes a long time for phosphorus minerals to be weathered out of rocks and carried into soil/bodies of water.
No gas phase of phosphorus (doesn’t enter atmosphere)
Because the cycle is so slow, it is limiting nutrients, meaning plant growth in the ecosystem is often limited by phosphorus availability in soil and water.
Phosphorus is needed by all organisms for DNA, ATP (energy), bones and tooth enamel in some animals.
Phosphorus sources
The major natural source of phosphorus is the weathering of rocks that contain phosphorus materials.
Wind and rain break down rock and phosphate are released and dissolved into water’ rainwater carries phosphates into nearby soils and bodies of water
Weathering is so slow that phosphorus is often a limiting nutrient in aquatic and terrestrial ecosystems.
Synthetic: (human) sources of phosphorus = mining phosphate minerals and adding to products like synthetic fertilizers and detergents/cleaners
Synthetic fertilizers containing phosphates are added to lawns or agriculture. Field: runoff carries phosphorus into nearby bodies of water. Phosphates from detergents and cleaners enter bodies of water via wastewater from homes.
Assimilation and Excretion/decomposition
Phosphorus is absorbed by plant roots and assimilates into tissues; animals assimilate phosphorus by eating plants or other animals.
Animal waste, plant matter and other biomass is broken down by bacteria/soil decomposers that return phosphate to soil.
Assimilation and excretion/decomposition form a mini loop within Phosphorus cycle just like assimilation and ammonification in nitrogen cycle, photosynthesis and respiration in carbon cycle.
Sedimentation and Geography uplift
Phosphate doesn’t dissolve very well into water; much of it forms solid bits of phosphate that fall to the bottom as sediment (sedimentation)
Phosphorus sediments can be compressed into sediment rock over long time periods by pressure of overlying water.
Geological uplift: tectonic plate collision forcing up rock layers that form mountain; phosphorous cycle can start over again with weathering and release of phosphate from rock.
Eutrophication (too much nitrogen and phosphorus)
Because they’re limiting nutrients in aquatic ecosystems, extra input of nitrogen and phosphorous lead to eutrophication (excess nutrients) which fuels algae growth.
Algae bloom covers surface of water, blocking sunlight and killing plants below surface.
Algae eventually die-off: bacteria that break down dead algae use up O2 in the water (because decomposition = aerobic process)
Lower O2 levels (dissolved oxygen) in water kills aquatic animals, especially fish.
Bacteria use up even more O2 to decompose dead aquatic animals.
Create positive feedback loop: less O2 🡪 more dead organism 🡪 more bacterial decomposition 🡪 O2.
Hydrologic (water) Cycle
Water cycle overview
Movement of H2O (in different states) between sources and sinks
States of matter (solid/liquid/gas) as well as where water is moving are ley in H2O cycle.
Energy from sun drives the H2O cycle.
Ocean = largest water reservoir
Ice caps and groundwater are smaller reservoirs but contain fresh useable water for humans.
Evaporation and Evapotranspiration
2 main sources of water (processes that cycle it from liquid on earth back into the atmosphere)
Sometimes called vaporization since liquid water becomes water vapor (gas) in atmosphere.
Transpiration: process plants use to draw groundwater from roots up to their leaves
Leaf openings called stomata open, allowing water to evaporate into atmosphere form leaf.
Movement of H2O out of leaf creates low H2O potential in leaf, pulling H2O up from roots.
Evapotranspiration: amount of H2O that enters atmosphere from transpiration and evaporation combined
Both processes are driven by energy from the sun
Runoff and Infiltration
Precipitation (rain) either flows over earth’s surface into a body of water (runoff) or trickles through soil down into groundwater aquifers (infiltration)
Groundwater (aquifers) and surface waters (lakes/rivers) are important freshwater reservoirs for humans and animals.
Precipitation recharges groundwater through infiltration, but only if ground is permeable (able to let water pass through)
Runoff recharges surface waters, but can also carry pollutants into water sources.
 Primary Productivity
Primary Productivity Basics
Primary Productivity: rate that solar energy is converted into organic compounds via photosynthesis over a unit of time.
(Rate of photosynthesis of all producers in an area over a given period of time
Ecosystems with primary productivity are usually more biodiverse than ecosystems with low primary productivity.
Calculating Primary Productivity
NPP = GPP – RL
Net primary productivity (NPP): the amount of energy (biomass) leftover for consumers after plants have used some for respiration.
Think of NPP as the actual amount of the plants paycheck it keeps after taxes.
Respiration loss (RL): plants use up some of the energy they generate via photosynthesis by doing cellular respiration (movement, internal transportation, etc.)
Gross Primary Productivity (GPP): the total amount of sun energy (light) that plants capture and convert to energy (glucose) through photosynthesis.
Ecological Efficiency
The portion of incoming solar energy that is captured by plants and converted into biomass (NPP or food available for consumers)
Generally, only 1% of all incoming sunlight is captured and converted into GPP via photosynthesis.
Of that 1%, only about 40% (or o.4% of total incoming solar energy) is converted into biomass/plant growth (NPP)
Some ecosystems are more efficient (higher NPP) than others.
Trends in Productivity
The more productive a biome is, the wider the diversity of animal life it can support.
Water availability, higher temperature, and nutrient availability are all factors that lead to high NPP.
Trophic Levels
The 10% Rule
Conservation of Matter and Energy
Matter and energy are never created or destroyed; they only change forms.
1st law of thermodynamics: energy is never created or destroyed.
Biogeochem cycles demonstrates conservation of matter (C/N/H2O/P)
Food webs demonstrate conservation of energy.
2nd Law of Thermodynamics
Each time energy is transferred, some of it is lost as heat.
Applied to food webs: the amount of useable energy decreases as you move up the food chain (organism use up most of it for movement, development, etc.)
Because available energy decreases with each step up the food chain, trophic pyramid (troph = nourishment or growth) is used to model how energy moves through an ecosystem
10% Rule: in trophic pyramids, only about 10% of the energy from one level makes it to the next level; the other 90% is used by the organism and lost as heat.
Trophic Levels and 10% Biomass
Tertiary consumers: animals that eat secondary consumers or carnivores and omnivores (aka top/apex predators)
Secondary consumers: animals that eat primary consumers or herbivores (aka – carnivores and omnivores)
Primary consumers: animals that eat plants (herbivores)
Producers: (plants) “produce” – really convert sun’s light energy into chemical energy (glucose)
10% rule also applies to biomass (or mass of all living things at each trophic level)
Since energy is needed for growth and only 10% of energy transfers from one level to the next, only 10% of the biomass can be grown/supported.
To calculate biomass or energy available at the next level up, move the decimal place one spot to the left (or divide by 10)
Food Chains and Food Webs
Food Web Basics
Shows how matter and energy flow through an ecosystem, from organism to organism.
When one organism preys on (eats) another, the matter (C/N/H2O/P) and energy (glucose, muscle tissue, etc.) are passed on to the predator.
Arrows in food webs indicate direction of energy flow.
Food Web vs Chain
The food chain just shows one, linear path of energy and matter.
Food webs have at least 2 different interconnected food chains
Interactions and Trophic Cascade
Food webs show how increases or decreases in population size of a given species impact the rest of the food web.
Trophic cascade: removal or addition of a top predator has a ripple effect down through lower trophic levels
Unit 2 Biodiversity
2.1 Intro to Biodiversity
Biodiversity Basics
Diversity of life forms in an ecosystem; measured on 3 different levels:
Ecosystem diversity: the number of different habitats available in each area.
Species diversity: the number of different species in an ecosystem and the balance or evenness of the population sizes of all species in the ecosystem
Genetic diversity: how different the genes are of individuals within a population (group of the same species)
Higher biodiversity = higher ecosystem/ population health
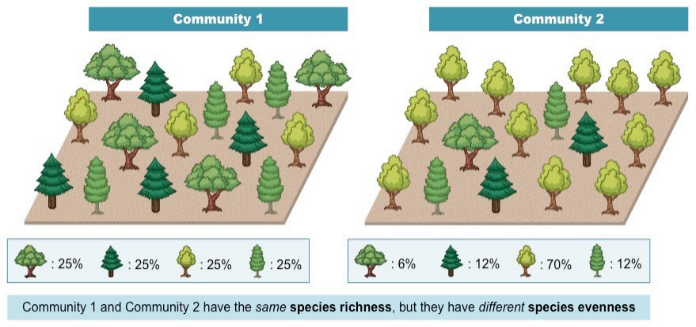 Species Richness and Evenness
Richness: the total number of different species found in an ecosystem
Evenness: measure of how all the individual organisms in an ecosystem are balanced between the different species
Indicates if there are one or two dominant species, or if population size is well balanced.
Genetic diversity is Beneficial.
Genetic diversity: measure of how different the genomes (set of genes) are of the individuals within a population of a given species.
The more genetic diversity in a population, the better the population can respond to the environment. Stressors like drought, disease, or famine.
More genetic diversity = a higher chance that some of the individuals in a population have traits that allow them to survive the environmental stressor.
Bottleneck Event
An environmental disturbance (natural disaster/ human habitat destruction) that drastically reduces population size and kills organisms regardless of their genome.
Surviving population is smaller because individuals died randomly, it doesn’t represent the genetic diversity of the original population.
Bottleneck events reduce genetic diversity – because the population is smaller and less genetically diverse, it’s even more vulnerable to future environmental disturbances.
Inbreeding Depression
Inbreeding is when an organism mates with closely related “family” members.
Leads to a higher chance of offspring having harmful genetic mutations because they’re getting similar genotypes from both parents.
Smaller populations are more likely to experience inbreeding.
Ecosystem Resilience
Resilience: the ability of an ecosystem to return to its original condition after a major disturbance (windstorm, fire, flood, clear-cutting, etc.).
Higher species diversity = higher ecosystem resilience
2.2 Ecosystem Services
Goods that come from natural resources or services/functions that ecosystems carry out that have measurable economic/financial value to humans.
Provisioning: goods taken directly from ecosystems or made from natural resources (wood, paper, food)
Regulating: natural ecosystems regulate climate/air quality, reducing storm damage and healthcare costs
Supporting: natural ecosystems support processes we do ourselves, making them cheaper and easier (bees pollinate crops)
Cultural: money generated by recreation (parks, camping, tours) or scientific knowledge
Humans Disrupt Ecosystem Services
Human activities disrupt the ability of ecosystems to function, which decreases the value of ecosystem services they proved.
This has ecological (natural) and economic (money-based) consequences.
Provisioning Services
Goods/products directly provided to humans for sale/use by ecosystems.
Goods/products that are made from natural resources that ecosystems provide.
Disrupted by overharvesting, water pollution, clearing land for agriculture/urbanization.
Regulation Services
Benefits provided by ecosystem processes that moderate natural conditions like climate and air quality.
Disrupted by deforestation.
Supporting Services
Natural ecosystems support processes we do ourselves, making them less costly and easier for us.
Disrupted by pollinator habitat loss and filling in wetlands for development.
Cultural Services
Revenue from recreational activities (hunting/fishing licenses, park fees, tourism-related spending) and profits from scientific discoveries made in ecosystems (health/agriculture/educational knowledge).
Disrupted by deforestation, pollution, and urbanization.
2.3 Theory of Island Biogeography
Generalist- R: insects, reptiles, amphibians, fish (lay eggs and leave offspring)
Specialist – K: mammals (bear, human, panda, whale, dolphin, etc.) (Stay with offspring for a while)
Island Biogeography
Study of ecological relationships and community structure on islands.
Two basic “rules” or observations of island biogeography.
Larger islands support more total species.
The larger the island, the greater the ecosystem diversity.
Greater ecosystem diversity = more food and habitat resources.
More niches, or “roles” organisms can play in the ecosystem.
Islands closer to the “mainland” support more species.
Easier for colonizing organisms to get to the island from mainland.
More colonizing organisms = more genetic diversity in new population.
Larger Islands Support More Species
Larger islands =
Higher ecosystem diversity
More available “niches” or roles
Larger population sizes (more genetically diverse and more resistant to environmental disturbance).
Lower extinction rate (species less likely to die off)
Positive correlation between island size and species richness
Distance to Mainland
Closer to mainland = higher species richness
Easier for more species to migrate to island from mainland.
More continual migration of individuals to the island habitat.
Frequent migration brings more genetic diversity and larger population size.
Inverse relationship between island distance from mainland and species richness
The further away from mainland, the fewer species
Evolution on Islands
Island have limited space and resources, creating unique conditions for evolution.
More pressure for species to adapt to narrower niches (more specific food/habitat).
Adaptive radiation: single species rapidly evolving into several new species to use difference resources and reduce competition.
Single colonizing species from mainland quickly evolves to many slightly different species to adapt to new island conditions.
2.4 Ecological Tolerance
Ecological Range of Tolerance
Range of conditions such as temperature, salinity, pH, or sunlight that an organism can endure before injury or death results.
Species and individual organisms both have a range of tolerance for all the different environmental conditions of their habitat.
Ecological Range of Tolerance – Zones
Optimal range: range where organism survive, grow, and reproduce.
Zone of physiological stress: range where organisms survive, but experience some stress such as infertility, lack of growth, decreased activity, etc.
Zone of intolerance: range where the organism will die.
FRG Writing Tips
On FRQs about human activity or natural events that cause environmental disturbance, connect answer to ecological range of tolerance (if possible, connect human activity to climate change).
Try to connect a shift in range of tolerance to a specific kind of physiological stress.
2.5 Natural Disruptions to Ecosystems
Natural disturbances
A natural event that disrupts the structure and or function of an ecosystem
Ex. Tornados, hurricanes, asteroids, forest fires, drought
Natural disturbance can be even greater than human disruptions. It can occur on periodic, episodic, or random time frames.
Periodic: occurs regular frequency (ex. Dry-wet seasons)
Episodic: occasional events with irregular frequency (ex. Hurricanes, droughts, fires)
Random: no regular frequency (ex. Volcanoes, earthquakes, asteroids)
Natural Climate Change
Earth’s climate has varied over geologic time for numerous reasons.
Sea level has varied over geological time as glacial ice on earth melts and forms.
Increased CO2 levels lead to warmer temperatures, melting of glacial ice and sea level rises.
Environmental Change = Habitat Disruption
Major environmental disturbances result in widespread habitat changes and our loss.
Migration
Wildlife may migrate to a new habitat as the results of natural disruptions.
Ex. Wildebeest migrating to follow rain patterns of African savanna.
Ocean species move further north as water temperature warms.
Bird migration and breeding shift earlier as insect hatching shifts earlier with warming climate.
2.6 Adaptations
Fitness and Adaptation
All populations have some genetic diversity, or variability in genomes of individuals; genetic diversity exists because:
Random mutations while DNA is being copied create new traits.
Crossing over in parent chromosomes creates new combinations of genes (and therefore traits).
Adaptation: a new trait that increases an organism’s fitness (ability to survive and reproduce).
Adaptation and Natural Selection
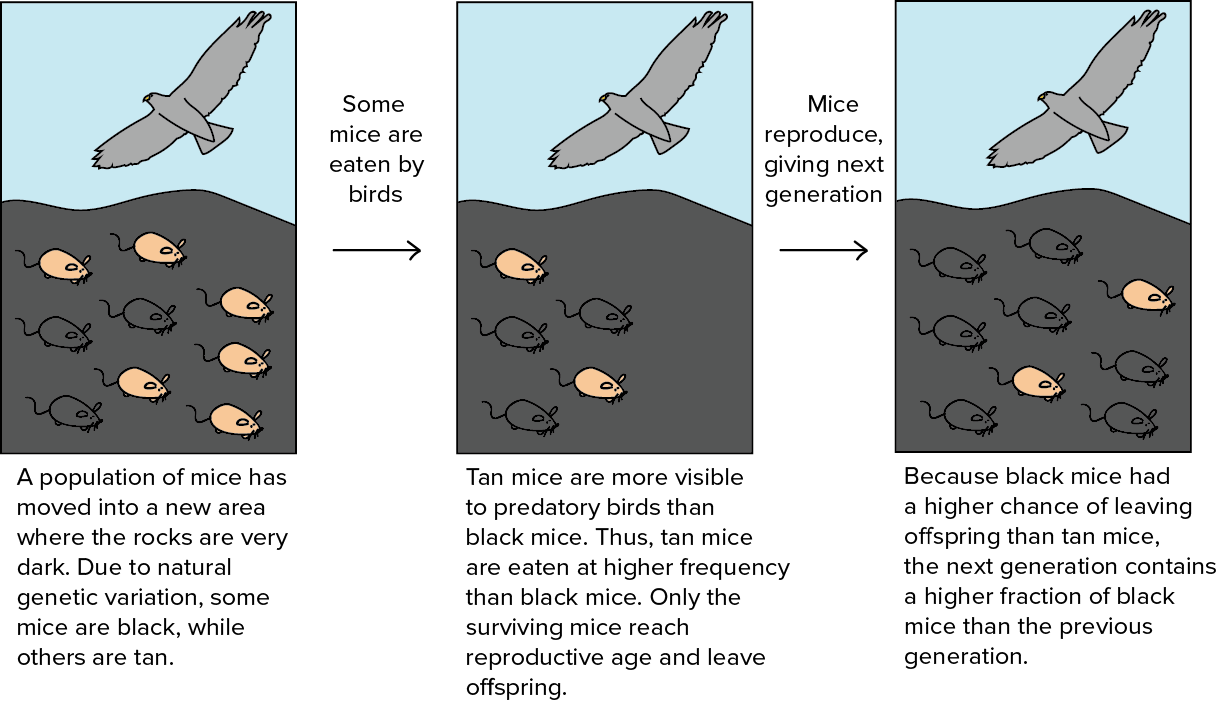 Natural selection: organisms that are better adapted to their environment survive and reproduce more offspring
Individuals with adaptations pass them on to offspring and individuals without adaptations die off, which leads to the entire population having the adaptation over time (evolution).
Selective pressure/force: the environmental conditions that kills individuals without the adaptation.
Environmental Change and Evolution
The environment an organism lives in determines which traits are adaptations.
As environments change, different traits may become adaptations and old traits become disadvantages.
Pace of Evolution
The more rapidly the environment changes, the less likely a species in the environment will be to adapt to those changes.
If the pace of environmental change is too rapid, many species may migrate out of the environment or die-off completely.
The more genetic diversity in a population, the better they’re able to adapt to environmental change (higher chance that some individuals have good mutations).
2.7 Ecological Succession
A Series of predictable stages of growth that a forest goes through.
Two types of succession:
Primary succession: start from bare rock in an area with no previous soil formation.
Moss and lichen spores carried by the wind grow directly on rocks, breaking them down to from soil.
Secondary succession: starts from already established soil, in an area where a disturbance (fire, tornado, human land clearing) cleared out the majority of plant life.
Grasses, sedges, wildflowers, and berry bushes have seeds dispersed by wind or animal droppings.
Stage of Succession
Stages are characterized by which type of plant species dominate the ecosystem; different species are adapted to the conditions of the different stages.
Pioneer or early succession species appear first, when the ground is simply bare rock, or bare soil after a disturbance.
Characteristics: seeds spread by wind or animals, fast growing, tolerant of shallow soil and full sunlight.
Mid-successional species appear after pioneer species helped develop deeper soil with more nutrients by their cycles of growth/death.
Characteristics: relatively fast growing, larger plants that need deeper soils with more nutrients than pioneers, sun tolerant.
Late successional or climax community species: appear last, after soil is deepened and enriched with nutrients by cycles of growth and death by early and mid-successional species.
Characteristics: large, slow-growing trees that are tolerant of shade and require deep soils for large root networks.
Primary Succession
Occurs in an area that hasn’t previously been colonized by plants (bare rock)
Moss and lichen (spores dispersed by wind) are able to grow directly on rock by secreting acids that break down rock and release minerals containing nutrients they need,
Secondary Succession
Occur in an area that already has established soil but has had most plant life removed by a disturbance.
Pioneer species: are still wind-dispersed seeds of plants that are fast-growing and sun-tolerant, but grasses/wildflowers/weed instead of moss/lichen.
Soil is already established and sometimes even enriched by nutrient-rich ash from fire, an overall, more rapid process than primary succession.
Unit 3 Population
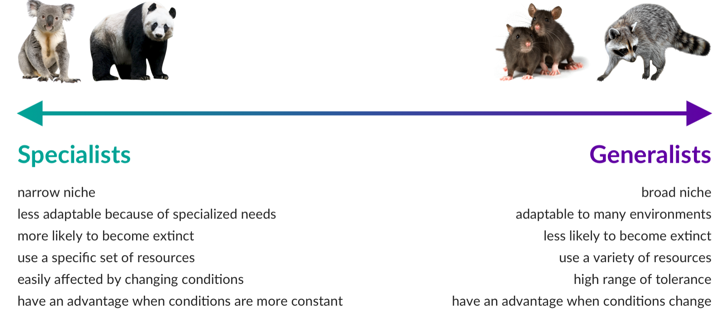 3.1 Specialist vs. Generalist Species
Specialist: smaller range of tolerance, or narrower ecological niche makes them more prone to extinction
Specific food requirements
Less ability to adapt to new conditions
Generalist: larger range of tolerance, broader niche makes them less prone to extinction and more likely to be invasive
Broad food requirements
High adaptability
3.2 K-Selected and R-"Selected Species
Quality vs. Quantity
K-selected – “Quality”
Few offspring, heavy parental care to protect them.
Usually reproduce many times
Ex. Most mammals, birds
Long lifespan, long time to sexual maturity = low biotic potential = slow population growth rate
More likely to be disrupted by environmental change or invasives.
R-selected – “Quantity”
Many offspring, little to no care
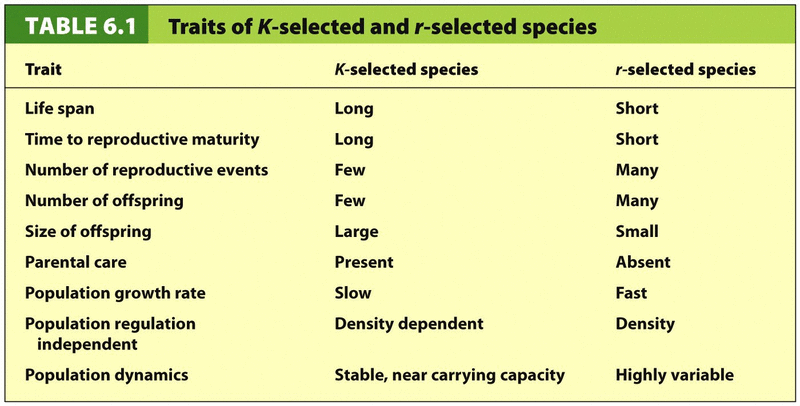 May reproduce only once.
Ex. Insects, fish, plants
Shorter lifespan, quick to sexual maturity = high biotic potential = high population growth rate
More likely to be invasive.
Better suited for rapidly changing environment conditions
K-Selected
Low biotic potential (repopulation rate) = hard for population to recover after disturbance
High parental care means death of parent = death of offspring
Invasives (usually r) outcompete for resources with high biotic potential and rapid population growth.
Less likely to adapt and more likely to go extinct.
R-Selected
High biotic potential (repopulation rate) = more rapid population recovery after disturbance
Low parental care means death of parent doesn’t impact offspring.
Not as impacted by invasive species since their population grows quickly.
More likely to be the invasive
Larger population and faster generation time = higher chance of adaptation and lower chance of extinction
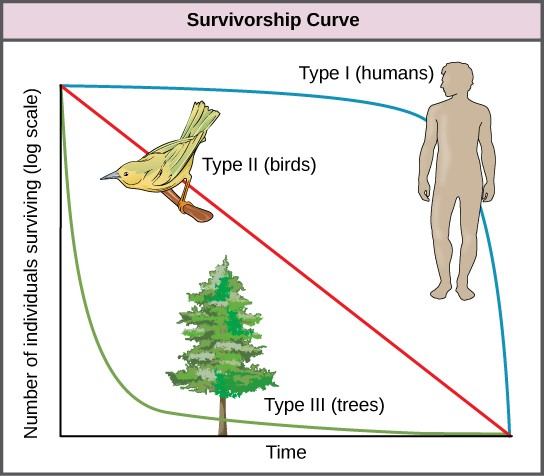 3.3 Survivorship Curves
Survivorship Curve: line that shows survival rate of a cohort (group of same-aged individuals) in a population from birth to death.
Type I (mostly K-selected)
High survivorship early in life due to high parental care
High survivorship in mid life due to large size and defensive behavior
Rapid decrease in survivorship in late life as old age sets in
Ex. Most mammals
Type II (in between R and K)
Steadily decreasing survivorship throughout life
Type III (mostly R-selected)
High mortality (low survivorship) early in life due too little to no parental care
Few make it to midlife; slow, steady decline in survivorship in midlife.
Even fewer make it to adulthood, slow decline in survivorship in old age.
Ex. Insects, fish, plants
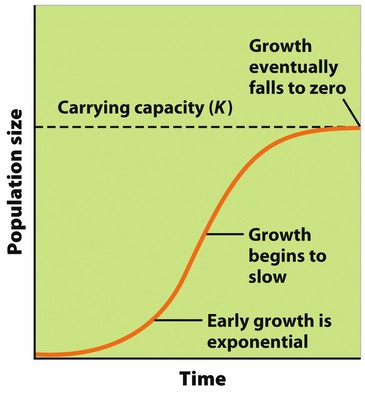 3.4 Carrying Capacity
Carrying Capacity (k): the max number of individuals in a population that an ecosystem can support (based on limiting resources
Highest population size an ecosystem can support based on limiting resources:
Food
Water
Habitat (nesting sites, space)
Overshoot: when a population briefly exceeds carrying capacity
Consequences of overshoot: resource depletion
Die-Off: sharp decrease in population size when resource depletion (overshoot) leads to many individuals dying.
3.5 Population Growth and Resource Availability
Population Characteristics
Size (N): total # of individuals in a given area at a given time
Larger = safer from population decline
Density: # of individuals/area
High density = higher competition, possibility for disease outbreak, possibility of depleting food source
Distribution: how individuals in a population are spaced out compared to each other
Random (trees)
Uniform (territorial animals)
Clumped (herd/group animals)
Population Characteristics and Growth Factors
Sex ratio: ratio of males to females. Closer 50:50, the more ideal for breeding
Die-off or bottleneck effect can lead to skewed sex ratio (not enough females) limiting population growth.
Density-Dependent Factors: factors that influence population growth based on size.
Density-Independent Factors: factors that influence population growth independent of their size.
Food is a density dependent factor (also a limiting resource)
Biotic Potential = max. potential growth rate, with no limiting resources
may occur initially, but limiting resources (competition, food, disease, predators) slow growth, and eventually limit population to carrying capacity (k)
Biotic potential = exponential growth
Logistic growth = initial rapid growth, then limiting factors limit population to K
Population Size = (Immigrations + births) – (immigration + deaths)
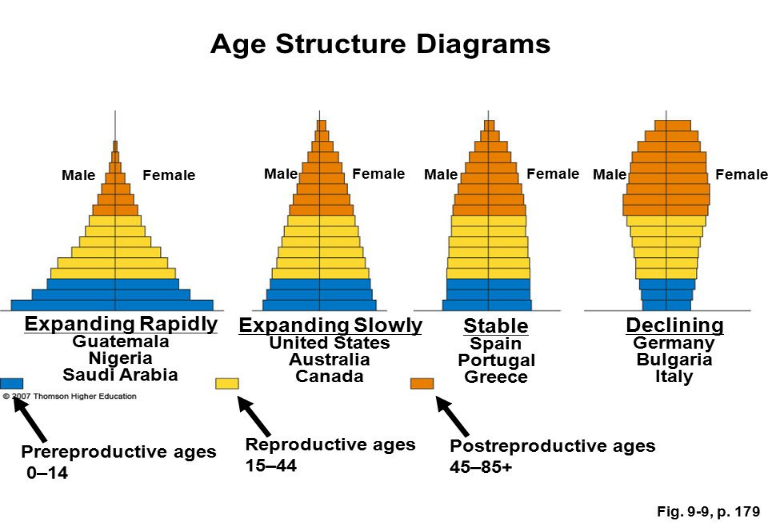 3.6 Age Structure Diagrams
Age Cohort and growth = groups of similarly aged individuals
0-14 = prereproductive; 25-44 = reproductive age; 45+ = post reproductive
3.7 Total Fertility Rate (TFR)
Total Fertility Rate (TFR): average number of children a woman in a population will bear through her lifetime.
Higher TFR = higher birth rate, higher population growth rate (generally)
Replacement Level Fertility: the TFR is required to offset deaths in a population and keep population size stable.
Infant Mortality Rate (IMR): number of deaths of children under 1 year per 1,000 people in a population
Higher IMR = higher TFR, due to families having replacement children
Factors in IMR decline –
Access to clean water
Access to healthcare
More reliable food supply
Factors that Affect TFR
Development (affluence): more developed or wealthy nations have a lower TFR than less developed nations.
More educational access for women
More economic opportunity for women
Higher access to family planning education and contraceptives
Later age of first pregnancy
Less need for children to provide income through agricultural labor.
Government Policy: can play a huge role in fertility by coercive (forceful) or noncoercive (encouraging) policies.
Forced or voluntary sterilization
China’s 1 (now 2) child policy
Tax incentives to have fewer children.
Microcredits or loans to women without children to start business.
3.8 Human Population Dynamics
Malthusian theory (what Malthus theorized)
Earth has a human carrying capacity, probably based on food production.
Human population growth is happening faster than growth of food production.
Humans will reach a carrying capacity limited by food.
Technological Advancement
Humans can alter earth’s carrying capacity with technological innovation.
Synthetic fertilizer, gmo
Birth Rate, Death Rate, and Growth
Growth rate (r) = % increase in a population (usually per year)
Crude Birth Rate and Crude Death Rate (CBR & CDR)
Births and deaths per 1,000 people in a population
Calculating Growth Rate (r):
Rule of 70: the time it takes (in years) for a population to double is equal to 70 divided by the growth rate.
Factors Affecting Human Population Growth
Factors that increase population growth
Higher TFR 🡪 higher birth rate
High infant mortality rate can drive up TFR (replacement children)
High immigration level
Increased access to clean water and healthcare (decrease death rate)
Factors that decrease population growth rate
High death rate
High infant mortality rate
Increased development (education and affluence)
Increased education for women
Delayed age of first child
Postponement of marriage age
Standard of Living Indicators
Standard of Living: what quality of life is like for people of a country based.
Gross Domestic Product (GDP) = key economic indicator of standard of living
Total value of the goods and services produced.
Per capita GDP is total GDP/total population.
Life expectancy = key health indicator of standard of living
Average age a person will live to in a given country.
Increases with access to clean water, health care, stable food sources.
High GDP and life expectancy are both indicators of development and low population growth.
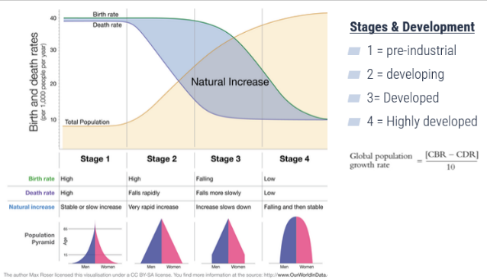
3.9 Demographic Transition
Stage 1 – Preindustrial
| Stage 2 – Industrializing/Developing
|
| |
Stage 3 – Developed/Industrialized
| Stage 4 – Post-Industrialized/Highly Developed
|
Unit 4 Earth Systems
Explain how scientists know about the Earth’s interior. | |
Earth’s Structure |
|
Plate Boundaries | 2 Types of tectonic Plates
Divergent Plate Boundary
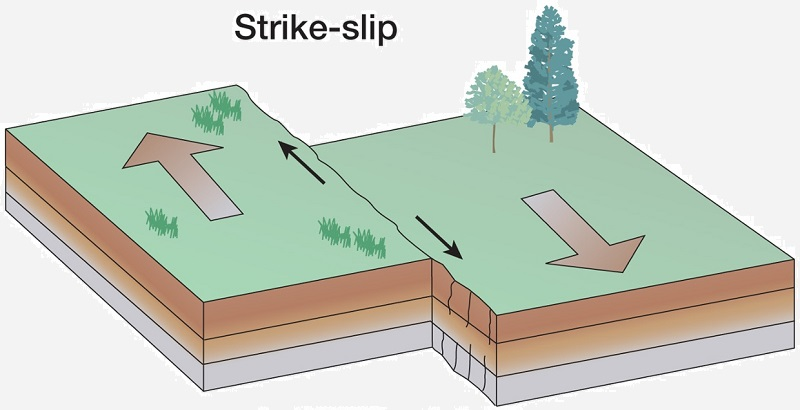
Transform Fault Plate Boundary
Convergent Plate Boundary
|
Convection Cycles (Divergent) |
|
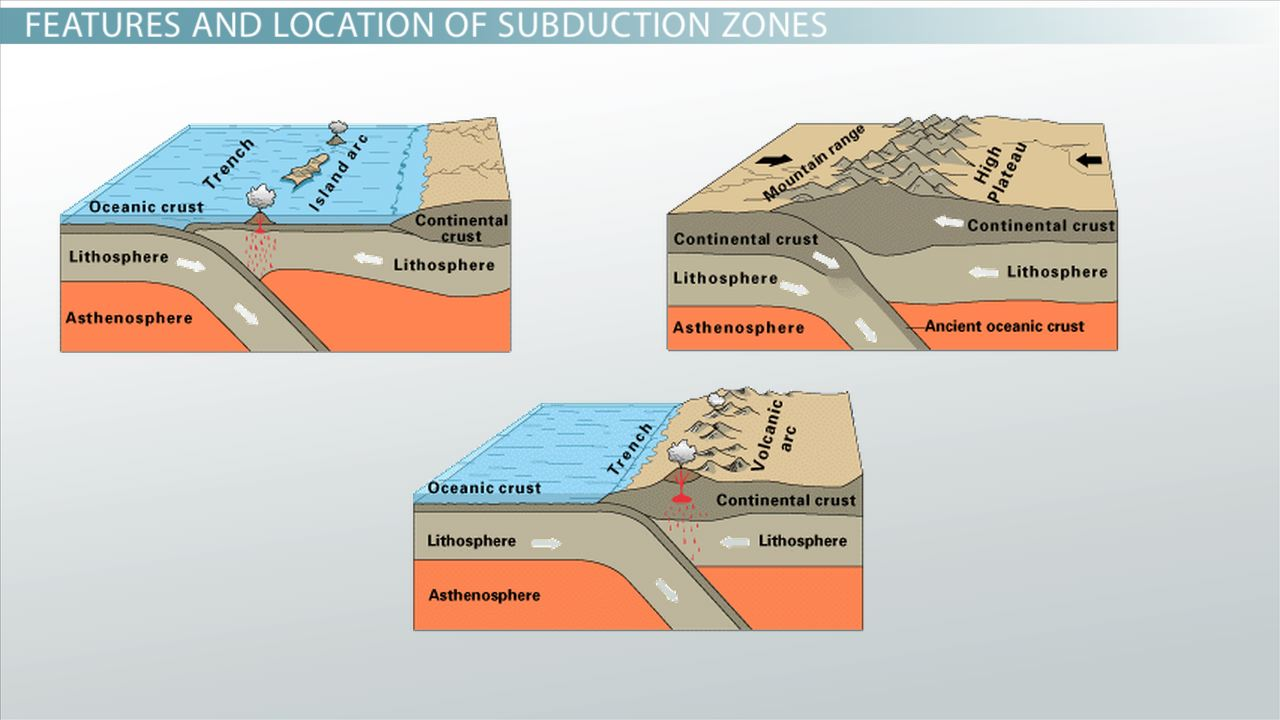
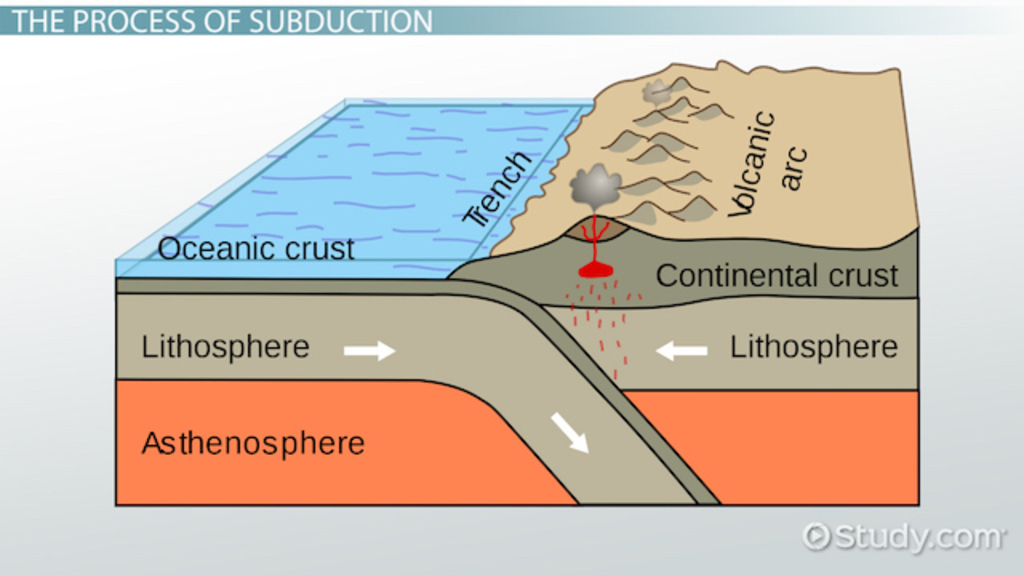
Convergent Boundary = Subduction Zone |
Oceanic-Oceanic: one plate subducts underneath other
Oceanic-Continental: dense oceanic plate subducts beneath cont. Plate & melts back into magma
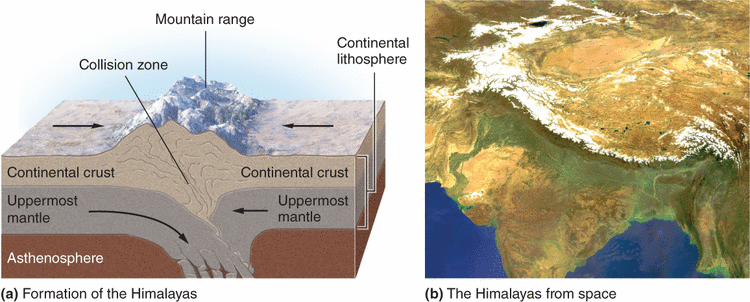
Continental-Continental one plate subducts underneath other, forcing surface crust upward (mountains)
|
Transform Fault Boundary |
|
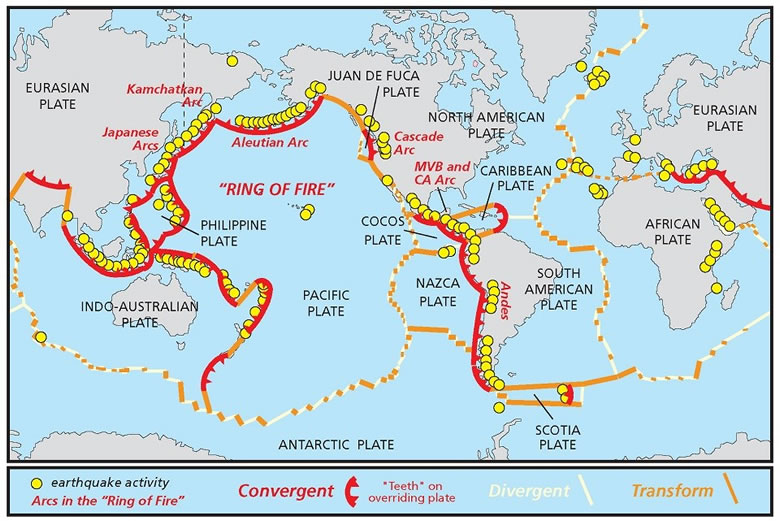
Tectonic Map Can Predict... |
Ring of Fire: pattern of volcanoes all around pacific plate
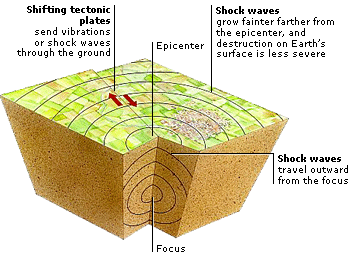
Transform faults: likely location of earthquakes. Hotspots: areas of esp. hot magma rising up to lithosphere
|
Practice FRQ 4.1 | Explain how subduction leads to volcanic activity. Subduction leads to volcanic activity by one plate going below another and it forces up magma to the lithosphere’s surface. For example, when continental-continental plates subduct, they force the plates up forming mountains. |

What is Soil? | Mix of geologic (rock) and organic (living) components
Plants: anchors roots of plants and provides water, shelter, nutrients (N, P, K, Mg) for growth Water: filters rainwater + runoff by trapping pollutants in pore spaces + plant roots. Clean water enters groundwater + aquifers. Nutrient Recycling: home to decomposers that break down dead organic matter + return nutrients to the soil Habitat: provides habitat for org. like earthworms, fungi, bacteria, moles, slugs | ||||||||||||||||||||||
Weathering and Erosion | Weathering
(Wind, rain, freezing/thawing of ice)
(Roots of trees crack rocks)
(Acid rain, acids from moss/lichen)
Erosion
| ||||||||||||||||||||||
Soil Formation |
Effects on Soil Form.
| ||||||||||||||||||||||
Soil Horizons | O-Horizon: layer of organic matter (plant roots, dead leaves, animal waste, etc) on top of soil
A-Horizon: aka topsoil; layer of humus (decomposed organic matter) and minerals from parent material
B-Horizon: aka subsoil; lighter layer below topsoil, mostly made of minerals w/little to no org. matter
C-Horizon: least weathered soil that is closest to the parent material, sometimes called bedrock | ||||||||||||||||||||||
Soil Degradation: The loss of the ability of soil to support plant growth | Loss of Topsoil: tiling (turning soil for ag.) + loss of vegetation disturbs soil and makes it more easily eroded by wind and rain.
Compaction: compression of soil by machines (tractors, bulldozers, etc.), grazing livestock, and humans reduces ability to hold moisture
Nutrient Depletion: repeatedly growing crops on the same soil removes key nutrients (N, P, K, Na, Mg) over time.
| ||||||||||||||||||||||
FRQ Practice | Design an investigation to measure the effect that climate has on soil formation. Identify the independent variable and dependent variable in your experiment. | ||||||||||||||||||||||
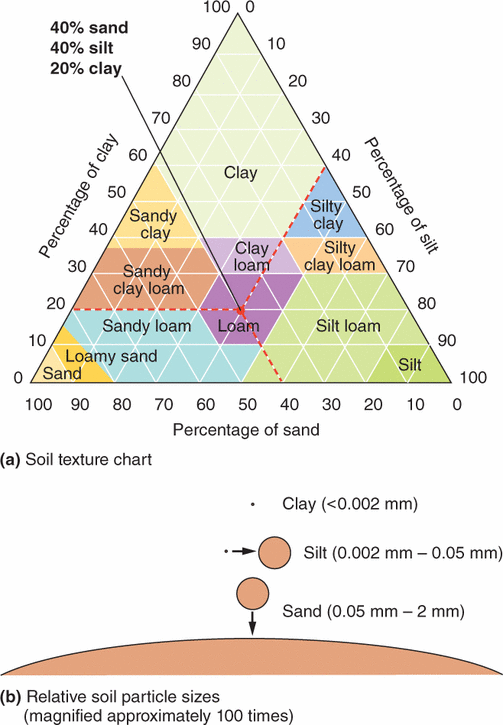
Soil Particle Size, Texture, and Porosity |
| ||||||||||||||||||||||
Soil Texture Chart |
| ||||||||||||||||||||||
Porosity, permeability, and H2O Holding Capacity |
Effect on Soil Fertility
| ||||||||||||||||||||||
Soil Fertility | Soil Fertility: ability of soil to support plant growth Nutrients
Water
| ||||||||||||||||||||||
Characteristics and Tests of Soil Quality |
| ||||||||||||||||||||||
4.3 Practice FRQ | Identify and describe one test that can be conducted on a soil sample. One test is the pH test. You test the pH to see how acidic the soil is which tells the nutrient availability. Explain how the results of the test could allow you to give advice to a farmer trying to grow crops in the soil. The results could help me give advice by telling me the acidity level and if it needs a base or an acid to obtain the highest nutrient availabiltiy. | ||||||||||||||||||||||
Gasses of Earth’s Atmosphere |
| ||||||||||||||||||||||
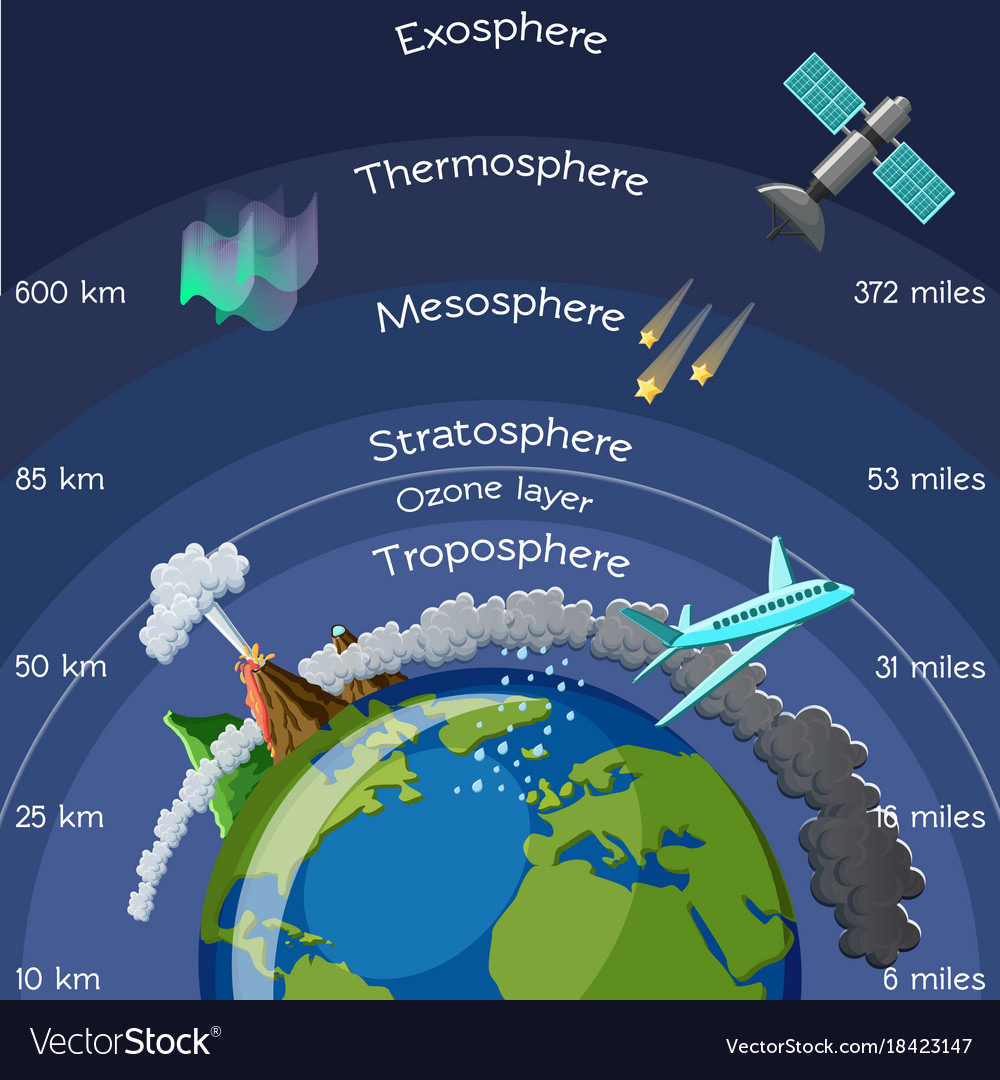
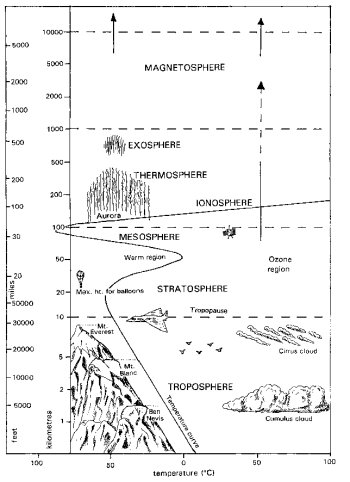
Characteristics of Layers
| Troposphere: Tropo = change (weather occurs here) - 0-16 km, most dense due to pressure of other layers above it
Stratosphere: “S” for second - 16-60 km; less dense due to less pressure from layers above
Mesosphere: Meso = for middle; 60-80 km, even less dense Thermosphere: Therm = hottest temp;
Exosphere: Outermost layer where atm. merges with space | ||||||||||||||||||||||
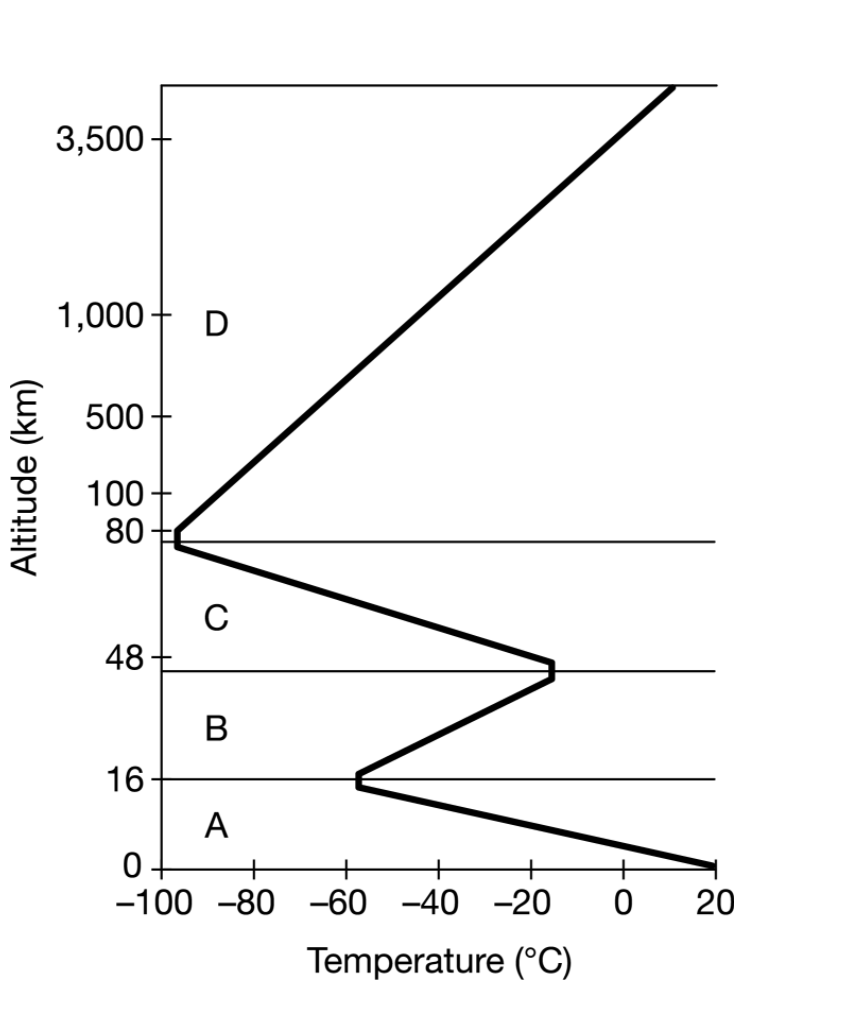
Temperature Gradient
| Troposphere: temp. decreases as air gets further from warmth of earth’s surface Stratosphere: temp. increases because top layer of stratosphere is warmed by UV rays (like pool surface) Mesosphere: temp. decreases because density decreases, leaving fewer molecules to absorb sun
Thermosphere: temp. Increases due to absorption of highly energetic solar radiation
| ||||||||||||||||||||||
FRQ 4.4 Practice
| Identify a layer of earth from the diagram that has an inverse relationship between temperature and altitude. The troposphere has an inverse relationship between temperature and altitude. Describe why this occurs. This occurs because the higher up you are it loses heat from the earth. So, altitude is going up while temperature is going down. | ||||||||||||||||||||||
Air Properties |
|
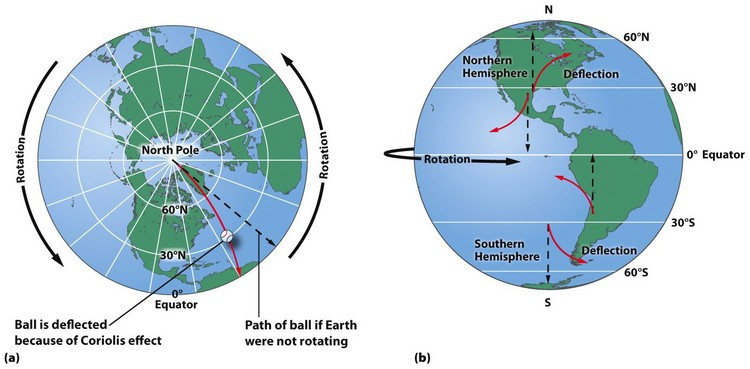
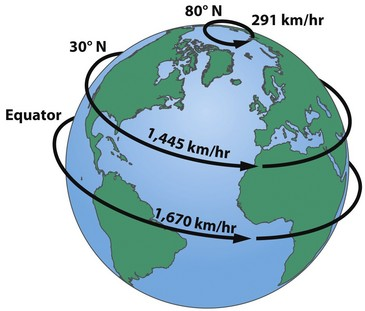
Coriolis Effect |
|
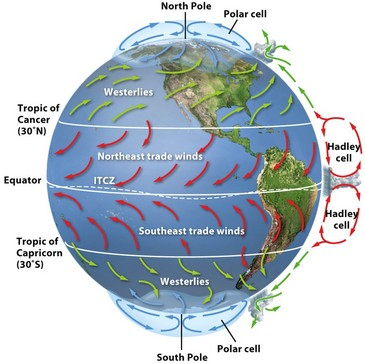
Global Wind Patterns |
30o = H Pressure 0o = L Pressure 30o = H Pressure 60o = L Pressure |
Hurricanes and Typhoons | |
Tornados | |
Practice FRQ 4.5
| Explain how the sun is responsible for the pattern of air circulation seen in cycle C. |
 60o = L Pressure
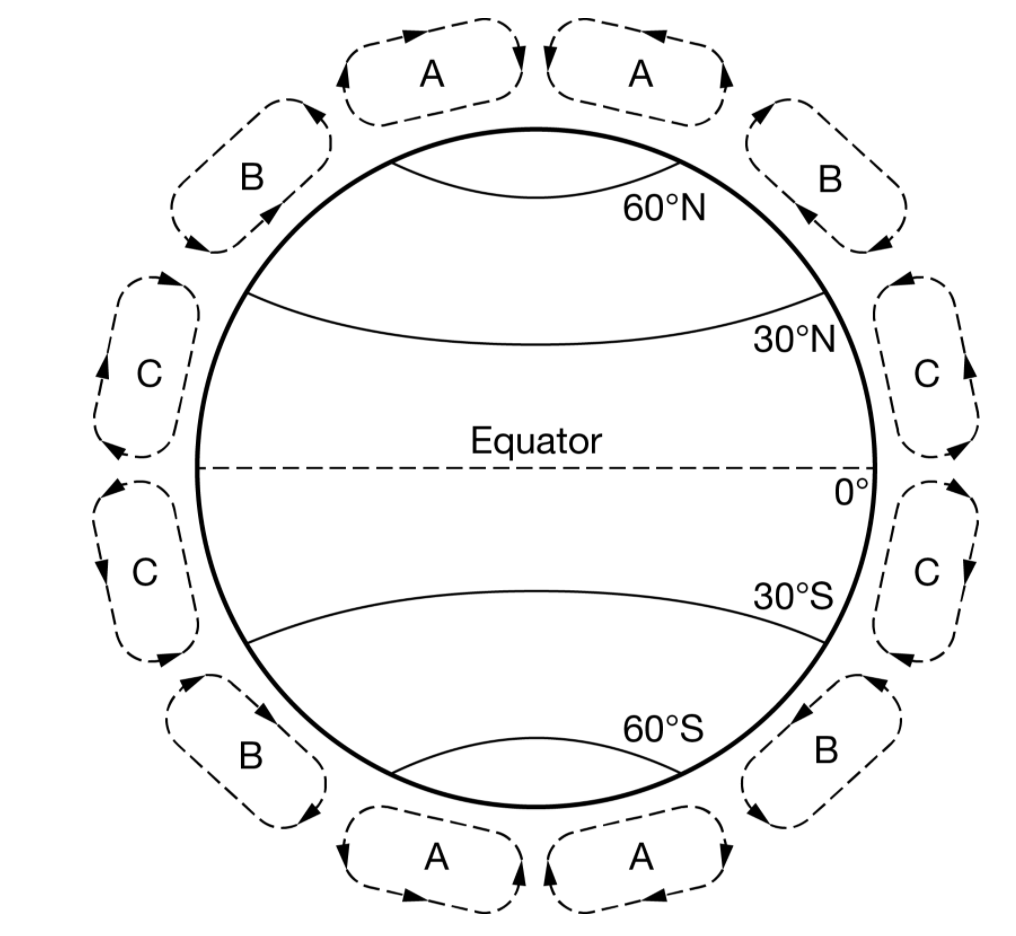
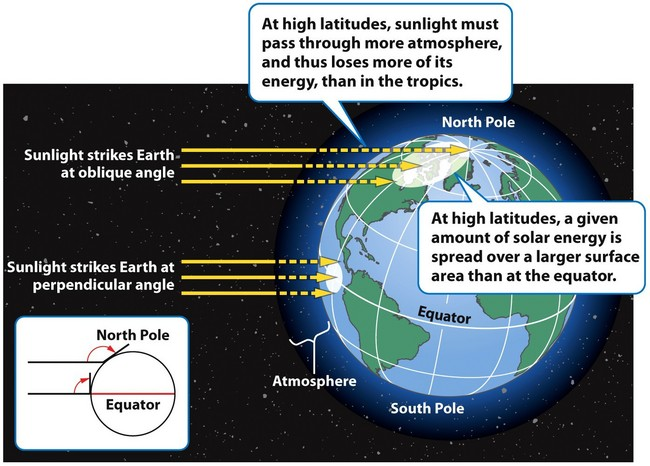
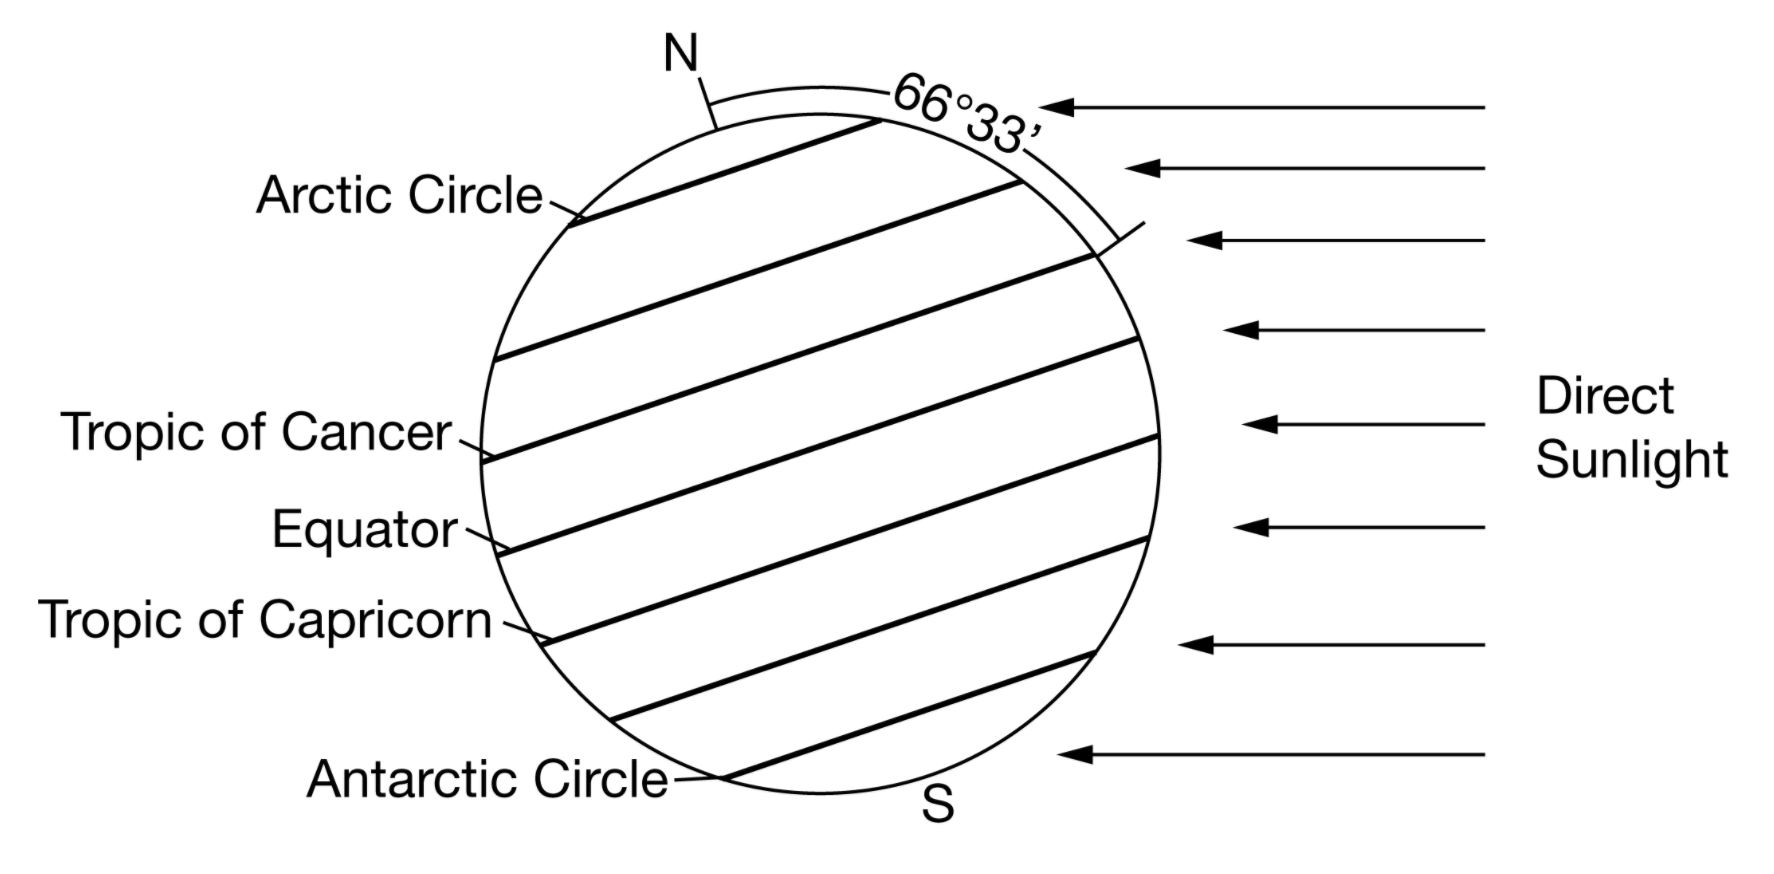
What causes seasons? What causes temperatures to be colder at the poles and warmer at the equator? | The earth’s spin axis Warmer at the equator because it is closer to the sun since this part of earth doesn’t rotate away. The poles are colder because of the earth’s tilt so it is tilted farther from the sun. | |||||||
Solar Intensity & Latitude |
| |||||||
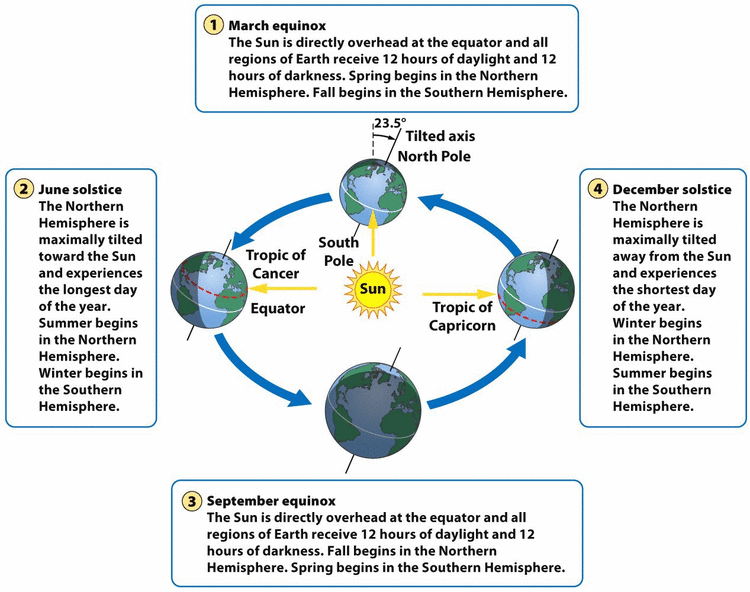
Solar Intensity & Season |
| |||||||
Tilt of Earth’s Axis Causes Variation in: |
| |||||||
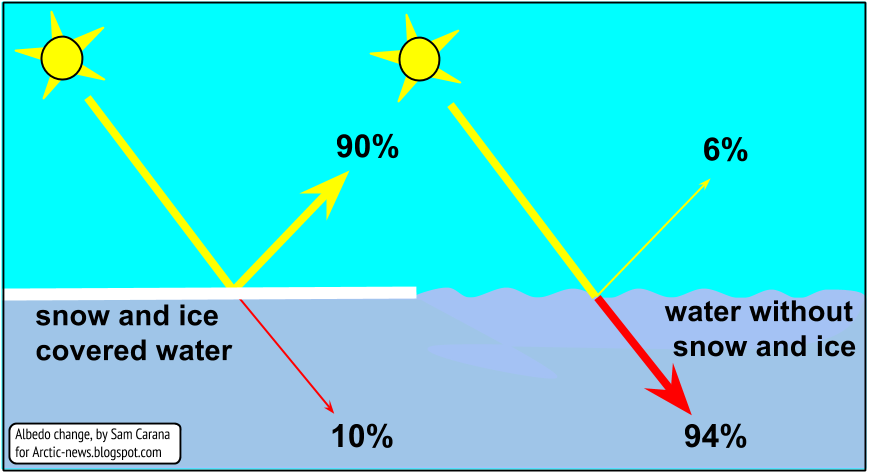
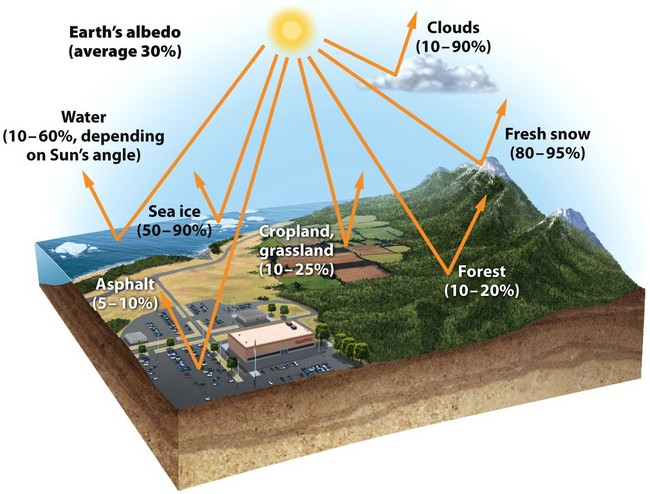
Albedo |
| |||||||
Albedo & Surface Temperature |
| |||||||
Practice FRQ 4.7 |
Identify which season is taking place in the Northern hemisphere in this diagram. Describe how the tilt of the earth’s axis is responsible for earth’s seasons. North is occurring in the Northern hemisphere. The tilt of the earth’s axis is responsible for the earth’s seasons because the hemisphere closer to the sun is experiencing summer and vice versa. | |||||||
Climate & Geography |
| |||||||
Rain Shadows |
| |||||||
Rain Shadow Ex. |
| |||||||
Practice FRQ 4.8 |
Describe the regional precipitation pattern you would expect for the portion of Mexico & central America indicated on the map. Justify your answer. | |||||||
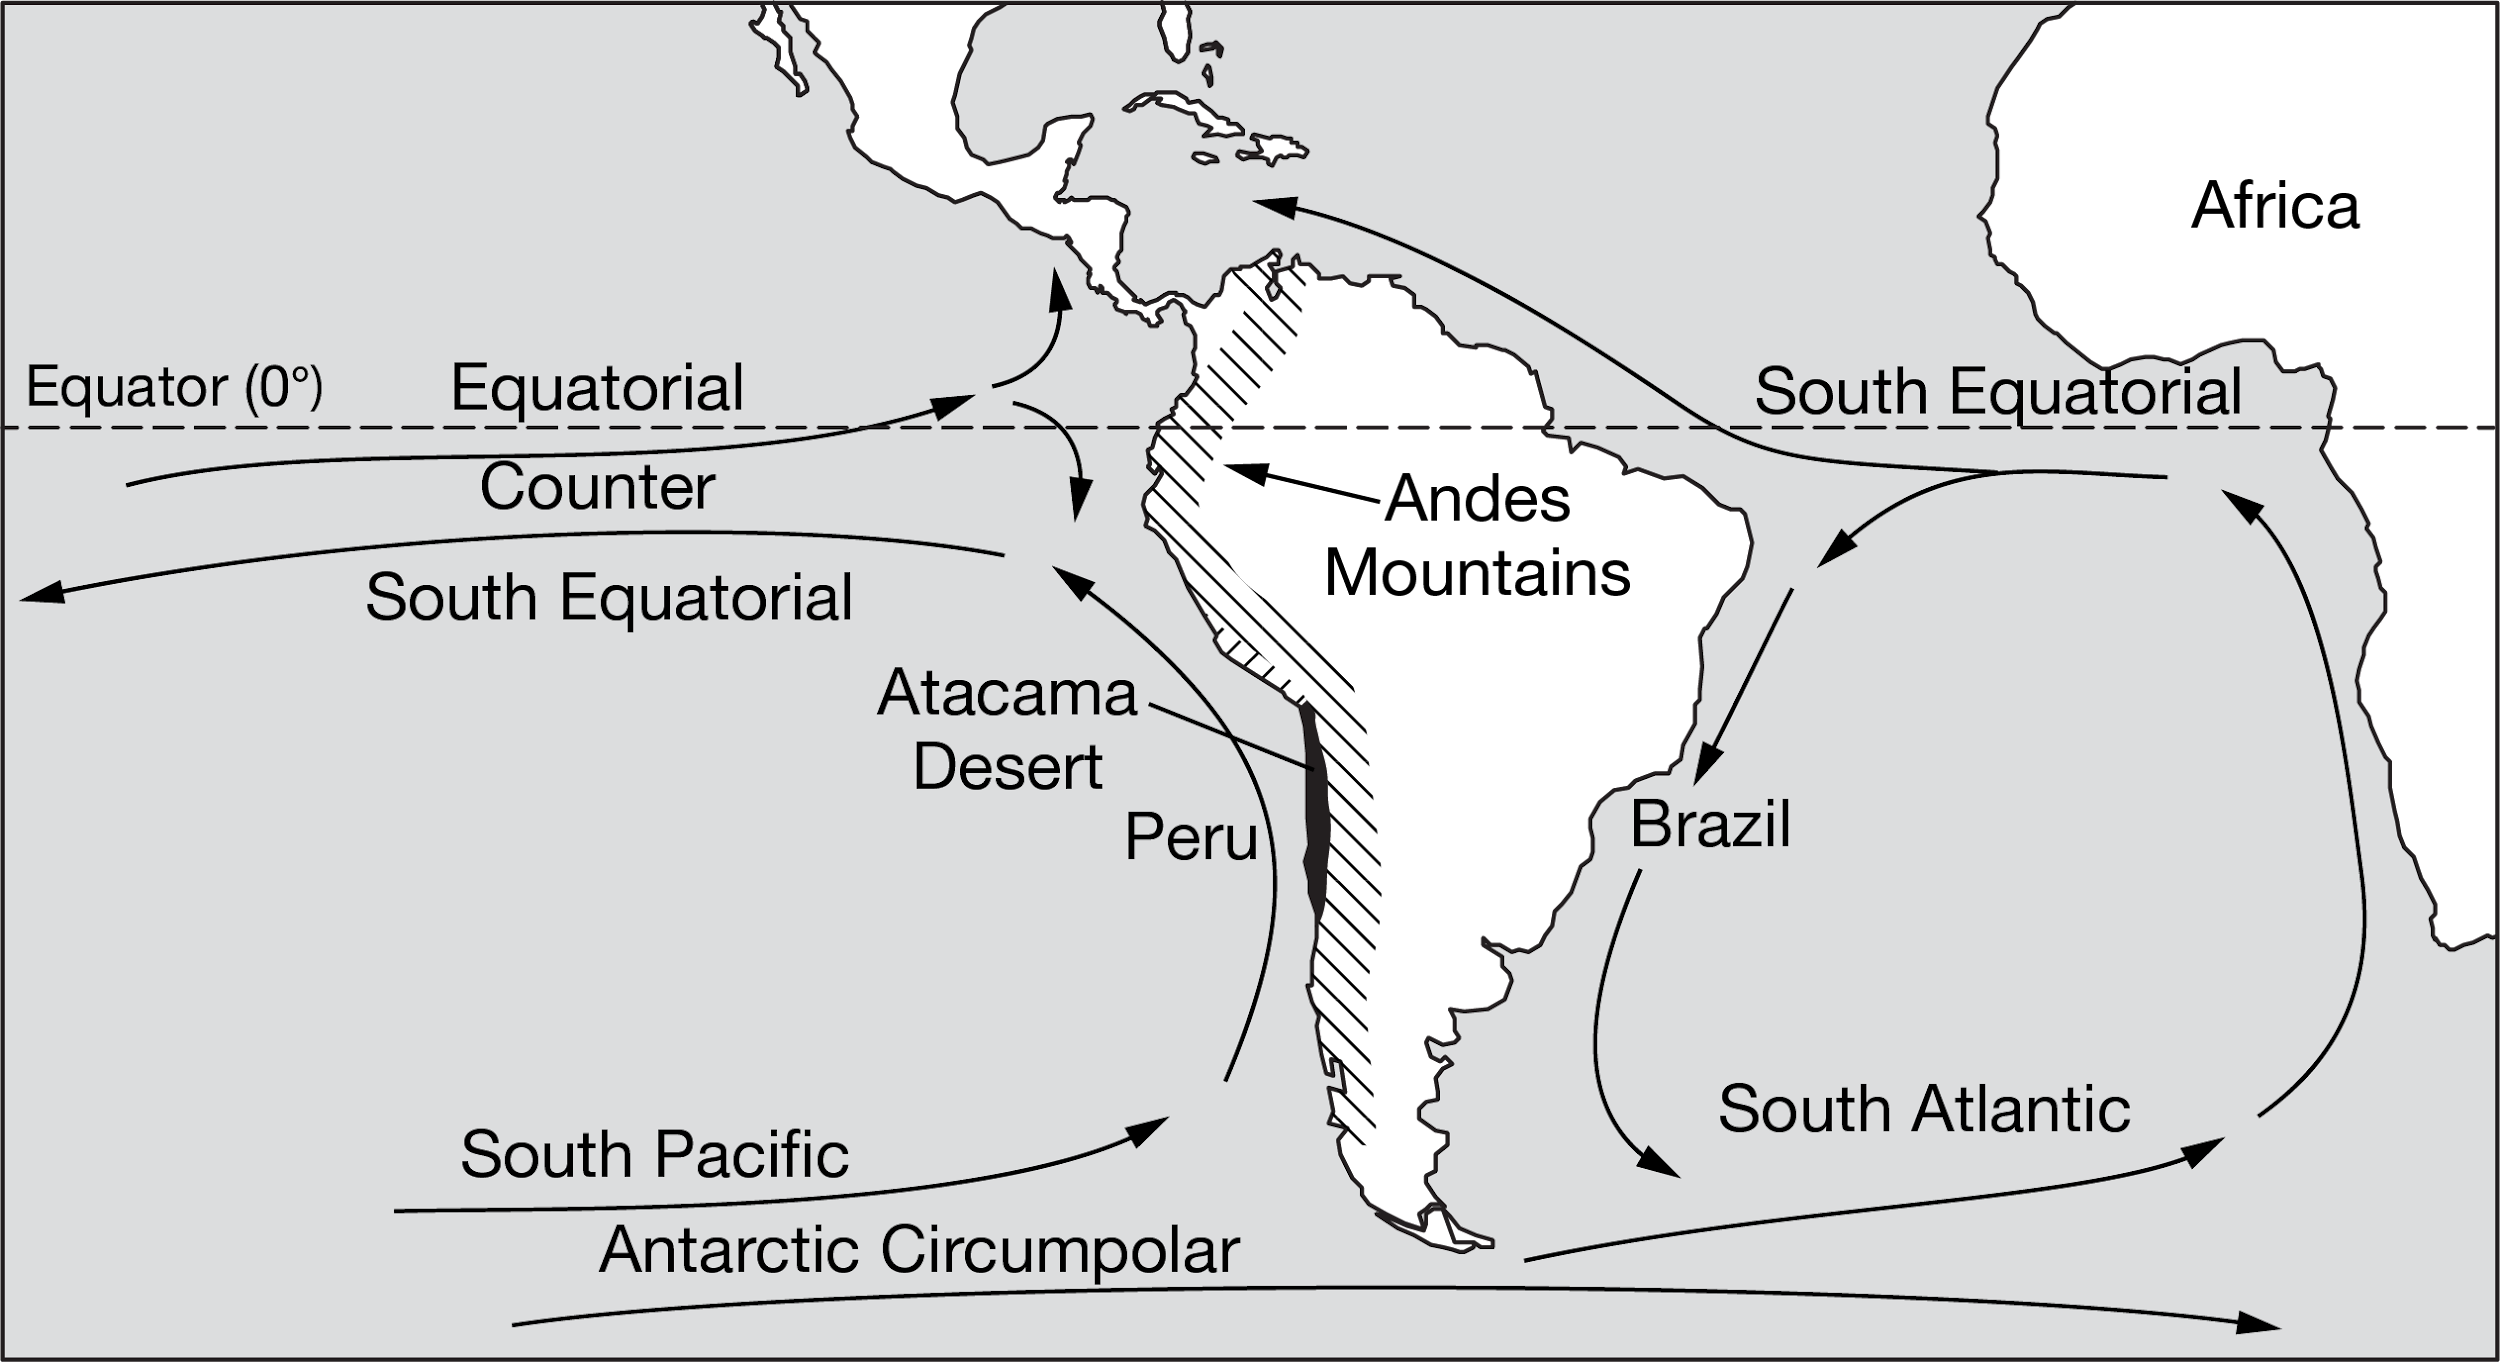
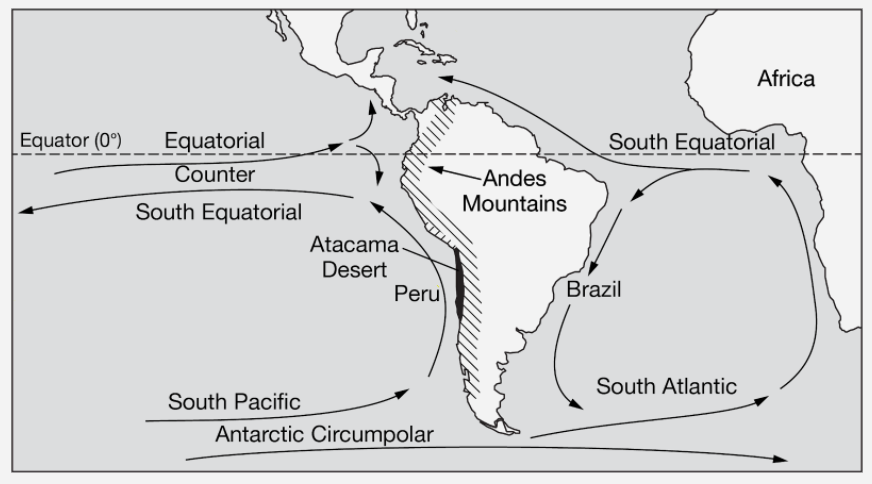
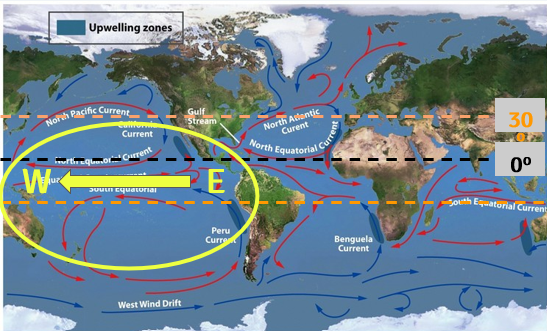
Global Ocean Surface Currents (Add markings to your map as seen in SLIDES) |
| |||||||
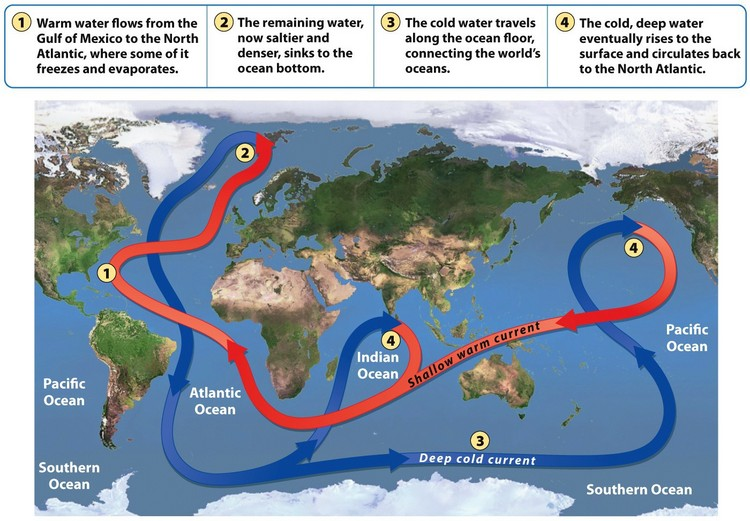
Thermohaline Circulation |
| |||||||
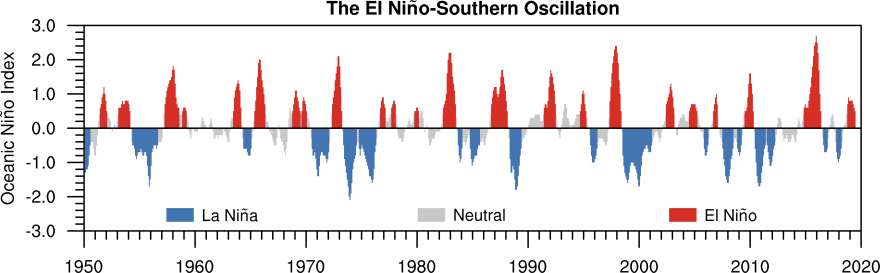
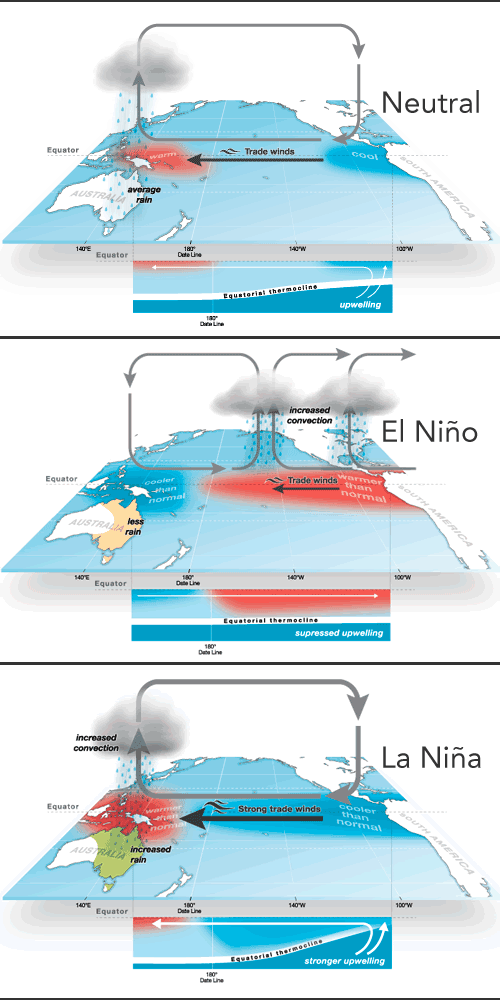
El Niño Southern Oscillation (ENSO) |
| |||||||
Normal Year |
| |||||||
El Niño |
| |||||||
La Niña |
| |||||||
Effects |
| |||||||
Practice FRQ 4.9 | Describe TWO environmental problems related to the conditions of an El nino event. Two environmental problems related to the conditions of El Niño are increased flooding and wildfires in Australia. There is an increase of flooding in the Americas due to a surplus in precipitation. Wildfires in Australia occur due to lack of rain and droughts. | |||||||


Unit 5 Land and Water Use
5.1 Tragedy of the Commons (TOC)
Tragedy of the commons: individuals will use shared/public resources in their own self-interest, degrading them.
Must be a public resource (not privately owned)
Must be degraded, overused, depleted, used-up in some way
Ex. Overgrazing, overfishing, water and air pollution, overuse of groundwater
Externalities: negative cost associated with a human action, that aren’t accounted for in the price (unintended side-effects)
How to solve:
Private land ownership
Fees or taxes for use
Taxes, fines, criminal charges for pollution or shared air/soil/water resources
5.2 Clearcutting
Direct effects of clearcutting | ||
Tree plantations: areas where the same tree species are repeatedly planted, grown, and harvested
| Increased soil and stream temperature:
| Flooding and Landslides
|
Deforestation Consequences:
| Soil erosion:
Warms water and makes it more turbid (cloudy) | |
| ||
5.3 The Green Revolution
The Green Revolution: shift in agriculture away from small, family operated farms to large, industrial-scale agribusiness
Increased use of mechanizations, GMOs, irrigation, fertilizers, and pesticides
Greatly increases efficiency of lands, short-term profitability, and food supply
Brings negative consequences (soil erosion, biodiversity loss, ground surface water contamination
Mechanization
Increased use of tractors for plowing and tilling fields, and combines for harvesting = increased yields + profits
Increased reliance on fossil fuels (gasoline/diesel fuel)
Emits GHGs to atmosphere 🡪 climate change
Heavy machinery also compacts soil, decreasing H2O holding capacity
Makes topsoil more prone to erosion
GMOS: genetically modified crops have genes for drought tolerance, pest resistance, faster growth, and larger fruit/grain
Increases profitability with fewer plants lost to drought, disease, or pests + larger plant size + yield/acre
GMO crops are all genetically identical so genetic diversity is decreased and susceptibility to disease or pest is increased
Irrigation: drawing water from the ground or nearby surface waters and distributing it on fields to increase plant growth
make agriculture possible in many parts of the world that are naturally to dry
can deplete groundwater sources, especially aquifers
over watering can drown roots ( no O2 access) and causes soil salinization
Pesticides: increase in use of synthetic pesticides – chemicals sprayed on crops that kill weeds, insects, rodents, another pests that eat or damage crops
Increase yield and profits with fewer plants lost to pests
Can wash off crops in runoff and kill or harm non-target species in local soils or waters
5.4 Impact of Agricultural Practices
Monocropping: growing one single species (corn, wheat, soy) of crop
Highly efficient for harvest, pesticide and fertilizer application
Greatly decreases biodiversity (more prone to pests, fewer natural predators)
Increases soil erosion (crops harvested all at once and soil is left bare)
Decreases habitat diversity for species living in the area
Tilling: mixing and breaking up soil to make planting easier (also loosens soil for roots)
Increases erosion by loosening topsoil, breaking up leftover root structure from harvest
Loss of organic matter and topsoil nutrients over time
Increased PM in air and sediments in nearby water (turbidity)
Slash and Burn: cutting down vegetation and burning it to clear land for agriculture and return nutrients in plants to soil
Deforestation (loss of habitat, biodiversity)
Releases CO2, CO, NO2 – all lead to global warming
Synthetic (inorganic) fertilizers
Don’t return organic matter to soil; no increased H2O holding capacity and no soil decomposers
Leaching: water carries excess nutrients (nitrates and phosphates) into groundwater or into surface water (as runoff)
Contaminates groundwater for drinking
Causes eutrophication of surface waters
5.5 Irrigation
Furrow Irrigation
| Drip Irrigation
|
Flood Irrigation
| Spray Irrigation
|
Waterlogging: overwatering can saturate the soil, filling all soil pore space with water
Doesn’t allow air into pores, so roots can’t take in O2 they need
Can stunt growth or kill crops
Solution: drip irrigation, or soil aeration
Soil Salinization: the process of salt building up in soil overtime
Groundwater: used for irrigation naturally has small amounts of salt. Over time a toxic amount of soil can accumulate
Solution: drip irrigation, soil aeration, flushing with fresh water, switch to freshwater source
Global Human water use
Industrial: power plants, metal/plastic manufacturing
Municipal: households (toilet, shower, drinking water)
Agriculture: water for livestock, irrigation water for crops
Aquifers and Groundwater
Groundwater: water stored in pore space of permeable rock and sediment layers
Aquifers: useable groundwater deposits for humans
Replenished by groundwater recharge (rain water percolating down through soil into aquifer)
Confined aquifers recharge are longer-term water deposits that recharge more slowly
Depletion of Aquifers
Saltwater intrusion: excessive pumping near coast lowers water table pressure, allowing saltwater to seep into groundwater
Cone of depression: forms when water table is lowered by excessive pumping, depleting water and drying nearby walls.
5.6 Pest Control Methods
Pesticides: chemicals that are toxic to pests
Rodenticides – kill rodents
Fungicides – kill fungi
Insecticides – kill insects
Herbicides – kill plants
Can cause pest to become resistant to pesticide with overuse – Pesticide treadmill
Genetic biodiversity gives some pest resistant traits to pesticide
Pesticide artificially selects for pest with resistance by killing all the non-resistant individuals, leaving only resistant ones
GMOs (Genetic Modification): gene for pest resistant trait is added to the plant through genetic modification
Bt corn with bacteria gene that produces Bt crystals toxic to pests
Roundup Ready crops are GM to be resistant to broad herbicide (roundup) meaning roundup will kill weeds, but not crops
Roundup ready crops have increased herbicide (glyphosate) use since crops can’t be harmed by it
Bt corn has decreased insecticide use, since corn makes its own insecticide
GM crops are all genetically identical (clones) so there is no genetic diversity in population
if there is a disease or pest that does affect the GM crops, they’re all vulnerable and there’s no chance of a genetic mutation providing an adaptive trait
5.7 Meat Production Methods
CAFOS: also known as feedlots – densely crowded method where animals are fed grain (corn to raise them as quickly as possible)
Maximize land use and profit (most meat production per/unit of area)
Minimizes cost of meat for consumers
Given antibiotics and growth hormones to prevent disease outbreak and speed meat production
Animals produce large volumes of waste which can contaminate nearby surface or groundwater
Produces large amounts of CO2, CH4 (methane), and N2O (greenhouse gasses → climate change)
Manure Lagoons: large, open storage pits for animal waste
Waste contain ammonia, hormones, antibiotics, fecal coliform bacteria (e. coli)
Heavy rain can flood lagoons and contaminate nearby surface and ground water with runoff
Denitrification of ammonia in manure produces N20 (extremely powerful GFG)
Can be emptied and buried in landfills, or turned into fertilizer pellets.
Free Range Grazing: animals (usually cows) graze on grass and grow at a natural rate without growth hormones
No need for antibiotics with dispersed population
Doesn’t require production of corn to feed animals
Waste is dispersed over land naturally, acting as fertilizer instead of building up in lagoons
Animals can graze on land to dry for most crop growth
Requires more total land use/pound of meat produced
Most expensive to consumer
Overgrazing:
Too many animals grazing an area of land can remove all the vegetation (grass) which leads to topsoil erosion
Animals also compact soil, decreasing water holding capacity 🡪 more erosion
Desertification can occur if plants are killed by overgrazing and soil is compacted so much that it can’t hold enough water anymore
Rotational grazing (moving animals periodically) can prevent overgrazing
Can even increase growth of grass by distributing manure (natural fertilizer) and clipping grass back to size where growth is most rapid
Inefficiency of meat: producing meat for humans to eat is far less efficient than producing plants in terms of energy, land and water use
Energy: all of the energy needed to plant, grow, harvest plants to feed animals
Land: all of the energy needs to grow plants to feed animals plus room animals take up
Water: all of the water for crops that animals eat plus the water the animals’ drink
5.8 Impacts of Overfishing
Fisheries: population of fish used for commercial fishing
Fishery collapse: when overfishing causes 90% population decline in a fishery
Population may never recover from fishery collapse due to decreased biodiversity, inability to find mates, and inbreeding depression
Decreases genetic biodiversity of fish populations and species biodiversity of ocean ecosystems if species are lost from ecosystem
Economic consequences: lost income for fishermen, lost tourism dollars for communities
Bottom Trawling: especially harmful fishing method that involves dragging a large net along floor
Bycatch: unintended species like dolphins, whales, turtles caught in nets
Stirs up ocean sediment (turbidity) and destroys coral reef structure
As we deplete large, predatory fisheries, we move down to smaller fish species
Depletion of small fish populations limits fishery recovery and decreases food supply of marine mammals and seabirds
5.9 Mining
Mining Basics
Ore: commercially valuable deposits of concentrated minerals that can be harvested and used as raw materials
Metals: elements that conduct electricity, heat, and have structural properties for building
Reserve: the known amount of a resource left that can be mined usually measured in years left of extraction
Overburden: soil, vegetation, and rocks that are removed to get to an ore deposit below
Tailing and slag: leftover waster material separated from the valuable metal or mineral within ore
Surface mining
Removal of overburden to access ore near surface
Different types: open pit, strip, mountaintop removal, placer
Removal of vegetation and soil (topsoil erosion, habitat loss, increased stream turbidity)
As ore near surface becomes more scarce, mining moves deeper underground to subsurface mining
Subsurface mining
More expensive due to higher insurance and health care costs for workers
Risks: poor ventilation leading to toxic gas exposure, mine shaft collapse, injury from falling rock, lung cancer, asbestos, fires, explosions
Vertical “shaft” drilled down into ground
Environmental impacts of mining
Rainwater carries sulfuric acid into nearby streams, or infiltrates groundwater
Lowers pH of water, making toxic metals, like mercury and aluminum more soluble in water sources
Methane release: coal mining releases methane gas from rock around coal
PM release: coal mining especially, release lots of soot and other particulates that can irritate human and animal lungs
Acid mine drainage: rainwater leaks into abandoned mine tunnels and mixes with pyrite forming sulfuric acid
Mine reclamation: process of restoring land to original state after mining has finished
5.10 Urbanization
Urbanization: removing of vegetation to convert natural landscape to city (urban)
Replaces soil, vegetation, wetlands with impervious surfaces (concreate, asphalt, cement) which don’t allow water to infiltrate into the ground
CO2 emissions
Cement production
Construction machinery
Deforestation (loss of future carbon sequestration + decomposition of cut trees)
Landfills needed for disposing trash from large population
Urbanization prevents groundwater recharge, causing precipitation to runoff into local bodies of water
Urbanization in coastal cities
Population growth in coastal cities can lead to saltwater intrusion due to:
Excessive groundwater withdrawal near coast lowering water table pressure, allowing saltwater to seep into groundwater
Sea level rise due to warming of ocean (thermal expansion) and melting of ice caps (increasing ocean volume) can contaminate fresh groundwater with salt
Suburbs: less dense areas surrounding urban areas
Urban sprawl: population movement out of dense, urban centers to less dense suburban areas surrounding the city
Cheaper property in suburbs, cars making travel easy
Urban sprawl causes expanded highways systems, increase in driving
Solutions:
Urban growth boundaries: zoning laws set by cities preventing development beyond a certain boundary
Public transport and walkable city design that attract residents to stay
Mixed land use: residential, business, and entertainment buildings all located in the same are of a city
5.11 Ecological Footprint
Ecological Footprint: measure of how much a person/group consumes, expressed in an area of land
Factors (land required for):
Food production
Raw materials (wood, metal, plastic)
Housing
Electricity production
Coal, natural gas, solar, wind, etc.
Disposing waste produced (landfill space)
Ecological Footprint: measured in land (gha – global hectare) which is biologically productive hectare (2.47 acres)
Carbon Footprint: measured in tonnes of CO2 produced per year
all CO2 released from an individual or groups consumption and activities
material goods
food production
energy use (gasoline, heat, electricity)
Factors that Increase Footprint | Factors that Decrease Footprint |
|
|
ecological footprint can also be expressed in “number of earths” required if the entire world consumed same level of resources as a given induvial or group
5.12 Sustainability
Sustainability: consuming a resource or using a space in a way that does not deplete or degrade it for future generations
Maximum sustainable yield: the maximum amount of a renewable resource that can be harvested without reducing or depleting the resource for future use
Environmental Indicators of Sustainability: factors that help us determine the health of the environment and guide us towards sustainable use of earth’s resources
Biodiversity:
Genetics, species, and ecosystems
Higher biodiversity = healthier ecosystems
Declining biodiversity can indicate pollution, habitat destruction, climate change
Global extinction rate = strong environmental indicator since species extinction decreases species richness of earth
Food Production
Indicates ability of earth’s soil, water, and climate to support agriculture
Major threats to food production = climate change, soil degradation (desertification, topsoil erosion), groundwater depletion
Increasing meat consumption = further strain on food production (takes away water and land from grain production)
Global grain production per capita has leveled off and shows signs of decline recently
Atmospheric Temperature & CO2
Life on earth depends on very narrow temperature range
CO2 is GHG (traps infrared radiation and warms earth’s atmosphere)
Increased CO2 = increased temperature
Deforestation (loss of CO2 sequestration) and combustion of FF (emission of CO2) increase atmosphere CO2
Increasing CO2 = unsustainable (dries out arable (farmable) land, destroys habitats, worsens storm intensity)
Human Population and Resource Depletion
As human population grows, resource depletion grows
Resources are harvested unsustainably from natural ecosystems and degrade ecosystem health
More paper (lumber) = deforestation
More food = soil erosion, deforestation, groundwater depletion
More travel = fossil fuel mining = air, water, soil pollution, habitat destruction
5.13 Reducing Urban Runoff
Environmental Consequences of Urban Runoff
Decreased infiltration (groundwater recharge)
Rain washes pollutants into storm drains and into local surface water
Pollutants and effects
Salt (plant and insect death)
Sediment (turbidity)
Fertilizer (eutrophication)
Pesticides (kill non target species)
Oil and gasoline (suffocate fish/ kill aquaculture insects)
Solutions | |
Permeable Pavement
| Rain Garden
|
Public Transit
| Building Up, Not Out
|
5.14 Integrated Pest Management (IPM)
IPM Basics:
Using a variety of pest control methods that minimize environmental disruption and pesticide use
Researching and monitoring pests and targeting methods to specific pest life cycles
Biocontrol
Crop rotation
Intercropping
Biocontrol: introducing a natural predator, parasite, or competitor to control the pest population
| Crop Rotation: many pests prefer one specific crop or crop family. They lay eggs in the soil, so when larvae hatch, they have preferred food source
| Intercropping: “push-pull” system can bused
| |
Benefits and Drawbacks of IPM | |||
|
| ||
5.15 Sustainable Agriculture
Soil Conservation: Agricultural techniques that minimize erosion
Prevents loss of:
Nutrients in topsoil
Soil moisture
Decomposers in topsoil
Organic matter that traps soil moisture
Contour plowing
| Terracing
| Perennial Crops
|
Windbreaks
| No Till
| Strip Cropping
|
Improving Soil Fertility: methods of restoring nutrient levels in soil
Crop rotation: replanting same crops continuously depletes soil of the same nutrients
Crop rotation can allow soil to recover from nitrogen-demanding crops like corn
Peas/beans (legumes) have nitrogen fixing bacteria in their root nodules that can return nitrogen to the soil
Green Manure: green manure is leftover plant matter from a cover crop – a crop planted in the offseason, between harvest and replanting of main crop
Cover crop roots stabilize soil limiting topsoil erosion
Remains of cover crop (green manure) left on field breakdown to release nutrients into the soil
Limestone: releases calcium carbonate (base) which neutralizes acidic soil
Acidic soil has high H+ ion concertation, which displaces + charge nutrients from soil (leeching them out)
Acidic soil also makes toxic metals (aluminum) more soluble in soil
Calcium is needed plant nutrient as well
Rotational Grazing: regular rotation of livestock to different pastures to prevent overgrazing
Overgrazing can kill plants, compact soil, and lead to erosion of topsoil
Rotational grazing can actually promote pasture growth at faster than normal rate
Clips grass back to length where growth is fastest and encourage deeper root growth
5.16 Aquaculture
Aquaculture
Raising fish, or other aquatic species in cages/enclosures underwater
Benefits
Requires only small amount of water, space, and fuel
Reduce risk of fishery collapse (90% population decline in a fishery)
Doesn’t take up any land space (compared to beef, pork, chicken)
Drawbacks
High density produces high concentration of waste (e. Coli and eutrophication risks)
High density increases disease risk, which can be transmitted to wild population as well
May introduce non-native species or GMOs to local ecosystem if captive fish escape
Fish are fed antibiotics which can contaminate water via their waste
5.17 Sustainable Forestry
Ecologically sustainable forestry
Forestry (using trees for lumber) that minimizes damage to ecosystem (habitat destruction, soil erosion, etc.)
Selective cutting or strip cutting
Only cutting some of the trees in an area (biggest and oldest) to preserve habitat (biodiversity) and topsoil
Using human and pack animal labor to minimize soil compaction from machinery
Replanting same species being logged
Maximizes long-term productivity of land and preserves forest for future generations
Using recycled wood or simply reusing without recycling
Wood can be chipped and used as mulch for gardens or agricultural fields
Reforestation: replanting of trees in areas that have been deforested
Selectively removing diseased trees to prevent spread of infection through entire forests
Fire suppression: the practice of putting out all natural forest fires as doon as they start
Prescribed burns: dead biomass is fuel for large forest fires, use of small controlled fires to burn dead biomass to prevent forest fires
Rate of consumption
rate of use must be at or below rate of regeneration for renewables
 fossil fuels will run out because they take far long to regenerate than the rate we use them
6.2 Global Energy Consumption
Developed vs. Developing Countries
developed nations use more energy on a per capital basis, but developed nations use more energy in total (higher population)
the average US resident uses 5x as much energy as the world average
developing nations are still industrializing and population is still growing rapidly
It will also increase on a per/person basis as their economies industrialize and residents achieve higher standards of living.
Fossil Fuels: Most Used Energy Source
Fossil fuels are by far the most common fuel source globally
Hydroelectric energy is the second largest source
Nuclear Is the third largest source
Development Increase Fossil Fuel Consumption
Many residents of less developed nations depend on subsistence fuels – biomass that they can easily gather/purchase
Economic development 🡪 affluence (wealth) 🡪 higher per capita GDP 🡪 energy use
As developing nations develop, fossil fuel consumption will increase
Factors that Affect Energy Source Use
Availability: fossil fuel use depends on discovered reserves and accessibility of these reserves
Price: fossil fuel prices fluctuate dramatically with discovery of new reserves or depletion of existing ones
Fracking open new natural gas reserves, increases availability, decreasing price, increasing use
Government regulation: government can mandate certain energy source mixes
Government cannot directly raise or lower prices of energy sources
Government can use:
Tax increases to discourage companies from building fossil fuel power plants
Rebates or tax credits to encourage companies building renewable energy power plants
6.3 Fuel Types and Uses
Subsistence Fuels
Biomass fuel sources that are easily accessible; often used in developing countries as a home heating or cooking fuel
Wood (and charcoal) are two of the most common fuel sources in developing nations
Wood is free/cheap to cut down and utilize as fuel; can cause deforestation and habitat loss
Charcoal is made by heating wood under low oxygen conditions for a long time
Peat is partially decomposed organic matter found in wet, acidic ecosystems like bogs and moors
Can be dried and used as a biomass fuel source
Coal Formation
Pressure from overlying rock and sediment layers compacts peat into coal over time
In order of energy density and quality: lignite 🡪 bituminous 🡪 anthracite
The deep a coal reserve is buried, the more pressure from overlying rock layers and the more energy dense
Because higher energy density means more energy released when a fuel source is burned, anthracite is the most valuable form of coal (highest quality)
Natural Gas
Decaying remains of plants and animals (mostly marine life) are buried under layers of rock and converted by pressure into oil (petroleum) and natural gas over time
Natural gas is mostly methane and is found on top of trapped oil (petroleum) deposits
Forms when oil is trapped in a porous, sedimentary rock, underneath a harder impermeable rock layer that doesn’t let the gas escape
Considered the cleanest fossil fuel (produces the fewest air pollutants and least CO2 when burned)
Crude Oil (petroleum)
Decaying organic matter trapped under rock layers is compressed into oil over time
Extracted by drilling a well through the overlying rock layers to reach the underground deposit and then pumping liquid oil out under pressure
Can also be recovered from tar sands (combination of clay, sand, water, and bitumen)
Bitumen Is a thick, sticky, semi-solid form of petroleum (not liquid)
Extracting and using oil from tar sands is extremely energy and water intensive
Fossil Fuel Products
Crude oil (petroleum) is converted into lots of different products through the process of fractional distillation
Crude oil is burned in a furnace and vapor passes into a column where different hydrocarbons are based on their boiling points
6.4 Distribution of Natural Energy Resources
Fossil Fuel Energy Reserves | ||
Coal | Natural Gas | Oil |
~100-150 years
| ~50-60 years
| ~50 years
|
Fracking and Shale Gas
Hydraulic fracturing (fracking) is a method of natural gas extraction that has extended access to natural gas
Gas trapped in semi-permeable, sedimentary rock layers, such as shale, is released by cracking the rock with pressurized water
Fracking natural gas from shale rock increase and extends supply of natural gas
Shale Gas Reserves
Fossil fuels are non-renewable, and will eventually be depleted, but short-term economic profit still drives extraction and use
Tar/Oil Sands
Tar or oil sands are bitumen deposits where crude oil can be recovered, but with higher water and energy inputs
Canada (Alberta region) = world’s largest oil sands reserve
6.5 Distribution of Natural Energy Resources
Fossil Fuel Combustion
Reaction between oxygen and fossil fuels that release energy as heat and produces CO2 and H2O as products
Methane, gasoline, propane, butane, and coal are al fossil fuels (hydrocarbons) that release energy in the same way
Fossil Fuels to Generate Electricity
The #1 source of electricity production globally is coal, followed by natural gas
These steps of electricity generation are the same, no matter what you’re burning to produce the initial heat
Heat 🡪 water into steam 🡪 steam turns a turbine 🡪 turbine powers generator 🡪 generator produces electricity
Coal, oil, natural gas, biomass, and trash can all be burned to drive this same process and create energy
Environmental Consequences: Coal
Habitat destruction to clear land for mining
Produces pollutants and releases CO2 (GHG 🡪 global warming)
Release more CO2 than any other fossil fuel when burned for electricity generation
Releases soot and ash, which can irritate respiratory tracts
Produces toxic ash contaminate with lead, mercury, and arsenic
Generating Electricity
Coal is ~30% efficient as a fuel source for generating electricity (30% of energy from the bonds in the hydrocarbons are converted to electricity)
Much of the energy “lost” or not converted into electricity escapes as heat
Cogeneration: when the heat produced from electricity generation is used to provide heat (air and hot water) to a building
CHP (combined heat and power) systems are close to 90% efficient (much better than coal/NG alone)
Oil/Petroleum Extraction
Extracted by drilling a well through the overlying rock layers to reach the underground deposit and then pumping liquid oil out under pressure
Can also be recovered from tar sands (combination of clay, sand, water, and bitumen)
Bitumen is a thick, sticky, semi-solid form of petroleum (noy liquid)
Extracting and using oil from tar sands is extremely energy and water intensive
Environmental Consequences
Tar Sands
Habitat destruction to clear land for: roads, drilling equipment, digging through ground surface to reach deposits
Ground or nearby surface water depletion (H2O needed for steam and for washing impurities from bitumen at refinery)
Crude Oil/ Petroleum
Possibility of spill (either from tanker ships or pipelines breaking
Habitat loss or fragmentation when land is cleared for roads, drilling equipment, pipelines
Fracking
Possibility of well leaking and contaminating groundwater with fracking fluid (salt, detergents, acids) or hydrocarbons
Ponds can overflow or leach into ground and contaminate surface or ground waters with fracking fluid (salt, detergents, acids)
Depletion of ground or surfaces waters nearby (as they’re drawn from for fracking fluid)
Fracking (Hydraulic fracturing)
Used to extract natural gas from sedimentary rock
Vertical well is drilled down to sedimentary rock layer, then turns horizontally into the rock layer
Perforating gun cracks (fractures) the rock layer around horizontal well, making it more permeable
Fracking fluid (water, salt, detergents, acids) is pumped into well at very high pressure to crack the rock even more and allow natural gas to flow out
Flowback water: (used fracking fluid) flows back out well and is collected and stored in containers or ponds nearby
6.6 Nuclear Energy
Nuclear Fission and Radioactivity
A neutron is fired into the nucleus of a radioactive (unstable) element, such as uranium
Nucleus breaks apart and releases lots of energy (heat) + more neutrons that break more nuclei apart, releasing more energy (chain reaction)
Radioactivity refers to the energy given off by the nucleus of a radioactive isotope (uranium-235)
Radioactive nuclei decay, or breakdown and give off energy (radiation) even without fission; nuclear fission just releases tons of energy all at once
Radioactive Half-life = the amount of time it takes for 50% of a radioactive substance to decay
Generating Electricity
Same electricity generation process as with FFs, just uranium fission to heat water in steam
Heat 🡪 water into steam 🡪 steam turns turbine 🡪 turbine powers generator 🡪 generator produces electricity
U-235 stored in fuel rods, submerged in water in reaction core; heat from fission turns H20 🡪 steam
Control rods are lowered into reactor core to absorb neutrons and slow down the reaction, preventing meltdown (explosion)
Water pump brings in cool water to be turned into steam and also cools reactor down from overheating
Cooling tower allows steam from turbine to condense back into liquid and cool down before being reused
Nonrenewable but cleaner than FFs
Nuclear energy is NONRENWABLE because radioactive elements like Uranium are limited
Other drawbacks of nuclear energy include possibility of meltdown and radioactive contaminations
Spent fuel rods: used fuel rods remain radioactive for millions of years and need to be stored in lead containers on site at nuclear power plants
Mine tailings: leftover rock and soil from mining may have radioactive elements that can contaminate water or soil nearby
Water use: nuclear powerplants require lots of water and can deplete local surface or groundwater sources
Thermal pollution: hot water from power plants released back into surface waters can cause thermal shock
Nuclear Meltdowns
Three Mile Island (US): partial meltdown due to testing error; radiation released but no deaths or residual cancer cases
Fukushima (Japan): an earthquake and tsunami triggered cooling pump failure that lead to meltdown (explosion of reactor core) and widespread radiation release
Chernobyl (Ukraine): stuck cooling valve during test lead to complete meltdown (explosion of reactor core), several deaths and widespread radiation release
Environmental consequences of meltdowns: genetic mutations and cancer in surrounding people, animals and plants due to radiation released from reactor core
Contaminated soil: radiation can remain in soil and harm plants and animals in the future
Radiation spread: radiation can be carried by the wind over long distances; affecting ecosystems far from the meltdown site
6.7 Energy From Biomass
Biomass vs Biofuels
Biomass: organic matter (wood/charcoal, dried animal waste, dead leaves/brush) burned to release heat – primarily for heating homes/cooking
Utilized primarily in developing world for heating homes and cooking food
Easy to harvest, available, cheap/free (subsistence fuel)
Can also be burned in powerplants to generate electricity (less common than fossil fuels)
Biofuels: liquid fuels (ethanol, biodiesel) created from biomass (corn, sugar cane, palm oil)
Used as replacement fuel sources for gasoline, primarily in vehicles
Modern vs. Fossil Carbon
Biomass burning releases CO2, but doesn’t increase atmospheric CO2 levels like fossil fuel burning does
Burning biomass releases modern carbon whereas fossil fuel burning releases fossil carbon that had been stored for millions of years
Human Health and Environmental Consequences of Biomass Burning
Biomass burning release CO, NO, OM, and VOCs – as respiratory irritants
Environmental consequences = deforestation and air pollutants
Biofuels: Ethanol and Algae
Corn and sugar cane are fermented into ethanol which is mixed with gasoline
Environmental consequences = all the negative consequences of monocrop agriculture
Biodiesel
Liquid fuels produced specifically from plant oils (soy, canola, palm)
6.8 Solar Energy
Active vs. Passive Solar Energy
Passive solar: absorbing or blocking heat from the sun, without use of mechanical/electrical equipment
Active Solar: use of mechanical/electrical equipment to capture sun’s heat (solar water heaters or CST – concentrated solar thermal), or convert light rays directly into electricity (PV cells)
Photovoltaic Cells (PV)
solar panels contain semiconductor that emit low voltage electrical currents when exposed to sun
photons (particles carrying energy from sun) cause separation of charges between two semiconductor layers; electrons separate from protons and flow through circuit to load, delivering energy (as electricity)
PV cells on a roof can directly power the building, or send excess electricity back to the grid for other users (earning you a credit from your utility company)
a drawback is intermittency (solar energy can only be generated during the day)
Concentrated Solar Thermal (CST)
heliostats (mirrors) reflect sun’s rays onto a central water tower in order to heat water to produce steam to turn a turbine 🡪 electricity
a drawback is habitat destruction and light beams frying birds in mid air
Community (solar farm) vs. rooftop solar
large scale solar “farms” can generate lots of electricity, but do take up land and cause habitat loss/fragmentation
rooftop solar doesn’t take up land, but only produces a little electricity
Solar Energy Pros
no air pollutants released to generate electricity
no CO2 released when generated electricity
renewable, unlike fossil fuels which will run out
no mining of fossil fuels for electricity production
Solar Energy Cons
semiconductor metals (silicon) still need to be mined to produce PV cells (solar panels)
this can disrupt habitats and pollute water with mine tailings, air with particulate matter
silicon is a limited resource
solar panel farms can displace habitats
6.9 Hydroelectricity
Hydroelectricity Basics
kinetic energy of moving water 🡪 spins a turbine (mechanical energy) 🡪 turbine powers generator
water moves either with natural current of river or tides, or by falling vertically through channel in a dam
by far the largest renewable source of electricity globally
China, Brazil, and US = 3 biggest hydroelectricity producers
Water Impoundment (DAMS)
Dam built in a river creates a large artificial lake behind the dam (reservoir)
Damming the river enables operators to allow more or less water through the channel in the dam, increasing or decreasing electricity production (water flows through channel 🡪 turns turbine 🡪 turbine powers generator 🡪 electricity)
Also allows for control of flow downstream, prevention of seasonal flooding due to high rainfall
Reservoirs are also a source of recreation money
2 big impacts = flooding of ecosystems behind dam and sedimentation (buildup of sediments behind dam)
Run of River System and Tidal Energy
a dam diverts the natural current of a river through man-made channel beside the river
natural current of the river turns the turbine 🡪 powers the generator 🡪 electricity
less impactful to surrounding ecosystem since no reservoir is formed and ecosystems behind dam aren’t flooded
doesn’t stop natural flow of sediments downstream like water impoundment systems do
doesn’t generate nearly as much power and may be unavailable in warmer seasons when river water levels are lower
Tidal power: comes from tidal ocean flow turning turbine (coastal areas only)
Drawbacks of Hydroelectricity Dams (Ecological/ Environmental/ Economic)
Reservoir floods habitats behind dam (forests/wetlands 🡪 gone; river becomes a lake)
Sedimentation changes upstream and downstream conditions
Upstream becomes warmer (less CO2) and rocky streambed habitats covered in sediment
Downstream loses sediment (important nutrient source), decreased water level, loses streambed habitat
Downstream wetlands especially suffer since nutrients in sediment doesn’t reach them
Fossil fuel combustion during dam constriction, increased evaporation due to larger surface area in reservoir, and methane release due to anaerobic decomposition of organic matter in reservoir
Human homes and business must be relocated due to reservoir flooding, initial construction is very expensive (does create long-term jobs though), sediment buildup must be dredged (removed by crane) eventually
Loss of ecosystem services from downstream wetlands, potential loss of fishing revenue if salmon breeding is disrupted
Fish Ladders
Cement “steps” or series of pools that migratory fish like salmon can use to continue migration upstream, around or over dams
Enables continued breeding for salmon, food source for predators like large birds, bears, and fishing revenue for humans
“salmon cannon” is a similar alternative that enables salmon to be captured or directed into a tube that carries them over the dam
Benefits of Hydroelectric Dams
No GHG emissions when producing electricity (initial construction does require cement and machines that emit GHGs)
Reservoir and dam can be tourist attractions
Jobs are created to maintain the dam
Reliable electricity source generated for surrounding area
No air pollutants released during electricity generation
Allows for control of downstream seasonal flooding
6.10 Geothermal Energy
Geothermal Basics
Natural radioactive decay of elements deep in earth’s core gives off heat, driving magma convection currents which carry heat to upper portion of mantle, close to earth’s surface
Water can be piped down into the ground and heated by this heat from the mantle
Hot water can be converted into steam 🡪 turbine 🡪 electricity can be used to heat homes directly
Geothermal for electricity: naturally heated water reservoirs underground are drilled into and piped up to the surface (or water can be piped down into naturally heated rock layers)
The heat from magma turns the water into steam, which is forced through pipes to spin a turbine
Water is cooled in cooling tower and returned to the ground to start the process over
Renewable since heat from earth’s core won’t run out; but only if groundwater is returned after use
Ground Source Heat Pump
Often referred to as “geothermal” but technically the heat does not come from geologic activity (comes from the ground storing heat from the sun)
More accurate name is “ground source heat pump”
10 feet down, the ground stays a consistent 50-60 degrees due to holding heat from sun (not warmed by geothermal energy from magma – so not technically geothermal energy)
Heat absorbing fluid is pumped through a pipe into the ground where it either takes on heat from the ground, or gives off heat to the ground
Geothermal Heating
True geothermal heating involves piping water deep into ground to be heated by magma and then transferring heat from water to the building
Different than ground source heat pump
Well must go thousands of meters (kms) down into the ground to reach heated water reservoir
Heated water is piped up to surface and sent to homes or business to heat them
Geothermal pros
Potentially renewable, only if water is piped back into the ground for reuse
Much less CO2 emission than fossil fuel electricity
Geothermal Cons
Not everywhere on earth has access to geothermal energy reaching close enough to surface to access it
Hydrogen sulfide can be released, which is toxic and can be lethal to humans and animals
Cost of drilling that deep in the earth can be very high initially
6.11 Hydrogen Fuel Cell
Hydrogen Fuel Cell Basics
Use hydrogen as a renewable, alternative fuel source to fossil fuels
H2 gas and O2 are the inputs used to generate electricity; H2O is given off as a waste product
H2 gas enters fuel cell where it’s split into protons and electrons by an electrolyte membrane that only lets protons pass through
Electrons take an alternative route (circuit) around the membrane, which generates an electrical current
O2 molecules enter fuel cell break apart into individual O atoms and combine with two hydrogens to form H2O as a by product
Most common application is in vehicles
Replaces gasoline (non-renewable, GHG releasing and air pollution) with H fuel (no air pollutants released and only H2O vapor)
Creating H2 Gas
key challenge to H fuel cells is obtaining pure H gas (because it doesn’t exist by itself as a gas naturally)
separating H2 gas from other molecules like H2O or CH4 is very energy intensive
two main processes are steam reforming (95% of all H production) and electrolysis (less common, but more sustainable
stream reforming: burning natural gas (CH4) and suing steam to separate the H gas from the methane (CH4)
emits CO2 and requires natural gas input
electrolysis: electrical current is applied to water, breaking it into O2 and H2
no CO2 emission, but does require electricity
Hydrogen as an Energy Carrier (pros)
because H2 gas can be stored in pressurized tanks, it can be transported for use creating electricity later, in a different location
can also be used as a fuel for vehicles (replacing gasoline) or to create ammonia for fertilizer, or in the chemical industry
Drawbacks of Hydrogen Fuel Cells
since 95% of H2 production requires methane (CH4), H fuel cells are based on a non-renewable and CO2 releasing energy source
if electrolysis is used, it’s only as sustainable as the electricity source
widespread H fuel cell use would require building widespread H distribution network (similar to current system for gasoline)
H fuel stored in gas form in vehicles would require much larger tanks than current gasoline tanks
6.12 Wind Energy
Wind Turbine Electricity Generation
Kinetic energy of moving air (wind) spins a turbine; generator converts mechanical energy of turbine into electricity
Blades of turbine are connected to gearbox by a shaft that rotates; rotating gears create mechanical energy that the generator transforms into electricity
Average turbine can power 460 homes
Motorized drive within shaft can turn the turbine to face wind
Wind Turbine Location
Clustered in groups (wind projects or farms) in flat, open areas (usually rural)
Location them together makes service, repair, and building transmission lines to them easier
Can share land with agricultural use
Offshore wind = wind farms in oceans or lakes
Capitalizes on faster wind speeds
Does require transmission lines bult across long distances to reach land though
Wind Energy Benefits and Drawbacks
Benefits | Drawbacks |
Non-depletable – even better than renewable | Intermittency (isn’t always available) |
No GHG emissions or air pollutants released when generating electricity | Can’t replace base-load power (sources that are always available like fossil fuels, nuclear, or geothermal) |
No CO2 (climate change) | Can kill birds and bats (especially larger, migratory birds) |
Can share land uses (don’t destroy habitat or cause soil/water contamination as fossil fuels do) | Can be considered an eyesore or source of noise pollution by some people |
6.13 Energy Conservation
Small Scale vs. Large Scale Energy Conservation
Small Scale | Large Scale |
Lowering thermostat to use less heat or use AC less often | Improving fuel efficiency (fuel economy) standards |
Conserving water with native plants instead of grass, low flow shower heads, efficient toilets, dishwashers, dryers | Subsidizing (tax credits for) electric vehicles, charging stations, and hybrids |
Energy efficient appliances, better insulation to keep more heat in home | Increased public transport (buses and light rails), green building designs |
Sustainable Home Designs
Ways to either block out or take advantages of sun’s natural heat, or keep in heating/cooling to decrease energy required
Deciduous shade trees for landscaping (leaves block sun in summer, but allow it in during winter)
Using passive solar design concepts to trap sun’s heat and decrease energy from heating system (heat absorbing walls, triple or double paned windows)
Well-insulated walls/attic to trap heat in winter and cool air from AC system in summer
This decreases electricity used by AC unit and energy used by heating system
Water Conservation
Native plants require less watering than traditional lawns (also increase biodiversity of pollinators and require less fertilizer)
Low-flow shoers, toilets, and dishwashers do the same job with less total water (less energy to purify and pump to homes)
Rain barrels allow rain water to be used for watering plants or washing cars
Energy Conservation – Transportation
~28% of total US energy use comes from transport of goods and people
Improving fuel economy of US fleet of vehicles conserves energy as less gasoline/diesel is needed to travel same distance
CAFE (Corporate Average Fuel Economy) standards are regulations set in US to require auto manufacturers to make cars that meet certain MPG standards, or pay penalties
Hybrids have both a gasoline and electric engine, enabling them to have higher MPG ratings
Breaking system charges the electric battery, which powers electric motor
Electric vehicles (EVs or BEVs) use no gasoline, but still require electricity (only as sustainable as electricity source)
Public transit and carpooling are even better energy-saving transport options
Sustainable Building Design
Decreasing the amount of energy required to build larger buildings and heat/cool them
Green roof or walls can decrease runoff, and absorb sun’s heat, decreasing energy needed for cooling building and surrounding area (lessens heat island effect)
Sun lights on rood, or windows on sides can decrease electricity used for lighting
Recycled materials can reduce energy required to produce new ones (glass, wood, even fly ash from coal can be used in foundation)
Managing Peak Demand and Smart Grid Technology
Peak demand is the time of day or year (often early night time hours or very hot weather events) that electricity demand is highest
If demand exceeds supply, rolling blackouts occur
To manage peak demand, some utilities use a variable price model for electricity
Users pay a higher rate during peak demand hours or events, to discourage use
Users pay a lower rate/kWh when using a lower amount of energy (incentivizes lower overall use)
“smart grid” is just the idea of managing demand and energy sources in a more varied way
Unit 6 Energy
6.1 Renewable vs. Nonrenewable Energy Sources
Rate of consumption
rate of use must be at or below rate of regeneration for renewables
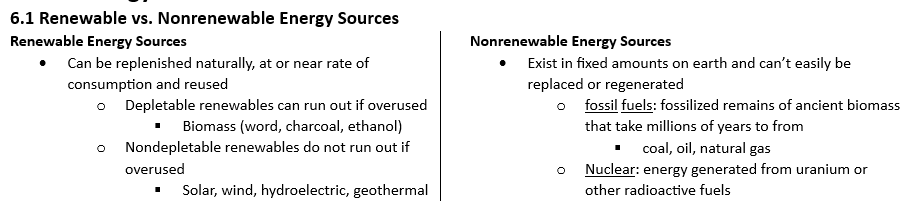 fossil fuels will run out because they take far long to regenerate than the rate we use them
6.2 Global Energy Consumption
Developed vs. Developing Countries
developed nations use more energy on a per capital basis, but developed nations use more energy in total (higher population)
the average US resident uses 5x as much energy as the world average
developing nations are still industrializing and population is still growing rapidly
It will also increase on a per/person basis as their economies industrialize and residents achieve higher standards of living.
Fossil Fuels: Most Used Energy Source
Fossil fuels are by far the most common fuel source globally
Hydroelectric energy is the second largest source
Nuclear Is the third largest source
Development Increase Fossil Fuel Consumption
Many residents of less developed nations depend on subsistence fuels – biomass that they can easily gather/purchase
Economic development 🡪 affluence (wealth) 🡪 higher per capita GDP 🡪 energy use
As developing nations develop, fossil fuel consumption will increase
Factors that Affect Energy Source Use
Availability: fossil fuel use depends on discovered reserves and accessibility of these reserves
Price: fossil fuel prices fluctuate dramatically with discovery of new reserves or depletion of existing ones
Fracking open new natural gas reserves, increases availability, decreasing price, increasing use
Government regulation: government can mandate certain energy source mixes
Government cannot directly raise or lower prices of energy sources
Government can use:
Tax increases to discourage companies from building fossil fuel power plants
Rebates or tax credits to encourage companies building renewable energy power plants
6.3 Fuel Types and Uses
Subsistence Fuels
Biomass fuel sources that are easily accessible; often used in developing countries as a home heating or cooking fuel
Wood (and charcoal) are two of the most common fuel sources in developing nations
Wood is free/cheap to cut down and utilize as fuel; can cause deforestation and habitat loss
Charcoal is made by heating wood under low oxygen conditions for a long time
Peat is partially decomposed organic matter found in wet, acidic ecosystems like bogs and moors
Can be dried and used as a biomass fuel source
Coal Formation
Pressure from overlying rock and sediment layers compacts peat into coal over time
In order of energy density and quality: lignite 🡪 bituminous 🡪 anthracite
The deep a coal reserve is buried, the more pressure from overlying rock layers and the more energy dense
Because higher energy density means more energy released when a fuel source is burned, anthracite is the most valuable form of coal (highest quality)
Natural Gas
Decaying remains of plants and animals (mostly marine life) are buried under layers of rock and converted by pressure into oil (petroleum) and natural gas over time
Natural gas is mostly methane and is found on top of trapped oil (petroleum) deposits
Forms when oil is trapped in a porous, sedimentary rock, underneath a harder impermeable rock layer that doesn’t let the gas escape
Considered the cleanest fossil fuel (produces the fewest air pollutants and least CO2 when burned)
Crude Oil (petroleum)
Decaying organic matter trapped under rock layers is compressed into oil over time
Extracted by drilling a well through the overlying rock layers to reach the underground deposit and then pumping liquid oil out under pressure
Can also be recovered from tar sands (combination of clay, sand, water, and bitumen)
Bitumen Is a thick, sticky, semi-solid form of petroleum (not liquid)
Extracting and using oil from tar sands is extremely energy and water intensive
Fossil Fuel Products
Crude oil (petroleum) is converted into lots of different products through the process of fractional distillation
Crude oil is burned in a furnace and vapor passes into a column where different hydrocarbons are based on their boiling points
6.4 Distribution of Natural Energy Resources
Fossil Fuel Energy Reserves | ||
Coal | Natural Gas | Oil |
~100-150 years
| ~50-60 years
| ~50 years
|
Fracking and Shale Gas
Hydraulic fracturing (fracking) is a method of natural gas extraction that has extended access to natural gas
Gas trapped in semi-permeable, sedimentary rock layers, such as shale, is released by cracking the rock with pressurized water
Fracking natural gas from shale rock increase and extends supply of natural gas
Shale Gas Reserves
Fossil fuels are non-renewable, and will eventually be depleted, but short-term economic profit still drives extraction and use
Tar/Oil Sands
Tar or oil sands are bitumen deposits where crude oil can be recovered, but with higher water and energy inputs
Canada (Alberta region) = world’s largest oil sands reserve
6.5 Distribution of Natural Energy Resources
Fossil Fuel Combustion
Reaction between oxygen and fossil fuels that release energy as heat and produces CO2 and H2O as products
Methane, gasoline, propane, butane, and coal are al fossil fuels (hydrocarbons) that release energy in the same way
Fossil Fuels to Generate Electricity
The #1 source of electricity production globally is coal, followed by natural gas
These steps of electricity generation are the same, no matter what you’re burning to produce the initial heat
Heat 🡪 water into steam 🡪 steam turns a turbine 🡪 turbine powers generator 🡪 generator produces electricity
Coal, oil, natural gas, biomass, and trash can all be burned to drive this same process and create energy
Environmental Consequences: Coal
Habitat destruction to clear land for mining
Produces pollutants and releases CO2 (GHG 🡪 global warming)
Release more CO2 than any other fossil fuel when burned for electricity generation
Releases soot and ash, which can irritate respiratory tracts
Produces toxic ash contaminate with lead, mercury, and arsenic
Generating Electricity
Coal is ~30% efficient as a fuel source for generating electricity (30% of energy from the bonds in the hydrocarbons are converted to electricity)
Much of the energy “lost” or not converted into electricity escapes as heat
Cogeneration: when the heat produced from electricity generation is used to provide heat (air and hot water) to a building
CHP (combined heat and power) systems are close to 90% efficient (much better than coal/NG alone)
Oil/Petroleum Extraction
Extracted by drilling a well through the overlying rock layers to reach the underground deposit and then pumping liquid oil out under pressure
Can also be recovered from tar sands (combination of clay, sand, water, and bitumen)
Bitumen is a thick, sticky, semi-solid form of petroleum (noy liquid)
Extracting and using oil from tar sands is extremely energy and water intensive
Environmental Consequences
Tar Sands
Habitat destruction to clear land for: roads, drilling equipment, digging through ground surface to reach deposits
Ground or nearby surface water depletion (H2O needed for steam and for washing impurities from bitumen at refinery)
Crude Oil/ Petroleum
Possibility of spill (either from tanker ships or pipelines breaking
Habitat loss or fragmentation when land is cleared for roads, drilling equipment, pipelines
Fracking
Possibility of well leaking and contaminating groundwater with fracking fluid (salt, detergents, acids) or hydrocarbons
Ponds can overflow or leach into ground and contaminate surface or ground waters with fracking fluid (salt, detergents, acids)
Depletion of ground or surfaces waters nearby (as they’re drawn from for fracking fluid)
Fracking (Hydraulic fracturing)
Used to extract natural gas from sedimentary rock
Vertical well is drilled down to sedimentary rock layer, then turns horizontally into the rock layer
Perforating gun cracks (fractures) the rock layer around horizontal well, making it more permeable
Fracking fluid (water, salt, detergents, acids) is pumped into well at very high pressure to crack the rock even more and allow natural gas to flow out
Flowback water: (used fracking fluid) flows back out well and is collected and stored in containers or ponds nearby
6.6 Nuclear Energy
Nuclear Fission and Radioactivity
A neutron is fired into the nucleus of a radioactive (unstable) element, such as uranium
Nucleus breaks apart and releases lots of energy (heat) + more neutrons that break more nuclei apart, releasing more energy (chain reaction)
Radioactivity refers to the energy given off by the nucleus of a radioactive isotope (uranium-235)
Radioactive nuclei decay, or breakdown and give off energy (radiation) even without fission; nuclear fission just releases tons of energy all at once
Radioactive Half-life = the amount of time it takes for 50% of a radioactive substance to decay
Generating Electricity
Same electricity generation process as with FFs, just uranium fission to heat water in steam
Heat 🡪 water into steam 🡪 steam turns turbine 🡪 turbine powers generator 🡪 generator produces electricity
U-235 stored in fuel rods, submerged in water in reaction core; heat from fission turns H20 🡪 steam
Control rods are lowered into reactor core to absorb neutrons and slow down the reaction, preventing meltdown (explosion)
Water pump brings in cool water to be turned into steam and also cools reactor down from overheating
Cooling tower allows steam from turbine to condense back into liquid and cool down before being reused
Nonrenewable but cleaner than FFs
Nuclear energy is NONRENWABLE because radioactive elements like Uranium are limited
Other drawbacks of nuclear energy include possibility of meltdown and radioactive contaminations
Spent fuel rods: used fuel rods remain radioactive for millions of years and need to be stored in lead containers on site at nuclear power plants
Mine tailings: leftover rock and soil from mining may have radioactive elements that can contaminate water or soil nearby
Water use: nuclear powerplants require lots of water and can deplete local surface or groundwater sources
Thermal pollution: hot water from power plants released back into surface waters can cause thermal shock
Nuclear Meltdowns
Three Mile Island (US): partial meltdown due to testing error; radiation released but no deaths or residual cancer cases
Fukushima (Japan): an earthquake and tsunami triggered cooling pump failure that lead to meltdown (explosion of reactor core) and widespread radiation release
Chernobyl (Ukraine): stuck cooling valve during test lead to complete meltdown (explosion of reactor core), several deaths and widespread radiation release
Environmental consequences of meltdowns: genetic mutations and cancer in surrounding people, animals and plants due to radiation released from reactor core
Contaminated soil: radiation can remain in soil and harm plants and animals in the future
Radiation spread: radiation can be carried by the wind over long distances; affecting ecosystems far from the meltdown site
6.7 Energy From Biomass
Biomass vs Biofuels
Biomass: organic matter (wood/charcoal, dried animal waste, dead leaves/brush) burned to release heat – primarily for heating homes/cooking
Utilized primarily in developing world for heating homes and cooking food
Easy to harvest, available, cheap/free (subsistence fuel)
Can also be burned in powerplants to generate electricity (less common than fossil fuels)
Biofuels: liquid fuels (ethanol, biodiesel) created from biomass (corn, sugar cane, palm oil)
Used as replacement fuel sources for gasoline, primarily in vehicles
Modern vs. Fossil Carbon
Biomass burning releases CO2, but doesn’t increase atmospheric CO2 levels like fossil fuel burning does
Burning biomass releases modern carbon whereas fossil fuel burning releases fossil carbon that had been stored for millions of years
Human Health and Environmental Consequences of Biomass Burning
Biomass burning release CO, NO, OM, and VOCs – as respiratory irritants
Environmental consequences = deforestation and air pollutants
Biofuels: Ethanol and Algae
Corn and sugar cane are fermented into ethanol which is mixed with gasoline
Environmental consequences = all the negative consequences of monocrop agriculture
Biodiesel
Liquid fuels produced specifically from plant oils (soy, canola, palm)
6.8 Solar Energy
Active vs. Passive Solar Energy
Passive solar: absorbing or blocking heat from the sun, without use of mechanical/electrical equipment
Active Solar: use of mechanical/electrical equipment to capture sun’s heat (solar water heaters or CST – concentrated solar thermal), or convert light rays directly into electricity (PV cells)
Photovoltaic Cells (PV)
solar panels contain semiconductor that emit low voltage electrical currents when exposed to sun
photons (particles carrying energy from sun) cause separation of charges between two semiconductor layers; electrons separate from protons and flow through circuit to load, delivering energy (as electricity)
PV cells on a roof can directly power the building, or send excess electricity back to the grid for other users (earning you a credit from your utility company)
a drawback is intermittency (solar energy can only be generated during the day)
Concentrated Solar Thermal (CST)
heliostats (mirrors) reflect sun’s rays onto a central water tower in order to heat water to produce steam to turn a turbine 🡪 electricity
a drawback is habitat destruction and light beams frying birds in mid air
Community (solar farm) vs. rooftop solar
large scale solar “farms” can generate lots of electricity, but do take up land and cause habitat loss/fragmentation
rooftop solar doesn’t take up land, but only produces a little electricity
Solar Energy Pros
no air pollutants released to generate electricity
no CO2 released when generated electricity
renewable, unlike fossil fuels which will run out
no mining of fossil fuels for electricity production
Solar Energy Cons
semiconductor metals (silicon) still need to be mined to produce PV cells (solar panels)
this can disrupt habitats and pollute water with mine tailings, air with particulate matter
silicon is a limited resource
solar panel farms can displace habitats
6.9 Hydroelectricity
Hydroelectricity Basics
kinetic energy of moving water 🡪 spins a turbine (mechanical energy) 🡪 turbine powers generator
water moves either with natural current of river or tides, or by falling vertically through channel in a dam
by far the largest renewable source of electricity globally
China, Brazil, and US = 3 biggest hydroelectricity producers
Water Impoundment (DAMS)
Dam built in a river creates a large artificial lake behind the dam (reservoir)
Damming the river enables operators to allow more or less water through the channel in the dam, increasing or decreasing electricity production (water flows through channel 🡪 turns turbine 🡪 turbine powers generator 🡪 electricity)
Also allows for control of flow downstream, prevention of seasonal flooding due to high rainfall
Reservoirs are also a source of recreation money
2 big impacts = flooding of ecosystems behind dam and sedimentation (buildup of sediments behind dam)
Run of River System and Tidal Energy
a dam diverts the natural current of a river through man-made channel beside the river
natural current of the river turns the turbine 🡪 powers the generator 🡪 electricity
less impactful to surrounding ecosystem since no reservoir is formed and ecosystems behind dam aren’t flooded
doesn’t stop natural flow of sediments downstream like water impoundment systems do
doesn’t generate nearly as much power and may be unavailable in warmer seasons when river water levels are lower
Tidal power: comes from tidal ocean flow turning turbine (coastal areas only)
Drawbacks of Hydroelectricity Dams (Ecological/ Environmental/ Economic)
Reservoir floods habitats behind dam (forests/wetlands 🡪 gone; river becomes a lake)
Sedimentation changes upstream and downstream conditions
Upstream becomes warmer (less CO2) and rocky streambed habitats covered in sediment
Downstream loses sediment (important nutrient source), decreased water level, loses streambed habitat
Downstream wetlands especially suffer since nutrients in sediment doesn’t reach them
Fossil fuel combustion during dam constriction, increased evaporation due to larger surface area in reservoir, and methane release due to anaerobic decomposition of organic matter in reservoir
Human homes and business must be relocated due to reservoir flooding, initial construction is very expensive (does create long-term jobs though), sediment buildup must be dredged (removed by crane) eventually
Loss of ecosystem services from downstream wetlands, potential loss of fishing revenue if salmon breeding is disrupted
Fish Ladders
Cement “steps” or series of pools that migratory fish like salmon can use to continue migration upstream, around or over dams
Enables continued breeding for salmon, food source for predators like large birds, bears, and fishing revenue for humans
“salmon cannon” is a similar alternative that enables salmon to be captured or directed into a tube that carries them over the dam
Benefits of Hydroelectric Dams
No GHG emissions when producing electricity (initial construction does require cement and machines that emit GHGs)
Reservoir and dam can be tourist attractions
Jobs are created to maintain the dam
Reliable electricity source generated for surrounding area
No air pollutants released during electricity generation
Allows for control of downstream seasonal flooding
6.10 Geothermal Energy
Geothermal Basics
Natural radioactive decay of elements deep in earth’s core gives off heat, driving magma convection currents which carry heat to upper portion of mantle, close to earth’s surface
Water can be piped down into the ground and heated by this heat from the mantle
Hot water can be converted into steam 🡪 turbine 🡪 electricity can be used to heat homes directly
Geothermal for electricity: naturally heated water reservoirs underground are drilled into and piped up to the surface (or water can be piped down into naturally heated rock layers)
The heat from magma turns the water into steam, which is forced through pipes to spin a turbine
Water is cooled in cooling tower and returned to the ground to start the process over
Renewable since heat from earth’s core won’t run out; but only if groundwater is returned after use
Ground Source Heat Pump
Often referred to as “geothermal” but technically the heat does not come from geologic activity (comes from the ground storing heat from the sun)
More accurate name is “ground source heat pump”
10 feet down, the ground stays a consistent 50-60 degrees due to holding heat from sun (not warmed by geothermal energy from magma – so not technically geothermal energy)
Heat absorbing fluid is pumped through a pipe into the ground where it either takes on heat from the ground, or gives off heat to the ground
Geothermal Heating
True geothermal heating involves piping water deep into ground to be heated by magma and then transferring heat from water to the building
Different than ground source heat pump
Well must go thousands of meters (kms) down into the ground to reach heated water reservoir
Heated water is piped up to surface and sent to homes or business to heat them
Geothermal pros
Potentially renewable, only if water is piped back into the ground for reuse
Much less CO2 emission than fossil fuel electricity
Geothermal Cons
Not everywhere on earth has access to geothermal energy reaching close enough to surface to access it
Hydrogen sulfide can be released, which is toxic and can be lethal to humans and animals
Cost of drilling that deep in the earth can be very high initially
6.11 Hydrogen Fuel Cell
Hydrogen Fuel Cell Basics
Use hydrogen as a renewable, alternative fuel source to fossil fuels
H2 gas and O2 are the inputs used to generate electricity; H2O is given off as a waste product
H2 gas enters fuel cell where it’s split into protons and electrons by an electrolyte membrane that only lets protons pass through
Electrons take an alternative route (circuit) around the membrane, which generates an electrical current
O2 molecules enter fuel cell break apart into individual O atoms and combine with two hydrogens to form H2O as a by product
Most common application is in vehicles
Replaces gasoline (non-renewable, GHG releasing and air pollution) with H fuel (no air pollutants released and only H2O vapor)
Creating H2 Gas
key challenge to H fuel cells is obtaining pure H gas (because it doesn’t exist by itself as a gas naturally)
separating H2 gas from other molecules like H2O or CH4 is very energy intensive
two main processes are steam reforming (95% of all H production) and electrolysis (less common, but more sustainable
stream reforming: burning natural gas (CH4) and suing steam to separate the H gas from the methane (CH4)
emits CO2 and requires natural gas input
electrolysis: electrical current is applied to water, breaking it into O2 and H2
no CO2 emission, but does require electricity
Hydrogen as an Energy Carrier (pros)
because H2 gas can be stored in pressurized tanks, it can be transported for use creating electricity later, in a different location
can also be used as a fuel for vehicles (replacing gasoline) or to create ammonia for fertilizer, or in the chemical industry
Drawbacks of Hydrogen Fuel Cells
since 95% of H2 production requires methane (CH4), H fuel cells are based on a non-renewable and CO2 releasing energy source
if electrolysis is used, it’s only as sustainable as the electricity source
widespread H fuel cell use would require building widespread H distribution network (similar to current system for gasoline)
H fuel stored in gas form in vehicles would require much larger tanks than current gasoline tanks
6.12 Wind Energy
Wind Turbine Electricity Generation
Kinetic energy of moving air (wind) spins a turbine; generator converts mechanical energy of turbine into electricity
Blades of turbine are connected to gearbox by a shaft that rotates; rotating gears create mechanical energy that the generator transforms into electricity
Average turbine can power 460 homes
Motorized drive within shaft can turn the turbine to face wind
Wind Turbine Location
Clustered in groups (wind projects or farms) in flat, open areas (usually rural)
Location them together makes service, repair, and building transmission lines to them easier
Can share land with agricultural use
Offshore wind = wind farms in oceans or lakes
Capitalizes on faster wind speeds
Does require transmission lines bult across long distances to reach land though
Wind Energy Benefits and Drawbacks
Benefits | Drawbacks |
Non-depletable – even better than renewable | Intermittency (isn’t always available) |
No GHG emissions or air pollutants released when generating electricity | Can’t replace base-load power (sources that are always available like fossil fuels, nuclear, or geothermal) |
No CO2 (climate change) | Can kill birds and bats (especially larger, migratory birds) |
Can share land uses (don’t destroy habitat or cause soil/water contamination as fossil fuels do) | Can be considered an eyesore or source of noise pollution by some people |
6.13 Energy Conservation
Small Scale vs. Large Scale Energy Conservation
Small Scale | Large Scale |
Lowering thermostat to use less heat or use AC less often | Improving fuel efficiency (fuel economy) standards |
Conserving water with native plants instead of grass, low flow shower heads, efficient toilets, dishwashers, dryers | Subsidizing (tax credits for) electric vehicles, charging stations, and hybrids |
Energy efficient appliances, better insulation to keep more heat in home | Increased public transport (buses and light rails), green building designs |
Sustainable Home Designs
Ways to either block out or take advantages of sun’s natural heat, or keep in heating/cooling to decrease energy required
Deciduous shade trees for landscaping (leaves block sun in summer, but allow it in during winter)
Using passive solar design concepts to trap sun’s heat and decrease energy from heating system (heat absorbing walls, triple or double paned windows)
Well-insulated walls/attic to trap heat in winter and cool air from AC system in summer
This decreases electricity used by AC unit and energy used by heating system
Water Conservation
Native plants require less watering than traditional lawns (also increase biodiversity of pollinators and require less fertilizer)
Low-flow shoers, toilets, and dishwashers do the same job with less total water (less energy to purify and pump to homes)
Rain barrels allow rain water to be used for watering plants or washing cars
Energy Conservation – Transportation
~28% of total US energy use comes from transport of goods and people
Improving fuel economy of US fleet of vehicles conserves energy as less gasoline/diesel is needed to travel same distance
CAFE (Corporate Average Fuel Economy) standards are regulations set in US to require auto manufacturers to make cars that meet certain MPG standards, or pay penalties
Hybrids have both a gasoline and electric engine, enabling them to have higher MPG ratings
Breaking system charges the electric battery, which powers electric motor
Electric vehicles (EVs or BEVs) use no gasoline, but still require electricity (only as sustainable as electricity source)
Public transit and carpooling are even better energy-saving transport options
Sustainable Building Design
Decreasing the amount of energy required to build larger buildings and heat/cool them
Green roof or walls can decrease runoff, and absorb sun’s heat, decreasing energy needed for cooling building and surrounding area (lessens heat island effect)
Sun lights on rood, or windows on sides can decrease electricity used for lighting
Recycled materials can reduce energy required to produce new ones (glass, wood, even fly ash from coal can be used in foundation)
Managing Peak Demand and Smart Grid Technology
Peak demand is the time of day or year (often early night time hours or very hot weather events) that electricity demand is highest
If demand exceeds supply, rolling blackouts occur
To manage peak demand, some utilities use a variable price model for electricity
Users pay a higher rate during peak demand hours or events, to discourage use
Users pay a lower rate/kWh when using a lower amount of energy (incentivizes lower overall use)
“smart grid” is just the idea of managing demand and energy sources in a more varied way
Unit 7 Air Pollution
7.1 Introduction to Air Pollution (Pollutants)
Air Pollution Basics
Write about air pollutants (specific molecules/particles) not just air “pollution” as an idea
Clean Air Act (1980) identified 6 criteria air pollutants that the EPA is required to set acceptable limits for, monitor, and enforce
SO2 - Sulfur dioxide: coal combustion (electricity), respiratory irritation, smog, acid precipitation
NOx – Nitrogen Oxides (NO & NO2): all fossil fuel combustion, O3 photochemical smog, acid precipitation
CO – Carbon monoxide: incomplete combustion, O3, lethal to humans
PM – Particulate matter: fossil fuel/biomass combustion, respiratory irritation, smog
O3 – Ozone (tropospheric): photochemical oxidation of NO2, respiratory irritation, smog, plant damage
Pb – Lead: metal plants, waste incineration, neurotoxicant
Air Pollutants vs. Greenhouse Gasses
CO2 is not one of 6 criteria pollutants in Clean Air Act
CO2 does not directly lower air quality from a human health standpoint
Not toxic to organisms to breath
Not damaging to lungs/ eyes
Does not lead to smog, decreased visibility
CO2 is a greenhouse gas; it does lead to earth warming, and thus environment and human health consequences
Bottom line: in APES, CO2 has not typically been included on FRQ scoring guides as an air pollutant (stick to SO2, NOx, O3, PM)
Coal Combustion
Releases more air pollutants than other fossil fuels
Releases CO, CO2, SO2, NOx, toxic metals (mercury, arsenic, lead), and PM (0ften carries the toxic metals)
Impacts of SO2
Respiratory irritant (inflammation of bronchioles, lungs), worsens asthma and bronchitis
Sulfur aerosols (suspended sulfate particles) block incoming sun, reducing visibility and photosynthesis
Forms sulfurous (grey) smog
Combines with water and O2 in atmosphere to form sulfuric acid 🡪 acid precipitation
Nitrogen Oxides (NOx)
Released by combustion of anything, especially FFs and biomass
NOx refers to nitrogen oxides (both NO and NO2)
NO forms when N2 combines with O2 (especially during combustion)
NO can become NO2 by reacting with O3 or O2
Sunlight converts NO2 back into NO
Environment and Human Health Impacts
Respiratory irritant
Leads to tropospheric ozone (O3) formation, which leads to photochemical smog
Combines with water and O2 in atmosphere to form nitric acid 🡪 acid precipitation
EPA and Lead
Before CAA< lead was a common gasoline additive; EPA began phaseout of lead from gasoline in 1974. Vehicles made after 1974 are required to have catalytic converters to reduce NOx, CO, and hydrocarbon emissions (lead damages catalytic converters)
Primary vs. Secondary Air Pollutants
Primary
Emitted directly from sources such as vehicles, power plants, factories, or natural sources (volcanoes, forest fires)
NOx, CO, CO2, VOCs, SO2, PM, and hydrocarbons
Secondary
Primary pollutants that have transformed in presence of sunlight, water, O2
Occur more during the day (since sunlight often drives formation
Tropospheric O3 (ozone)
Sulfuric acid (H2SO4) and sulfate (SO42-)
Nitric acid (HNO3) and nitrate (NO3-)
7.2 Photochemical Smog
Photochemical Smog Precursors and Conditions
Precursors
NO2 – broken by sunlight into NO + O (free O + O2 🡪 O3)
VOCs - volatile organic compounds (hydrocarbons) that bind with NO and form photochemical oxidants
Carbon-based compounds that volatize (evaporate) easily (this makes them “smelly”)
Sources: gasoline, formaldehyde, cleaning fluids, oil-based paints, even coniferous trees (pine smell)
O3 – forms when NO2 is broken by sunlight and free O binds to O2
Respiratory irritant in troposphere (at earth’s surface)
Damaging to plants stomata, limiting growth
Conditions
Sunlight - drives O3 formation by breaking down NO2 🡪 NO + O; then free O atom binds with O2
Warmth – hotter atmosphere temperature speeds O3 formation, evaporation of VOCs and thus smog formation
Normal O3 Formation
Morning commute leads to high NO2 levels from car exhaust
Sunlight breaks NO2 into NO + O
O bonds with O2 to form O3
O3 formation typically peaks in afternoon when sunlight is most direct and NO2 emissions from morning traffic have peaked
At night, O3 reacts with NO to form NO2 and O2 once again; O3 levels drop overnight
Photochemical Smog Formation
Sunlight breaks NO2 into NO + O
O bonds with O2 to form O3
VOCs bonds with NO to form photochemical oxidants
Without NO to react with, O3 builds up instead of returning to O2 and NO2 overnight
O3 combines with photochemical oxidants (NO + VOCs) to form photochemical smog
Factors that Increase Smog Form
Increased vehicle traffic; increases NO2 emissions and therefore O3 formation
Higher VOCs emissions (gas stations, laundromats, petrochemicals, and plastic factories)
More sunlight (summer, afternoon) = more O3
Warmer temperature, speeds evaporation of VOCs and reaction that lead to O3
Urban areas have more smog due to all of these factors
Impacts of Smog
Environment (reduces sunlight; limiting photosynthesis, O3 damages plants stomata and irritates animal respiratory tracts)
Humans (respiratory irritant; worsens asthma, bronchitis, COPD; irritates eyes)
Economic (increased health care costs to treat asthma, bronchitis, COPD, lost productivity due to sick workers missing work or dying, decreased agriculture yields due to less sunlight reaching crops and damage to plant stomata)
Reduction of Smog
Vehicles (decreasing the number of vehicles on road decreases NO2 emissions, fewer vehicles = less gas = fewer VOCs)
Energy (increased electricity production from renewable sources that don’t emit NOx (solar, wind, hydro), natural gas power plants release far less NOx than coal)
7.3 Thermal Inversion
Urban Heat Island Effect
Urban areas tend to have higher surface and air temperature than surrounding suburban and rural areas due to:
Lower albedo: concrete and asphalt absorb more of sun’s energy than areas with more vegetation (absorbed sunlight is given off as IR radiation – heat)
Less evapotranspiration: water evaporating from surfaces and transpiration from plants carries heat from surface into the atmosphere
this cools off rural and suburban areas which have more vegetation
Thermal Inversion
Normally the atmosphere is warmest at earth’s surface, and cools as altitude rises. Because warm air rises, air convection carries air pollutants away from earth’s surface and distributes them higher into the atmosphere
During a thermal inversion, a cooler air mass becomes trapped near earth’s surface
due to a warm front moving in over it
or due to hot urban surfaces colling overnight while IR radiation absorbed during the day is still being released
because cold air at the surface is trapped beneath the warmer mass above, convection doesn’t carry pollutants up and away.
Effects of Thermal Inversion
Air pollutants (smog, PM, ozone, SO2, NOx) trapped closer to earth
Respiratory irritation: asthma flare ups leading to hospitalization, worsened COPD, emphysema
Decreased tourism revenue
Decreased photosynthetic rate
7.4 Atmospheric CO2 and PM
Natural Sources of Air Pollutants
Lighting strikes (convert N2 in atmosphere to NOx)
Forest fires (CO, PM, NOx, combustion of biomass also releases CO2 and H2O vapor) (greenhouse gasses)
Plants (especially conifers) (plants emit VOCs)
Volcanoes (SO2, PM, CO, NOx)
Natural Sources of CO2 and PM
Respiration (all living thins release CO2 through respiration)
Natural PM Sources (sea salt, pollen, ash from forest fires, volcanoes, and dust leads to haze)
Aerobic Decomposition (decomposition of organic matter by bacteria and decomposers in the presence of oxygen 🡪 releases CO2)
Anaerobic decomposition (decomposition of organic matter by bacteria and decomposers in low or oxygen-free conditions 🡪 releases CH4 (methane))
PM10 vs PM2.5
Particulate matter: solid or liquid particles suspended in air (also referred to as “particulates”)
PM10 (< 10 micrometers)
Particles or droplets like dust, pollen, ash, or mold
Too small to be filtered out by nose hairs and trachea cilia; can irritate respiratory tract and cause inflammation
PM2.5 (< 2.5 micrometers)
Particles from combustion (especially vehicles) smaller dust particles
More likely to travel deep into the lungs due to smaller size
Associated with chronic bronchitis and increased risk of lung cancer
7.5 Indoor Air Pollutants
Developing Countries
Developing nations use more subsistence fuels such as wood, manure, charcoal (biomass)
These biomass fuels release CO, PM, NO2, VOCs (can also cause deforestation)
Often combusted indoors with poor ventilation, leading to high concentrations
Developed Countries
Developed nations use more commercial fuels (coal, oil, natural gas) supplied by utilities
Typically burned in closed, well ventilated furnaces, stoves, etc.
Major indoor air pollutants in developed nations come from chemicals in products: adhesives in furniture, cleaning supplies, insulation, lead paint
PM and Asbestos
Particulates (PM) are common indoor air pollutant
Asbestos is a long, silicate particle previously used in insulations (since been linked to lung cancer and asbestosis)
CO (Carbon Monoxide)
CO is an asphyxiant: causes suffocation due to CO binding to hemoglobin in blood, displacing O2
Lethal to humans in high concentrations, especially with poor ventilation (odorless and colorless – hard to detect)
Developed nations: CO released into home by malfunctioning natural gas furnace ventilation
Developing nations: CO emitted from indoor biomass combustion for heating/cooking
VOCs (Volatile Organic Compounds)
Chemicals used in a variety of home products that easily vaporize, enter air, and irritate eyes, lungs, bronchioles
Adhesives/sealants: chemicals used to glue carpet down, hold furniture together, seals panels
Formaldehyde is a common adhesive in particle board and carpet glues
Cleaners: common household cleaners and deodorizers such as Febreze
Plastics and Fabrics: both can release VOCs themselves, or from adhesives used in production
Radon Gas
Radioactive gas released by decay of uranium naturally found in rocks underground (granite especially)
Usually enters homes through cracks in the foundation and then disperse up from basement/foundation through home
can also seep into groundwater sources and enter body through drinking water
Dust and Mold
Natural indoor air pollutants that can worsen asthma, bronchitis, COPD, emphysema
Dust settles in homes naturally, is disturbed by movement, entering air and then respiratory tract
Mold develops in areas that are dark and damp and aren’t well ventilated
Lead
Found in paint in old homes
Paint chips off walls/windows and is eaten by small children or inhaled as dust
7.6 Reduction of Air Pollutants
Reducing Emissions
Reducing emissions = reducing air pollutants
Law/Regulations
Clean Air Act
Allows EPA to set acceptable levels for criteria air pollutants
Monitor emissions levels from power plants and other facilities
Tax/sue/fine corporations that release emissions above levels
CAFE Vehicle Standards
(Corporate Average Fuel Economy) standards require the entire US fleet of vehicles to meet certain average
Requires vehicle manufacturers to work to make more efficient vehicles
More efficient vehicles burn less gasoline and release less NOx, PM, CO, and CO2
Pollution Credits
Similar to ITQs for fish
Companies that reduce emissions below EPA-set levels earn pollution credits
Reducing Vehicle Air Pollutants
Vapor Recovery Nozzle
Capture hydrocarbon VOCs released from gasoline fumes during refueling
Separate tubes inside nozzle captures vapors and returns them to underground storage tank beneath the gas station
Reduces VOCs, which contribute to smog and irritate respiratory tracts
Reduces benzene (carcinogen) released from gasoline vapors
Catalytic Converter (CC)
Required on all vehicles after 1975
Contains metals (platinum and palladium) that bind to NOx and CO
CC converts NOx, CO, and other hydrocarbons into CO2, N2, O2, and H2O
Reducing SOx and NOx
Crushed Limestone (SO2)
Used to reduce SO2 from coal power plants
Crushed coal mixed with limestone (calcium carbonate) before being burned in boiler
Calcium carbonate in limestone combines with SO2 to produce calcium sulfate, reducing the SO2 being emitted
Calcium sulfate can be used to make gypsum wallboard or sheetrock for home foundations
Fluidized Bed Combustion (NOz)
Fluidizing jets of air pumped into combustion “bed”
Jets of air bring more 02 into reaction, making combustion more efficient and bringing SO2 into more contact with calcium carbonate in limestone
Also allows coal to be combusted at lower temperature, which emits less NOx
Wet and Dry Scrubbers
Dry Scrubbers (NOx, SOx, VOCs)
Large column/tube/pipe filled with chemicals that absorb or neutralize oxides (NOx, SOx, VOCs_ from exhaust streams (emissions)
Calcium oxide is a common dry scrubber additive which reacts with SO2 to form calcium sulfite
Wet Scrubbers (NOx, SOx, VOCs + PM)
May involve chemical agents that absorb or neutralize NOx, SOx, VOCs, but also include mist nozzles that trap PM in water droplets as well
Reducing Particulate Matter
Electrostatic Precipitator
Power plant/factory emissions passed through device with a negative charge electrode, giving particles a negative charge
Negative charged particles stick to positive charged collection plates, trapping them
Plates discharged occasionally so particles fall down into collection hopper for disposal in landfills
Baghouse Filter (PM)
Large fabric bag filters that trap PM as air from combustion/industrial process passes through
Shaker device knocks trapped particles loose into collection hopper below
7.7 Acid Rain
Sources of NOx and SO2
NOx and SO2 are the primary pollutants that cause most acid precipitation
Major Sources
SO2 – coal fired power plants, metal factories, vehicles that burn diesel fuel
NOx – vehicle emissions, diesel generators, coal power plants
Limiting Acid Rain
Reducing NOx and SO2 emissions reduces acid deposition
Higher CAFE standards
More public transit
Renewable energy sources
More efficient electricity use
Since passage of Clean Air Act, acid deposition has decreased significantly
NOx and SO2 react with O2 and H2O in the atmosphere, forming nitric and sulfuric acid
Sulfuric acid and nitric acid dissociate in the presence of water into sulfate and nitrate ions, and hydrogen ions (H+)
Acidic rain water (higher H+ concentration) decreases soil and water pH; can limit tree growth in forests down wind from major SO2 and NOx sources
Environmental Effects of Acid Rain
Acidity= higher H+ ion concentration, lower pH
Soil/water acidification
H+ ions displace or leech other positive charged nutrients (Ca2+, K+) from soil
H+ ions also make toxic metals like aluminum and mercury more soluble in soil and water
pH Tolerance
as pH decreases (more acidic) outside optimal range for a species, population declines
when pH leaves range of tolerance, they cannot survive at all due to aluminum toxicity and disrupted blood osmolarity
indicator species can be surveyed and used to determine conditions of an ecosystem
Mitigating Acid Rain
Limestone (calcium carbonate) is a natural base that can neutralize acidic soil/water
Limestone
Calcium carbonate (CaCO3) reacts with H+ ions, forming HCO3 and giving off Ca2+
This “neutralizes” acidic water/soil, moving it closer to a pH of 7
Regions with limestone bedrock have some natural buffering of acid rain
Humans can also add crushed limestone to soils/waters to neutralize
Acid rain can corrode human structures, especially those made from limestone
Limiting SOx and NOx
Decreasing these primary pollutants that drive acid rain can reduce it
Renewable energy sources, decreasing coal comb.
Fluidized bed combustion and lower burning temperature for existing coal power plants
Dry or wet scrubbers
7.8 Noise Pollution
Urban Noise Pollution
Any noise at great enough volume to cause physiological stress (difficulty communicating, headaches, confusion) or hearing loss
Construction: jack hammers, trucks, concrete pouring
Transportation: cars, busses, trains
Industrial activity: manufacturing plants
Domestic activity: neighbor’s music, lawn mowing, home projects
Wildlife Effects (land)
Noise pollution can disrupt animal communication, migration, and damage hearing
Physiological stress: caterpillar hearts beat faster when exposed to simulated highway noise pollution
Hearing: can prevent predators from hearing prey and vice versa; can prevent mates from locating each other (both decrease chances of survival)
Wildlife Effects (aquatic)
Aquatic noise pollution comes from the noise of ship engines, military sonar, and seismic air blasts from oil and gas surveying ships
Physiological stress: hearing loss, disrupted communication, mating calls, predator and prey navigation
whales are especially prone to having migration routes disrupted as their vocal communication is disrupted
Seismic surveying: ships send huge air blasts down into the water, searching for oil by recording how the echo is returned from ocean floor
So loud that researchers off the coast of Virginia can detect blasts from coast of Brazil
Unit 8 Aquatic and Terrestrial Pollution
8.1 Sources of Pollutants
Point Source Pollutants
Pollutant that enters environment from an easily identified and confined place, you can point to it
Nonpoint Source Pollutants
Pollutants entering the environment from many places at once. Difficult to “point” to one individual source
Must-Know Pollution Examples
Point source
Animal waste runoff from a CAFO (ammonia, fecal coliform bacteria)
Emissions from smokestack of a coal power plant (CO2, NOx, SO2, PM)
BP Oil Spill (hydrocarbons, benzene)
Nonpoint Source
Urban runoff (motor oil, nitrate, fertilizer, road salt, sediment)
Pesticides sprayed on agricultural fields; carried by wind and washed off large agricultural regions into bodies of water
Estuaries and bays are polluted by many nonpoint pollution sources from the large watersheds that empty into them
Pollutants vs Pollution
Pollutants
Specific chemicals or groups of chemicals from specific sources with specific environmental and human health effects
Pollution
Vague, nondescript term for any substance that is harmful to the environment (never acceptable on APES FRQ)
8.2 Human Impacts on Ecosystems
Range of Tolerance
Organisms have range of tolerance for abiotic conditions in the habitat (pH, temperature, salinity, sunlight, nutrient levels (ammonia and phosphate))
Organisms also have range of tolerance for pollutants that human activities release into their habitats
Pollutant cause physiological stress such as
Limited growth
Limited reproductive function
Difficulty respiring, potentially asphyxiation
Hormonal disruption
Death (if concentration of pollutants is high enough)
Temperature Tolerance of Reef Algae
Coral reef = mutualistic relationship between coral and photosynthetic algae called zooxanthellae; algae supply sugar and coral supply CO2 + detritus (nutrient containing organic matter)
Algae have narrow temperature tolerance and leave the reef when temperatures rises
Pollutants from runoff (sediments, pesticides, and sunscreen) can also force algae from reef
Coral lose color and become stressed and vulnerable to disease without algae (main food source)
Human Impacts on Coral Reef
Humans disrupt coral reef ecosystems via greenhouse gas emissions (warming ocean temperature and bleaching coral)
Overfishing decreases fish populations in coral reef ecosystem and bottom trawling can break reef structure and stir up sediment
Urban and agricultural runoff also damages coral reef ecosystems
Sediment pollution: sediment carried into ocean by runoff makes coral reef waters more turbid, reducing sunlight (photosynthesis)
Toxicants: chemicals in sunscreen, oil from roadways, pesticides, from agricultural runoff
Nutrients (P/N): ammonia from animal waste, nitrates/phosphates from agriculture or lawn fertilizers
Oil Spill Effects
Hydrocarbons in crude oil (petroleum) are toxic to many marine organisms and can kill them, especially if they ingest the oil or absorb through gills/skin
Oil can wash ashore and decrease tourism revenue and kill fish, decreasing fishing industry revenue, hurt restaurants that serve fish
oil can settle deep in root structures of estuary habitats like mangroves or salt marshes
Oil Spill Clean Up
Oil spills can occur when an underwater oil well explodes/blows out or when a tanker runs into a rock/iceberg and is punctured
Cleanup can involve booms on surface to contain spread and ships with vacuum tubes to siphon oil off of the surface or devices to skim it off
Physical removal of oil from beach sand and rocks with towels, soaps, and shovels
Chemical dispersants sprayed on oil slicks to break up and sink to the bottom
Burning oil off surface
8.3 Endocrine Disruptors and Industrial Water Pollutants
Endocrine Disruptors
Chemicals that interfere with the endocrine (hormonal) systems of animals
Bind to cellular receptors meant for hormones, blocking the hormone from being received, or amplifying its effects
Atrazine – broad spectrum herbicide used to control weeds and prevent crop loss
DDT – broad spectrum insecticide that was phased out, but still persists in environment
Phthalates – compound used in plastic and cosmetic manufacturing
Lead, Arsenic, Mercury – heavy metals
Many human medications that enter sewage via human urine or flushed meds
Mercury – naturally occurring in coal, released by anthropogenic activities
Coal combustion, trash incineration, burning medical waste, heating limestone for cement
Endocrine disruptor: inhibits estrogen and insulin (interferes with menstrual cycle and ovulation)
Teratogen: (chemical harmful to developing fetuses) can accumulate in fetus brain
Mercury itself isn’t toxic but bacteria in water sources convert it to methylmercury which is highly toxic to animals
Arsenic – naturally occurring element in rocks underground that can dissolve into drinking water; natural release into groundwater can be worsened by mining
Anthropogenic sources: formerly in pesticides applied to agricultural fields
Carcinogenic (lung, bladder, kidneys) and endocrine disruptor
Lead – found in old paint (in homes), old water pipes, and soils contaminated by PM from vehicle exhaust before lead was phased out of gas in 70s
Neurotoxicant
Endocrine disruptor
Coal Ash
Coal ash can be a source of mercury, lead, and arsenic
8.4 Human Impacts on Wetlands and Mangroves
Wetlands
An area with soil submerged/saturated in waters for at least part of the year but shallow enough for emergent plants
Ecosystem services of wetlands:
Provisioning: habitat for animal and plant foods
Regulating: groundwater recharge, absorption of floodwater, CO2 sequestration
Supporting: H2O filtration, pollinator habitats, nutrient cycling, pest control
Cultural: tourism revenue, fishing license, camping fees
Threats to Wetlands
Pollutants – nutrients, sediment, motor oil, pesticides, endocrine disruptors
Development
8.5 Eutrophication
extra input of N and P lead to eutrophication which fuels algae growth
algae bloom due to increase of N/P 🡪 decreased sunlight 🡪 plants below surface die 🡪 bacteria use up O2 for decomposition 🡪hypoxia (low O2) and dead zones
Major N/P sources:
Discharge from sewage treatment plants
Animal waste from CAFOS
Synthetic fertilizer from agriculture fields and lawns
Oligotrophic Waterways
Waterways with low nutrient levels, stable algae populations, and high dissolved oxygen
Aquatic ecosystems naturally undergo succession
sediment buildup on bottom (benthic zone) leads to higher nutrient levels
overtime, ponds naturally shift form oligotrophic, to mesotrophic, to eutrophic
Dissolved Oxygen and Dead Zones
Decreased in dissolved oxygen (hypoxia) is what causes a dead zone
All aquatic life requires dissolved oxygen in water for respiration
8.6 Thermal Pollution
Solubility of Oxygen and Temperature
Solubility = the ability of a solid/liquid/gas to dissolve into a liquids
Inverse relationship between water temperature and oxygen solubility (water temp goes up, DO goes down)
Thermal pollution: when heat released into water has negative effects on organisms living in water. Heat increases respiration rate of aquatic organisms (thermal shock). Hot water has less O2.
Source of Thermal Pollution
Power plants use cool water from surface/groundwater sources nearby to cool steam used to turn a turbine back into water reuse
Urban stormwater runoff can also cause thermal pollution due to heat from blacktop/asphalt
Nuclear power plants require especially large amounts of cool water to cool steam back into water and to cool the reactor
Cooling Towers
Cooling towers/ponds are used to cool steam back into water and to hold warmed water before returning to local surface water
8.7 Persistent Organic Pollutants (POPs)
POPs
Persistent (long-lasting) Organic (carbon based) Pollutants
Synthetic compounds that do not easily breakdown in the environment; accumulate and buildup in water and soil
Fat-soluble, meaning they also accumulate and persist in animals’ fat tissue instead of passing through the body
Sources: pesticides, medications, dioxins, PCBS, perchlorates
POPs travel long distances through wind and water, impacting ecosystems far away
8.8 Biomagnification
Bioaccumulation
Absorption and concentration of compounds in the cells and fat tissues of organisms
Biomagnification
Increasing concentrations of fat-soluble compounds like methylmercury and POPs in each level up the trophic pyramid or food web/chain
Biomagnification begins with POPs or methylmercury in sediments or plants in an ecosystem
DDT was banned in may developed nations but still persists in sediments of many bodies of water
Mercury is emitted from burning coal and by volcanoes, carried by wind, and deposited in water where bacteria converts it into methylmercury
8.9 Solid Waste Disposal
Solid Waste Types and Sources
MSW (municipal solid waste): solid waste from cities, waste “stream” refers to flow of solid waste to recycling centers, landfills, or trash incineration facilities, aka trash litter garbage refuse
E-Waste: old computers phones tablets, only ~2% of MSW; considered hazardous waste due to metals like cadmium lead mercury and PBDEs (fireproof chemicals)
can leach endocrine disrupting chemicals out of landfills if thrown away with regular MSW
Sanitary Landfills
Clay/plastic bottom liner: layer of clay/plastic on the bottom of a hole in the ground; prevents pollutants from leaking out into soil/groundwater
Leachate Collection System: system of tubes/pipes at bottom to collect leachate (water draining through waste and carrying pollutants) for treatment and disposal
Methan Recovery System: system of tubes/pipes to collect the methane produced by anaerobic decomposition in the landfill
Methan can be used to generate electricity or heat buildings
Clay Cap: clay-soil mixture used to cover the landfill once it’s full; keeps out animals, keeps in smell, and allows vegetation to regrow
Landfill Issues
Landfills have environmental impacts like groundwater contamination and release of GHGs
Groundwater can be contaminated with heavy medals, acids, medications, and bacteria if leachate leaks through lining into soil/groundwater beneath
Greenhouse gases are released from landfills due to decomposition; both contribute to global warming and climate change
Not in my back yard (NIMBY) = idea that communities don’t wat landfills near them for a number of reasons
Landfills are often placed near low-income or minority communities that don’t have the resources or political power to fight against these decisions
Waste Incineration and Ocean Dumping
Waste can be incinerated to reduce the volume that needs to be landfilled; since most waste = hydrogen, carbon, and oxygen
Can be burned to generate electricity
Illegal ocean dumping occurs in some countries with few environmental regulations or lack of enforcement
8.10 Waste Reduction
Reduce, Reuse, Recycle
Reducing consumption is the most sustainable because it decreases natural resources harvesting and the energy inputs to creating, packaging, and shipping goods
Recycling = processing and converting solid waste material into new products
Least sustainable of the three Rs due to the amount of energy it requires to process and convert waste materials
Pros of Recycling
Reduces demand for new materials, especially metals and wood which cause habitat destruction and soil erosion when harvested
Cons of Recycling
Recycling is costly and still requires significant energy
Composting
Organic matter (food scraps, paper, yard waste) being decomposed under controlled conditions
Reduces landfill volume and produces rich organic matter
Potential drawback includes the foul smell that can be produced if not properly rotated and aerated and rodents or other pests that may be attracted
E-Waste
Waste from electronic that often contain heavy metals (lead, mercury, cadmium)
Can leach these toxic metals into soil and groundwater if disposed of in landfills or open dump
Can be recycled and reused to create new electronics
Waste to Energy
Waste can be incinerated to reduce the volume and also generate electricity; most waste (paper, plastic, food) = hydrogen, carbon, and oxygen so it easily combusts at high temperatures
Methane gas produced by decomposition in landfill can be collected with pipes and burned to generate electricity
8.11 Sewage Treatment
Water Treatment Process
Primary Treatment (physical removal of large debris with a screen or gate)
Secondary Treatment (biological breakdown of organic matter (feces) by bacteria; aerobic process that requires O2)
Tertiary Treatment (ecological or chemical treatments to reduce pollutants left after primary and secondary)
Disinfectant (UV light, ozone, or chlorine is used to kill bacteria or other pathogens, such as e. Coli)
Effluent: liquid waste (sewage) discharged into a surface body of water, typically from a wastewater treatment plant
Sludge: inorganic, solid waste that collects at the bottoms of tanks in primary and secondary treatment
Tertiary Treatment
Uses chemical filters to remove more nitrates and phosphate from secondary treatment discharge
Sewage Treatment Issues
Combined sewage and stormwater runoff systems can cause wastewater treatment plants to flood during heavy rains, releasing raw sewage into surface water
Even treated wastewater effluent released into surface water often has N/P levels and endocrine disruptors
8.12 and 8.13 LD50 and Dose Response Curve
Dose Response Studies and LD50
Studies that expose an organism to different doses of concentrations of a chemical in order to measure the response of the organism
Independent variable = concentration of the chemical
dependent variable = response measured in organism
LD50 refers to the dose or concentration of the chemical that kills 50% of the population being studied
Dose Response Curve
The data from a dose response study, graphed with percent mortality or other effect on the y-axis and dose concentration of chemical an x-axis
Lowest dose where an effect (death, paralysis, cancer) starts to occur is called the threshold or toxicity threshold
Dose response curves are usually “S=shaped” – low mortality at low doses, rapid increase in mortality as dose increases, level off near 100% mortality at high dosage
ED50 and Other Dose Responses
ED50 refers to the dose concentration of a toxin or chemical that causes a non-lethal effect (infertility, paralysis, cancer, etc.) in 50% of the population being tested
Dose Response Data and Human Health
Dose-response studies for toxic chemicals are not done on humans; data from other mammals are used to stimulate human toxicity
8.14 Pollution and Human Health
Routes of Exposure
Ways that a pollutant enters the human body
Lead 🡪 water pipes and paint chips
Mercury 🡪 seafood (tuna)
CO 🡪 indoor biomass comb.
PM 🡪 pollen, dust, etc.
Arsenic 🡪 rice, groundwater
Synergism
The interaction of two or more substances to cause an effect greater than each of them individually
Ex. Asthma caused by PM from coal PPs and Covid-19 damaging lungs
Carcinogenic effect of asbestos combined with lung damage from smoking
Synergisms make it especially hard to pinpoint the exact effects of one specific pollutant on humans
Dysentery
Bacterial infection caused by food or water being contaminated with feces (often from sewage release into rivers and streams used for drinking water)
Causes intestinal swelling and can result in blood in feces
Can be treated with antibiotics that kill the bacteria causing the infection and access to treated/filtered water that can rehydrate
Mesothelioma (asbestos)
A type of cancerous tumor caused by exposure to asbestos, primarily affecting the lining (epithelium) of the respiratory tract, heart, or abdominal cavity
Asbestos exposure comes primarily from old insulation materials used in attics, ceiling and flooring boards; when the insulation becomes physically disturbed, asbestos particles are released into the air and inhaled
Tropospheric Ozone (O3)
Worsens respiratory conditions like asthma, emphysema, bronchitis, COPD
Limits overall lung function
Irritates muscles or respiratory tract causing constriction of airways and shortness of breath
Sources: photochemical breakdown of NO2 (car exhaust, coal, and NG combustion)
Only harmful in troposphere (beneficial in stratosphere)
8.15 Pathogens and Infectious Diseases
Pathogens
A living organism (virus, bacteria, fungus, protist, worm) that causes an infectious disease
Infectious diseases are capable of being spread or transmitted (HIV, Ebola, Covid-19); noninfectious diseases are not transmissible (heart disease, asthma, cancer, diabetes)
Pathogens adapt and evolve to take advantage of humans as hosts for their reproduction an d spread (Covid-19 is a SARS-associated coronavirus that evolved to become especially effective at surviving and reproducing in humans)
Vectors
A living organism (rat, mosquito) that carry and transmit infectious pathogens to other organisms
Climate change is shifting equatorial climate zones north and south away from the equator; this brings warmer temperatures to subtropical and temperate regions
Warmer temperatures allow pathogens and their vectors (mosquitos) to spread north and south to parts of the world previously too cold
Many pathogenic bacteria and viruses survive and replicate better in warmer weather
Infectious Disease and Development
Less developed, poorer countries typically have higher rates of infectious disease
Less sanitary waste disposal; pathogens can reproduce in open waste areas where children may play or animals may scavenge and pass to humans
Less access to healthcare facilities and antibiotic medications to treat infectious diseases caused by bacteria and other pathogens
Lack of treatment/filtration for drinking water and sewage treatment exposes people to bacterial and viral pathogens in water, often from human waste
Tropical climates and more open-air living can expose people to vectors like mosquitoes; less money for vector eradication (spraying mosquito breeding grounds)
Plague
Bacterial (pathogen) infection transmitted by fleas (vector) that attach to mice and rates (vectors as well)
Transmitted by flea bite, rodent contact or contaminated human fluids
Aka “bubonic” or “black” plague; modern antibiotics are highly effective against it, but some isolated instances still occur
Tuberculosis (TB)
Bacterial (pathogen) infection that targets the lungs
Transmitted by breathing bacteria from body fluids of an infected person, which can linger in air for hours
Causes night sweats, fever, coughing blood; treatable in developed nations with access to powerful antibiotics
Malaria
Parasitic protist (pathogen) infection caused by bite from infected mosquitoes
Most common in sub-Saharan Africa and other tropical regions
West Nile
Virus (pathogen) infection caused by bite from infected mosquitoes (vector)
Birds are the main host but the virus can be transmitted to humans by mosquitoes that bit infected birds
Causes brain inflammation
Zika Virus
Virus (pathogen) infection caused by bite from infected mosquitoes (vector) and sexual contact
Causes babies to be born with abnormally small heads and damaged brains; can be passed from mother to infant
No known treatment currently, so prevention is focused on eliminating mosquito populations
Sars (severe acute respiratory syndrome)
Coronavirus (pathogen) infection caused by respiratory droplets from infected person
Primarily transmitted by touching or inhaling fluids from an infected person
Causes a form a pneumonia
Initial outbreak was in Southeast Asia
SARS-CoV-2 is the virus that causes the disease COVID-19
MERS (Middle East Respiratory Syndrome)
Virus (pathogen) respiratory infection transmitted from animals to humans
Originated on Arabian Peninsula
Cholera
Bacterial (pathogen) infection caused by drinking infected water
Vomiting, muscle cramps, and diarrhea; can cause severe dehydration
Can be introduced by water contaminated with human feces or undercooked seafood