


Chapter 4: Demand and Supply (The Basics)
Demand an the Law of Demand
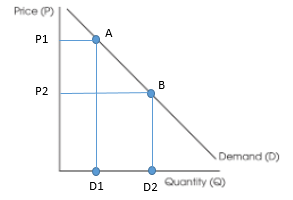
Demand for a product is the quantity the customers are willing and able to pay for each and every price
The law of demand states that as price increases, demand for that product decreases (inverse the relationship)
The curve also helps identify what price the customers would be willing to pay
Reasons for the Law of Demand (why people buy less when price increases)
Income effect: when prices are low, people are easily able to afford it since their budget would allow it
As prices increase, people’s budget would tend to become tighter, as they wouldn’t be willing to spend more on a product
Substitution effect: when products price increase, they tend to increase in relative to other products
If product A were to become expensive, product B would most likely be cheaper than A
Due to the existence of substitutes, customers immediately leave product A for B
Diminishing marginal utility: As more units of a product are consumed, the satisfaction/utility it provides tends to decline
Apple users would purchase at maximum, a limited phones-they wouldn’t purchase a new iPhone every month since that extra phone would offer them no utility or not as much
Change in Quantity Demanded vs. Change in Demand
Change is the quantity demanded only occurs due to change in price-movement along the curve
If product A would become expensive(P2 to P1), the quantity demanded would fall (D2 toD1)
Changes in demand are when the entire curve would shift upwards or downwards
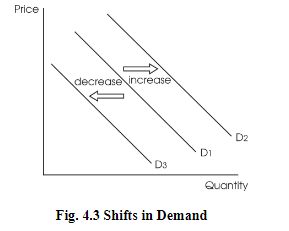
These are the determinants of demand which are variables causing consumers to buy more or less of a product, irrespective of the price
Determinants of the demand curve
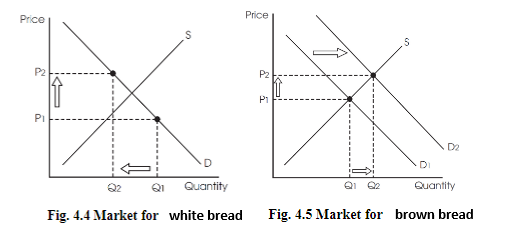
Substitutes Available
2 goods would be considered substitutes if an increase in the price of one good causes an increase in demand for the other good
Assuming brown bread is a substitute for white bread
If the price of white bread increases, people would tend to buy more brown bread in response
This would cause the demand curve for brown bread to shift upwards
Population preference
This is the consumer’s taste for a product at any point
If consumers like a product, the demand curve for that product shifts upwards and vice versa if they dislike it
A good example is when the trend of vegetarianism hit the public, the consumption of plant-based food drastically increased
Population/number of consumers
The bigger the market for a product, the more likely the demand curve would shift upwards
If country A has a low birth rate in a particular year, the demand curve for baby-related products would shift downwards
Income
Goods are usually categorized into 2 types, inferior and normal
Demand tends to decline (shift downwards) for inferior goods with an increase in consumer income
Demand for normal goods increases (shifts upwards) with an increase in consumer income
Assuming a middle-class family purchases 2 products only, margarine and bread
With an increase in income, the family would cut down the spending on margarine and move towards better-quality butter
Spending on bread would increase slightly (perhaps now the family buys 2 packets of bread)
In this scenario, the margarine is the inferior good and the bread’s the normal good
Complementary good
These goods are purchased separately but used together
The relation here is inverse of that of substitute goods
If 2 products are substitutes, an increase in the price of one good causes demand for the other good to decline as wellA good example would be that if razor blades became really expensive, demand for shaving cream would also decline
Notice here that no price change causes demand to fall for the cream but rather the fact that it was a complement to the razor blades
Expectation
Consumer expectation pays a major role in the determination of the price
if consumers expect that the price of something would increase in the future, they would buy the product at a larger scale leading to the demand curve shifting upwards
A good example would be when government warns of the possible chances of future inflation, leading to people stocking up on goods at their homes
Supply and the Law of Supply
Since price has a different impact on both buyers and sellers, the supply curve is different than a demand curve
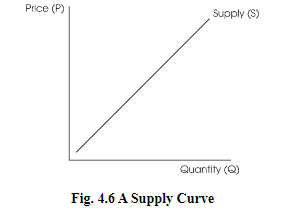
The market supply shows the quantity a supplier is willing and able to offer at various prices at a given time
The law of supply states that when prices increase, the supply increases as well (direct relation)
Reasons for the Law of Supply
Rising prices give greater opportunities to suppliers to earn a profit
With every additional unit, suppliers face an increase in the marginal cost of production
Charging higher prices provides them with the easiest way to cover the cost
The vice versa is also true; lower prices wouldn’t provide the incentive to motivate the supplier and thus reduces the quantity of product
Change in Quantity Supplied vs. Change in Supply
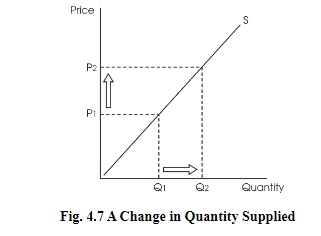
Change in quantity supplied only takes place when price change takes place
As price increases (P1-P2), the quantity supplied also increases from Q1 to Q2
The change occurs along the supply curve
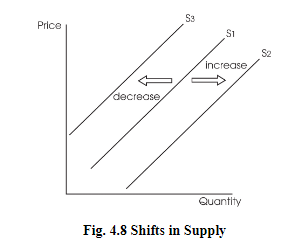
Shift in supply is due to the determinants of supply
Determinants of supply are the factors that influence the supplier to offer more or fewer goods at the same price
Determinants of Supply
Resource costs and availability
The cost of production (land, labor, capital) has an inverse impact on the supply
When the cost of these increases, the supplier decides to produce less of the products since he is unable to afford the production cost
Other goods and services
Suppliers who produce more than one product (profit-maximizing firms) have an easier time switching to the production of another product if issues do arise in prices
E.g. A farmer has land where he is able to produce corn and earn a profit
If his land is capable to produce wheat as well, in case the price of wheat increases to that of corn, he would switch to wheat production to earn better
The supply curve in this situation for wheat would shift outwards(more supply) and vice versa for corn(reduced supply)
Technology
Newer technology causes the cost of production to decline and helps improve the efficiency of the supplier
This allows the supplier to produce more, shifting the supply curve outwards(toward right)
E.g. machines on the production line help reduce unit costs due to which more products are affordable by the supplier
Taxes and Subsidies
Taxes are added up to the unit cost of production, thus making it more expensive
Due to this, heavily taxed products are produced in less quantity by suppliers(supply curve shifts towards left)
Subsidies are the opposite of taxes and help reduce price per unit
This allows suppliers to produce more of the product(supply curve shifts towards the right)
Expectation
If suppliers expect prices to increase in the future, they would hold back supply for the current time with the future goal of earning more profit later (and vice versa)
Number of sellers
As the number of sellers increases in the market, the supply automatically increases
This allows consumers more choices at a lower price due to an increase in competition
Market Equilibrium: Supply and Demand Together
The market equilibrium price is that price which the market sets, where buyers buy the exact amount which the sellers are willing to produce
It’s also known as market-clearing price

A surplus would only exist when the quantity supplied is greater than the quantity demanded
In a competitive market where a surplus exists, prices eventually fall back to the equilibrium
A shortage would only exist when the quantity demanded is greater than the quantity supplied
In a competitive market where a shortage exists, prices eventually get pulled back up to equilibrium
This is because the shortage creates more demand from buyers
The suppliers utilize this and supply more at higher prices, thus bringing prices back up
Disequilibrium
This occurs when there is a shortage or surplus in the market
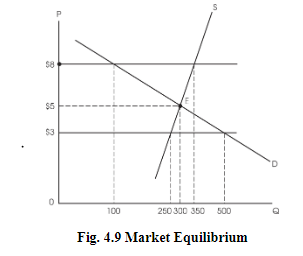
Consider the price $8 where the demand is 100 and the corresponding supply is 350
This surplus is what creates market disequilibrium
Changes in Equilibrium (solving demand and supply-related questions)
Is it supply, demand, or both?
Is it an increase (shift to the right) or a decrease (shift to the left)?
Supply increases towards the right and decreases towards left
Demand increases towards the right (moves upwards) and decreases towards the left (moves downwards)
Just shift it, noting your new equilibrium price and quantity
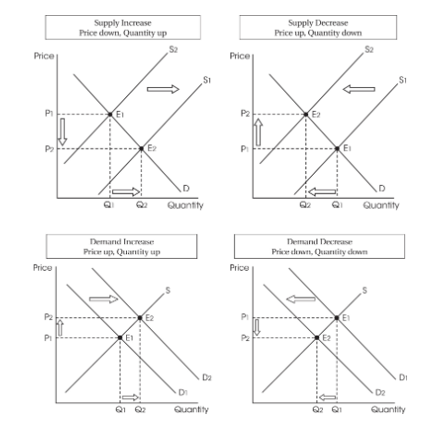
When supply is constant and only demand increases, equilibrium price and quantity increases
When supply is constant and only demand decreases, equilibrium price and quantity decreases
When demand is constant and only supply increases, equilibrium price and quantity decreases
When demand is constant and only supply decreases, equilibrium price and quantity increases
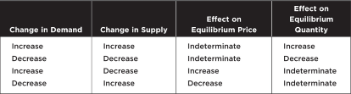
The Double-Shift Rule
This rule states that when there is a simultaneous shift in both demand and supply, either price or quantity would stay indeterminate
Chapter 4: Demand and Supply (The Basics)
Demand an the Law of Demand
Demand for a product is the quantity the customers are willing and able to pay for each and every price
The law of demand states that as price increases, demand for that product decreases (inverse the relationship)
The curve also helps identify what price the customers would be willing to pay
Reasons for the Law of Demand (why people buy less when price increases)
Income effect: when prices are low, people are easily able to afford it since their budget would allow it
As prices increase, people’s budget would tend to become tighter, as they wouldn’t be willing to spend more on a product
Substitution effect: when products price increase, they tend to increase in relative to other products
If product A were to become expensive, product B would most likely be cheaper than A
Due to the existence of substitutes, customers immediately leave product A for B
Diminishing marginal utility: As more units of a product are consumed, the satisfaction/utility it provides tends to decline
Apple users would purchase at maximum, a limited phones-they wouldn’t purchase a new iPhone every month since that extra phone would offer them no utility or not as much
Change in Quantity Demanded vs. Change in Demand
Change is the quantity demanded only occurs due to change in price-movement along the curve
If product A would become expensive(P2 to P1), the quantity demanded would fall (D2 toD1)
Changes in demand are when the entire curve would shift upwards or downwards
These are the determinants of demand which are variables causing consumers to buy more or less of a product, irrespective of the price
Determinants of the demand curve
Substitutes Available
2 goods would be considered substitutes if an increase in the price of one good causes an increase in demand for the other good
Assuming brown bread is a substitute for white bread
If the price of white bread increases, people would tend to buy more brown bread in response
This would cause the demand curve for brown bread to shift upwards
Population preference
This is the consumer’s taste for a product at any point
If consumers like a product, the demand curve for that product shifts upwards and vice versa if they dislike it
A good example is when the trend of vegetarianism hit the public, the consumption of plant-based food drastically increased
Population/number of consumers
The bigger the market for a product, the more likely the demand curve would shift upwards
If country A has a low birth rate in a particular year, the demand curve for baby-related products would shift downwards
Income
Goods are usually categorized into 2 types, inferior and normal
Demand tends to decline (shift downwards) for inferior goods with an increase in consumer income
Demand for normal goods increases (shifts upwards) with an increase in consumer income
Assuming a middle-class family purchases 2 products only, margarine and bread
With an increase in income, the family would cut down the spending on margarine and move towards better-quality butter
Spending on bread would increase slightly (perhaps now the family buys 2 packets of bread)
In this scenario, the margarine is the inferior good and the bread’s the normal good
Complementary good
These goods are purchased separately but used together
The relation here is inverse of that of substitute goods
If 2 products are substitutes, an increase in the price of one good causes demand for the other good to decline as wellA good example would be that if razor blades became really expensive, demand for shaving cream would also decline
Notice here that no price change causes demand to fall for the cream but rather the fact that it was a complement to the razor blades
Expectation
Consumer expectation pays a major role in the determination of the price
if consumers expect that the price of something would increase in the future, they would buy the product at a larger scale leading to the demand curve shifting upwards
A good example would be when government warns of the possible chances of future inflation, leading to people stocking up on goods at their homes
Supply and the Law of Supply
Since price has a different impact on both buyers and sellers, the supply curve is different than a demand curve
The market supply shows the quantity a supplier is willing and able to offer at various prices at a given time
The law of supply states that when prices increase, the supply increases as well (direct relation)
Reasons for the Law of Supply
Rising prices give greater opportunities to suppliers to earn a profit
With every additional unit, suppliers face an increase in the marginal cost of production
Charging higher prices provides them with the easiest way to cover the cost
The vice versa is also true; lower prices wouldn’t provide the incentive to motivate the supplier and thus reduces the quantity of product
Change in Quantity Supplied vs. Change in Supply
Change in quantity supplied only takes place when price change takes place
As price increases (P1-P2), the quantity supplied also increases from Q1 to Q2
The change occurs along the supply curve
Shift in supply is due to the determinants of supply
Determinants of supply are the factors that influence the supplier to offer more or fewer goods at the same price
Determinants of Supply
Resource costs and availability
The cost of production (land, labor, capital) has an inverse impact on the supply
When the cost of these increases, the supplier decides to produce less of the products since he is unable to afford the production cost
Other goods and services
Suppliers who produce more than one product (profit-maximizing firms) have an easier time switching to the production of another product if issues do arise in prices
E.g. A farmer has land where he is able to produce corn and earn a profit
If his land is capable to produce wheat as well, in case the price of wheat increases to that of corn, he would switch to wheat production to earn better
The supply curve in this situation for wheat would shift outwards(more supply) and vice versa for corn(reduced supply)
Technology
Newer technology causes the cost of production to decline and helps improve the efficiency of the supplier
This allows the supplier to produce more, shifting the supply curve outwards(toward right)
E.g. machines on the production line help reduce unit costs due to which more products are affordable by the supplier
Taxes and Subsidies
Taxes are added up to the unit cost of production, thus making it more expensive
Due to this, heavily taxed products are produced in less quantity by suppliers(supply curve shifts towards left)
Subsidies are the opposite of taxes and help reduce price per unit
This allows suppliers to produce more of the product(supply curve shifts towards the right)
Expectation
If suppliers expect prices to increase in the future, they would hold back supply for the current time with the future goal of earning more profit later (and vice versa)
Number of sellers
As the number of sellers increases in the market, the supply automatically increases
This allows consumers more choices at a lower price due to an increase in competition
Market Equilibrium: Supply and Demand Together
The market equilibrium price is that price which the market sets, where buyers buy the exact amount which the sellers are willing to produce
It’s also known as market-clearing price
A surplus would only exist when the quantity supplied is greater than the quantity demanded
In a competitive market where a surplus exists, prices eventually fall back to the equilibrium
A shortage would only exist when the quantity demanded is greater than the quantity supplied
In a competitive market where a shortage exists, prices eventually get pulled back up to equilibrium
This is because the shortage creates more demand from buyers
The suppliers utilize this and supply more at higher prices, thus bringing prices back up
Disequilibrium
This occurs when there is a shortage or surplus in the market
Consider the price $8 where the demand is 100 and the corresponding supply is 350
This surplus is what creates market disequilibrium
Changes in Equilibrium (solving demand and supply-related questions)
Is it supply, demand, or both?
Is it an increase (shift to the right) or a decrease (shift to the left)?
Supply increases towards the right and decreases towards left
Demand increases towards the right (moves upwards) and decreases towards the left (moves downwards)
Just shift it, noting your new equilibrium price and quantity
When supply is constant and only demand increases, equilibrium price and quantity increases
When supply is constant and only demand decreases, equilibrium price and quantity decreases
When demand is constant and only supply increases, equilibrium price and quantity decreases
When demand is constant and only supply decreases, equilibrium price and quantity increases
The Double-Shift Rule
This rule states that when there is a simultaneous shift in both demand and supply, either price or quantity would stay indeterminate