Option C: Ecology and Conservation
C1 Species and Communities
- Survival factors
- U: The distribution of species is affected by limiting factors
- Limiting factor = a component of an ecosystem which limits the distribution or numbers of a population
- Defines optimal survival conditions according to its effect on a species when in deficiency or excess
- Can be biotic or abiotic
- Biotic factors include interactions between organisms
- Either intraspecific (within a species)
- Or interspecific (between species)
- Abiotic factors include environmental conditions
- E.g. light, temperature, salinity (concentration of salts in water or soils), rainfall, wind velocity, soil pH, etc.
- Typical abiotic limiting factors for plants within a community
- Temperature
- Plants can only survive within a narrow range of temperatures to which they are adapted
- High temperatures will increase the rate of water loss by evaporation and may also denature metabolic enzymes
- Low temps may cause plant sap to freeze
- The expansion of frozen water in xylem can cause trunks to split
- Certain species of woody plants synthesis antifreeze protein to prevent crystal formation in frozen cells
- E.g. maple trees
- Water availability
- Water is needed for photosynthetic processes + maintaining cell turgor
- Xerophytes are plant species that are adapted to survive in dry and arid environments such as deserts
- E.g. cacti
- Hydrophytes are plant species that are adapted to survive in frequently waterlogged soils
- E.g. rice
- Light availability
- Light is essential to the process of photosynthesis whereby plants produce organic molecules
- Low-growing plants will typically possess darker leaves in order to optimize their light conversion
- Dark = more chlorophyll
- Certain seaweeds have pigments adapted to absorbing blue wavelengths
- E.g. kelp
- Red does not easily penetrate water
- Typical abiotic limiting factors for animal within a community
- Temperature
- Animal survival typically relies on narrow temperature range
- Few animals can survive temperature extremes
- Poikilotherms cannot maintain thermal homeostasis and must occupy environments according to temperature needs
- Homeotherms can regulate their own internal body temperatures and hence can occupy a wider range of habitats
- Body size will play a fundamental role in determining an animal’s capacity to retain heat
- The surface area to volume ratio
- Territory
- Territorial boundaries may determine an animal's capacity to attract mates, rear young, forage for food and avoid predators
- Territories may be temporary (e.g. migration, breeding sites) or alternatively may be permanent
- In certain species, juveniles may have different environmental requirements to adults
- E.g. tadpoles and frogs
- Establishment of territories can lead to intraspecific and interspecific competition
- Food availability
- Availability of food supply is a critical determinant in influencing population size and distribution
- Animals may require a particular plant or animal species as a food source
- This limits their spread to certain regions
- Seasonal or geographic variations may directly affect food availability within a population
- E.g. seasonal migrations
- Law of Tolerance
- The Law of Tolerance was proposed by Victor Ernest Shelford (American zoologist) in 1911
- States that populations have optimal survival conditions within critical minimal and maximal thresholds
- When populations are exposed to the extremes of a particular limiting factor (too much or too little), the survival rates drop
- The distribution of species in response to a limiting factor is a bell-shaped curve with 3 distinct regions
- The optimal zone
- Central portion of a curve which has conditions that favor maximal reproductive success and survivability
- Zones of stress
- Regions flanking the optimal zone where organisms can survive but with reduced reproductive success
- Zones of intolerance
- Outermost regions in which organisms cannot survive
- Represents the extremes of the limiting factor
- Example:
- A: Distribution of one animal and one plant species to illustrate limits to tolerance and zones of stress
- Plant example
- Plant growth varies greatly in response to salinity levels (concentrations of salt within the soil)
- Plants that are not salt tolerant are called glycophytes
- They are easily damaged by high salinity
- Most plant species are considered glycophytes
- Plants that are salt tolerant are called halophytes
- They may become stressed in freshwater environments
- Less than 2% of all plants are halophytes
- Cultivation of land for agriculture causes the water table to rise and concentrates salt at the roots
- Such cultivation includes irrigation and grazing
- This makes it harder for glycophytes to extract water from the soil and the uptake of salt can be toxic to the plant
- Understanding salt tolerance for different plant species is therefore critically important to effective crop farming
- Animal example
- Coral species form connected reefs → these are greatly impacted by changes in oceanic temperature
- Coral polyps receive nutrition from photosynthetic zooxanthellae that lives within the polyp’s endodermis
- Zooxanthellae = an algae
- Endodermis = an inner layer of cells in the cortex of the root
- The Zooxanthellae cannot survive in lower ocean temperatures
- Below 18 degrees Celsius
- Increases in ocean temperature cause Zooxanthellae to leave the coral tissue → this leads to coral bleaching
- Above 35 degrees Celsius
- Reef-building coral species therefore have a typical optimal growth range in temperate waters between 20 and 30 degrees Celsius
- This correlates to the tropical and sub-tropical regions of the world (near the equator)
- Species distribution
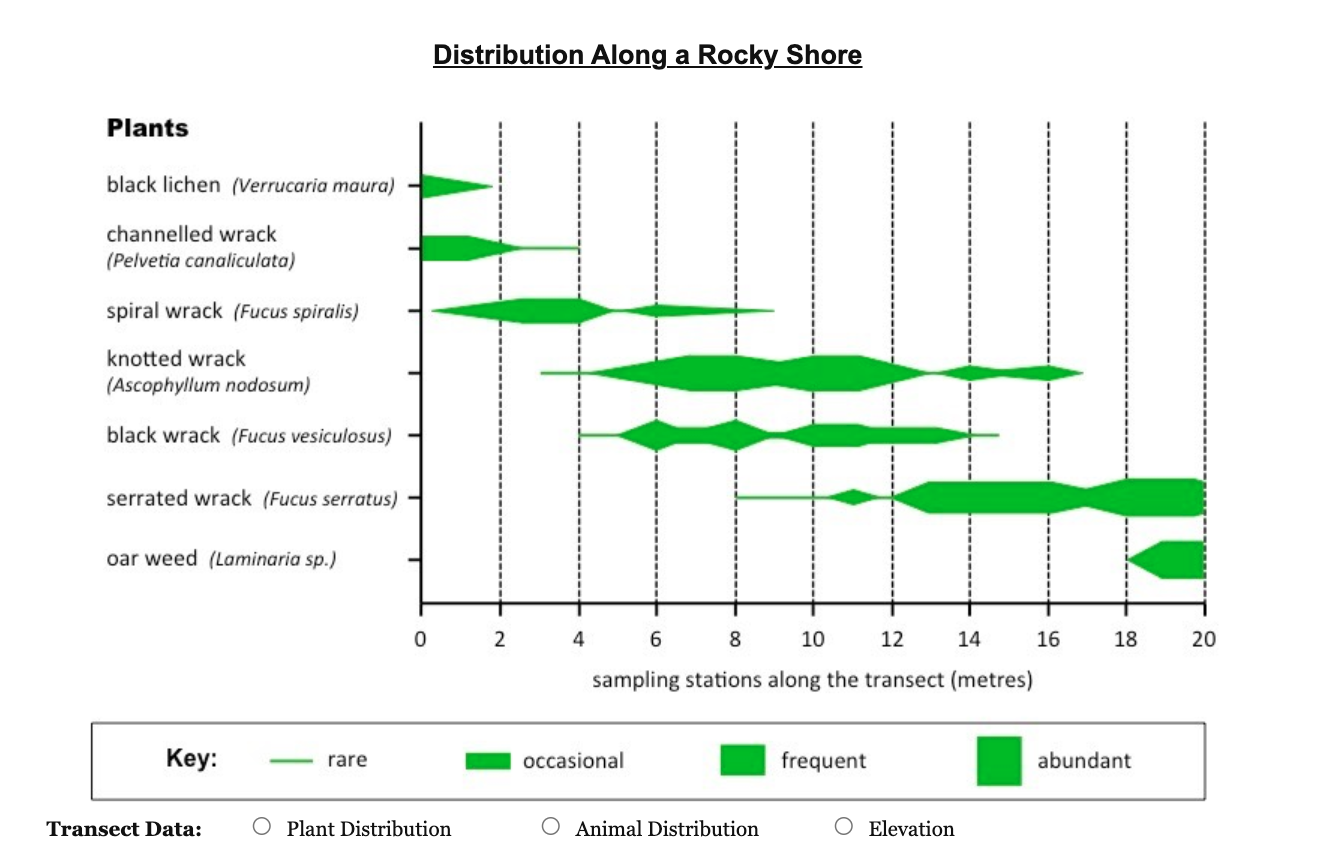
- S: Use of a transect to correlate the distribution of plant or animal species with an abiotic variable
- Quadrats and transects can measure the distribution of a plant or animal species in response to an incremental abiotic factor
- Incremental = happening gradually
- Quadrats = rectangular frames of known dimensions than can be used to establish population densities
- Transects = a straight line along an abiotic gradient from which population data can be recorded to determine a pattern
- Quadrats and transects are used together
- Quadrats are placed at regular intervals along the transect line to generate population data
- Basically, placing a quadrat down regularly and observing/counting the difference in distribution of X species based on the change of Y abiotic variable
- The quadrats will show the changing distribution pattern of a species in response to a change in an abiotic variable
- This data can be used to identify optimal conditions + zones of stress and zones of tolerance
- Sampling with Quadrats and Transects
- Quadrat counting method: count all variables mostly inside the quadrat (not mostly out)
- Line transects: find a line, place quadrat every x meters
- Transect data
- Transects are used to assess species distribution in correlation with any abiotic factor that varies across a measurable distance
- These factors could include elevation, elemental exposure, temperature, light levels, pH, humidity and more
- A kite graph with the transect data can be used to represent changes in species distribution in a clear and effective fashion
- The relative width of each kite represents the abundance of an organism at a particular point along a transect
- Example:
- Ecological niche
- U: Each species plays a unique role within a community because of the unique combination of its spatial habitat and interactions with other species
- Ecological niche = the functional position and role of an organism within its environment
- Consists of all physical and biological conditions which determine the organism’s survival and reproductive prospects
- Is comprised of various components, including:
- The habitat in which an organism lives
- The activity patterns of the organism
- E.g. periods of time during which it is active
- The resources it obtains from the environment
- E.g. food sources, territorial boundaries, etc.
- The interactions that occur with other species in the community
- E.g. predator prey relationships, competition, etc.
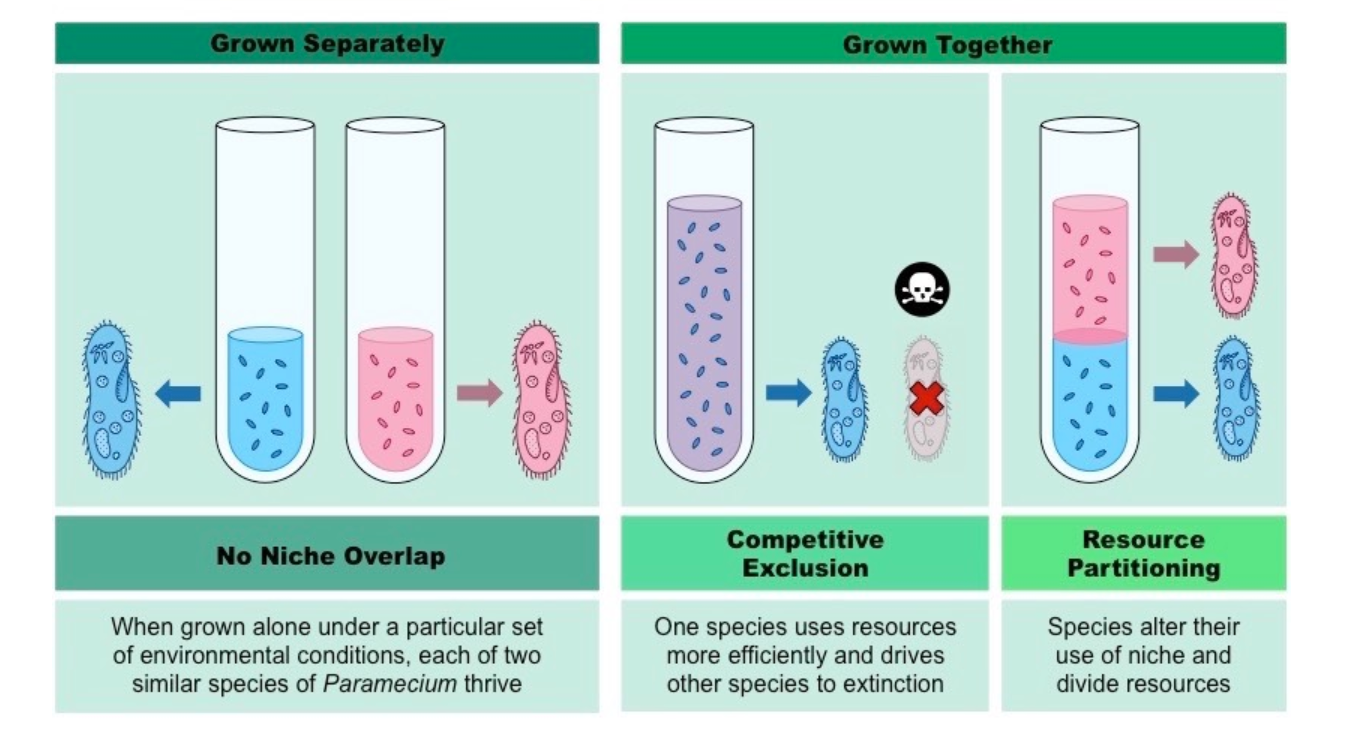
- U: Two species cannot survive indefinitely in the same habitat if their niches are identical
- If two distinct species share an identical niche, there will be interspecific competition for available space and resources
- This competition will result in the fitness of one being lowered by the presence of the other
- The less well-adapted species will struggle to survive and reproduce
- Eventually it will be eliminated from the niche
- Interspecific competition within a shared niche will typically prompt one of two responses
- Competitive exclusion → one species uses the resources more efficiently, driving the other species to local extinction
- Resource partitioning → both species alter their use of the habitat to divide resources between them
- Niche separation
- Niche differentiation diagram:
- S: Analysis of a data set that illustrates the distinction between fundamental and realized niche
- Some species may not be able to occupy their entire niche due to the presence or absence of other species
- Hence, a species may occupy a small subset of their niche than is theoretically possible
- This creates fundamental vs. realized niche
- Fundamental niche = the entire set of conditions under which an organism can survive and reproduce (where it could live)
- The theoretical habitat
- Example: in a rocky shore environment, the Chtalamus barnacle can potentially occupy the entire rocky shore, if in isolation
- Realized niche = the set of conditions used by an organism after including interactions with other species (where it does live)
- The actual habitat that is completely occupied by an organism in the presence of competing species
- Example: the Chtalamus barnacle only occupies regions where the Semibalanus barnacle is absent
- Diagrams:
- Niches
- Experimental data
- Types of barnacles
- Niches
- Species interactions
- U: Interactions between species in a community can be classified according to their effect
- In nature, no species exist in total isolation → all organisms interact with both the abiotic environment and other organisms
- The interactions between species can be classified according to their effect on the organisms involved
- Herbivory
- The act of eating only plant matter
- That’s why primary consumers are called herbivores
- Herbivores ay employ different feeding strategies
- E.g. mucivores feed on plant sap while granivores feed on seeds, etc.
- Herbivory can be either harmful or beneficial to plant species as a whole
- Harmful: Certain types of beetle may feed voraciously on the leaves which causes crop failure
- Beneficial: Fruit-eating animals spread the seeds from a fruit in their feces, which promotes overall seed dispersal
- Examples of herbivores: Rabbit, cow
- Predation
- A biological interaction whereby one organism hunts and feeds on another organism
- Predator and prey
- The dependance of the predator on the prey as a food source intertwines their population levels
- If the prey population drops, the predator numbers will fall as well as intraspecific competition has to increase
- If the prey population rises, predator numbers will increase as a result of the ober-abundance of a food source
- No intraspecific competition necessary = even the weakest survives
- Diagram:
- Symbiosis
- Close and persistent long-term interaction between two species
- Can be obligate (required for survival)
- Or facultative (advantageous without being strictly necessary)
- Symbiotic relationships can be beneficial to either one or both organisms in the partnership
- Mutualism – both species benefit from the interaction
- Example: how anemone protects clownfish and clownfish provides fecal matter for food
- Commensalism – one species benefits, the other is unaffected
- Example: barnacles are transported to plankton-rich waters by whales
- Parasitism – one species benefits to the detriment of the other species
- Example: ticks or fleas feed on the blood of their canine host
- Diagram:
- A: Local examples to illustrate the range of ways in which species can interact within a community
- Mutualism
- Ongoing interaction between two species whereby both species benefit from the interaction
- Examples:
- Honey bees gather nectar from flowers and distributes pollen between plants
- This mediates the plant life cycle
- Plover birds pick food morsels from between the jaws of crocodiles, cleaning their teeth in the process
- Zooxanthellae photosynthesise within the protective environment of the polyp’s endodermis
- This feeds the coral
- Commensalism
- Ongoing interaction between two species whereby one benefits and the other is unaffected
- Examples:
- Remora attaches to the underside of larger predatory fish and feed off the uneaten food scraps
- Monarch butterflies can safely store poisonous chemical produced by milkweeds discourage predators from eating it
- Decorator crabs remove small fragments of tissue from sea sponges and uses them as a source of camouflage
- Parasitism
- Ongoing interaction between two species whereby one species benefits at the other’s expense
- Examples:
- Ticks infest the skin and fur of host animals, feeding off the host and potentially causing disease
- Leeches attach to the skin and drinks the blood of the host animal until fully engorged
- Tongue-eating louses eat the tongue of a fish and may still later ingested food
- A: The symbiotic relationship between Zooxanthellae and reef-building coral reef species
- Reef-building coral will form a mutualistic symbiotic relationship with the photosynthetic unicellular algae Zooxanthellae
- Coral are colonial organisms made up of individual polyps that are connected by a layer of living tissue
- The algae lives within the cells of the coral’s endodermis (the innermost lining of the animal)
- The coral provides the algae with a protective environment and source of inorganic compounds
- Coral polyps secrete calcium carbonate to build a stony skeleton which encases the polyps and the Zooxanthellae
- Coral polyps also recycle the waste products of the algae and supplies the Zooxanthellae with CO2
- The Zooxanthellae in turn provides the coral polyps with a necessary source of nutrition
- The alage supplies the coral with oxygen, glucose and other organic molecules that it produces via photosynthesis
- The algae also helps the coral remove necessary waste products
- Diagram of their mutualistic relationship:
- Coral bleaching
- It is the Zooxanthellae that gives the coral its vibrant pigmentation
- When there is a large scale loss of Zooxanthellae from the coral due to environmental stress, bleaching of the coral occurs
- This causes the coral to starve and die unless the Zooxanthellae are restored
- Conditions which can cause coral bleaching include:
- Changes in light availability
- E.g. sedimentation may increase the opacity of the oceanic waters
- Temperature increases
- Water temperatures in excess of 30 degrees Celsius can irrevocably stress the Zooxanthellae
- Ocean acidification
- The buildup of CO2 concentrations in the ocean can lower pH and stress the Zooxanthellae
- Keystone species
- U: Community structure can be strongly affected by keystone species
- Keystone species = a species that has a disproportionately large impact on the environment relative to its abundance
- Name comes from the keystone in an arch → it fundamentally supports the whole structure and prevents it from collapsing
- Keystone species may influence communities in a number of ways:
- Predators can exert pressure on lower trophic levels to prevent them from monopolizing certain resources
- Mutualists can support the life cycle of a variety of species within a community
- E.g. pollinators and seed dispersal
- Engineers can refashion the environment in a manner that promotes the survival of other species
- Engineer = any species that creates, significantly modifies, maintains and/or destroys habitats
- Numerous examples of keystone species within different communities, such as:
- Sea stars (predators) prey on urchins and mussels, which prevents mussel overpopulation and coral reef destructions by urchins
- Honey bees (mutualist) pollinate a wide variety of plant species, ensuring the continuation of the plant life cycle
- Beavers (engineer) build dams that transform the environment in a manner that allows certain other species to survive
- Keystone species are not the dominant species (most numerous) within a community nor do they have to be apex predators
- Diagram of consequences of removal of keystone species:


\n
C2 Communities and ecosystems
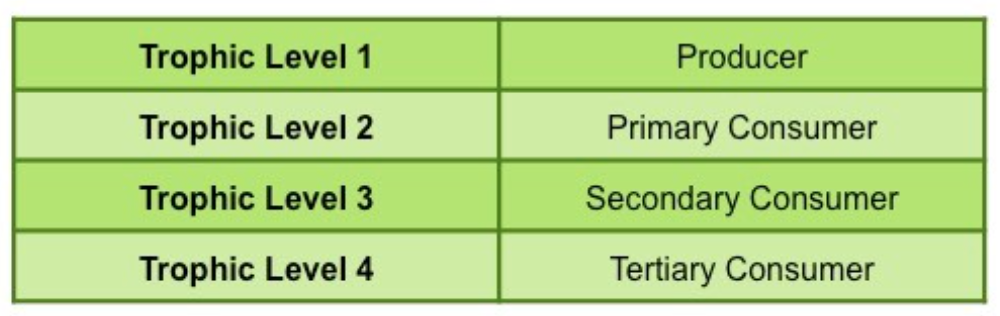
- Trophic levels
- U: Most species occupy different trophic levels in multiple food chains
- Trophic level = the position an organism occupies within a feeding sequence
- Producers occupy the first trophic level in a feeding sequence
- Primary consumers feed on producers → second trophic level
- Secondary consumers feed on primary → third trophic level
- Further consumers occupy the subsequent levels
- Diagram:
- Food chain = shows linear feeding relationships between species in a community
- Arrows represent the transfer of energy and matter
- This transfer happens as one organism is eaten by the other
- The arrows point in the direction of energy flow
- Goes from the producer to the consumers
- Most species’ feeding requirements means they will be in multiple food chains where they may occupy a different trophic level
- As few species only feed on one other species
- E.g.:
- U: A food web shows all the possible food chains in a community
- Links food chains together into more complex and interrelated feeding relationships
- More representative of actual feeding pathways within an ecosystem because
- Organisms can have more than one food source
- Organisms can have more than one predator
- Hence, organisms can also occupy more than one trophic level
- Tip! When constructing food webs, position organisms at their highest trophic level (from left to right) as it keeps all arrows pointing in the same directions
- Example:
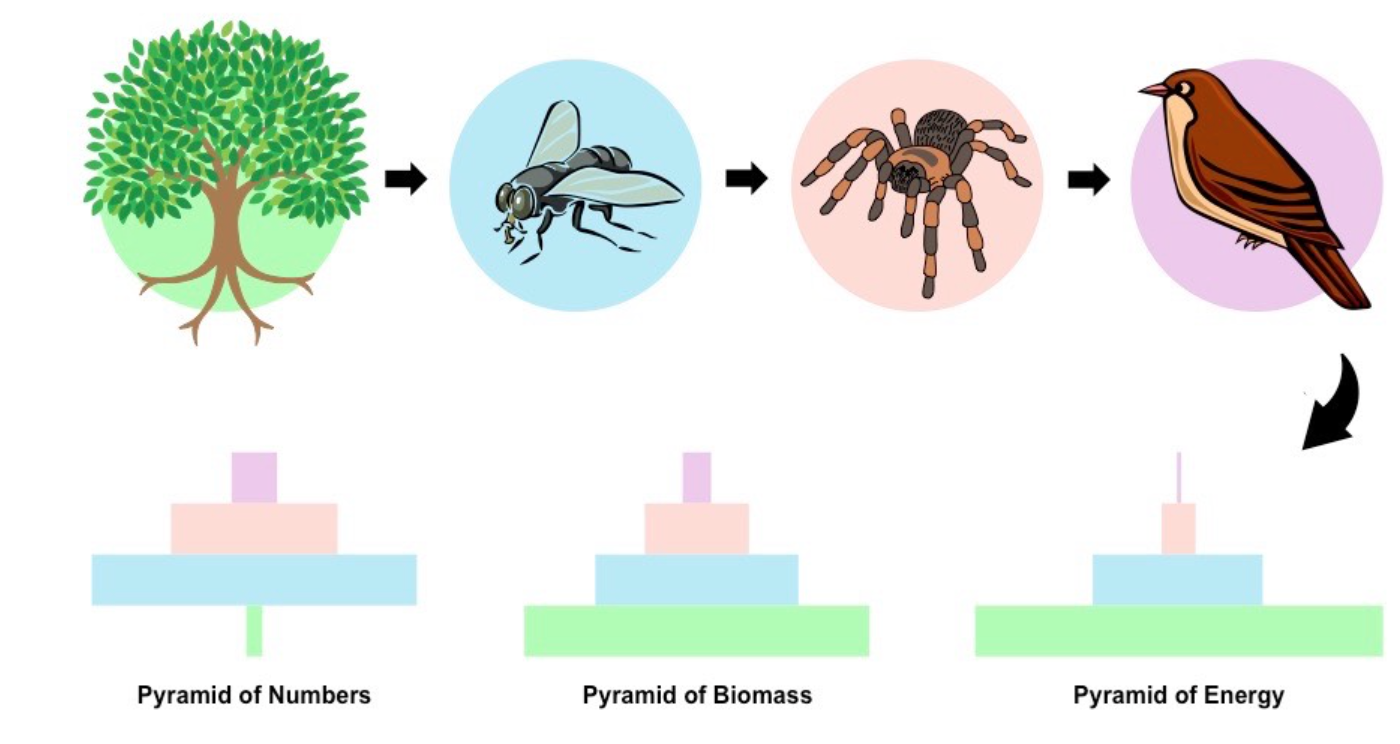
- EC: Ecological Pyramids
- Ecological pyramids show the relative amounts of a specific component at the different trophic levels of an ecosystem
- The three main types measure species numbers, biomasses and energy
- Pyramid of Numbers
- Shows the relative number of organisms at each stage of a food chain
- Are usually shaped like pyramids → higher trophic levels cannot be sustained if there are more predators than prey
- However, the shape may be distorted if a food source is disproportionately large in size/biomass compared to the feeder
- E.g. a large number of caterpillars may feed on a single oak tree
- Pyramid of Biomass
- Shows the total mass of organisms at each stage of a food chain
- Almost always upright in shape as biomass diminished along food chains as CO2 and waste is released
- An exception to this rule is found in marine ecosystems where zooplankton have a larger total biomass than phytoplankton
- Because phytoplankton replace their biomass at such a rapid rate and can therefore support a larger biomass of zooplankton
- Pyramid of Energy
- Shows the amount of energy trapped per area in a given time period at each stage in a food chain
- Always upright in shape as energy is lost along food chains
- Either used in respiration or lost as heat
- Each level in the pyramid is roughly one tenth the size of the preceding level as energy transformations are ca. 10% efficient
- Examples of pyramids:
- Energy conversions
- U: The percentage of ingested energy converted to biomass is dependent upon the respiration rate
- Ecological production/productivity refers to the rate at which biomass is generated in an ecosystem
- Usually expressed in units of mass per area per time
- km m^-2 day^-1
- Biomass = total dry weight of organic matter in organisms or ecosystems
- The entirety of all biologically produced organic matter
- E.g. proteins, carbohydrates, etc.
- The percentage of energy that is converted into biomass is dependent upon a number of factors that lose energy
- Energy is lost as inedible materials (bones, teeth, hair)
- Energy is lost via excretion of undigested or unabsorbed materials
- Energy is lost as heat from cellular respiration
- The higher respiration rate results in more heat lost
- Primary production = the production of chemical energy in organic compounds by producers
- The main source of energy for primary production is sunlight
- Sometimes chemosynthesis by lithotrophs
- Can be categorized as one of two types:
- Gross primary production (GPP) → the amount of chemical energy as biomass that a producer creates in a given length of time
- Net primary production (NPP) → the amount of chemical energy that is not consumed by respiration
- GPP - respiration
- Secondary production ? the generation of biomass by heterotrophic organisms (consumers)
- Biomass generation is driven by the transfer of organic compounds between trophic levels via feeding
- Secondary production may also be categorized according to gross and net amounts of biomass
- Gross = total
- Net = usable
- Diagram explaining how ingested energy converted to biomass depends on respiration:
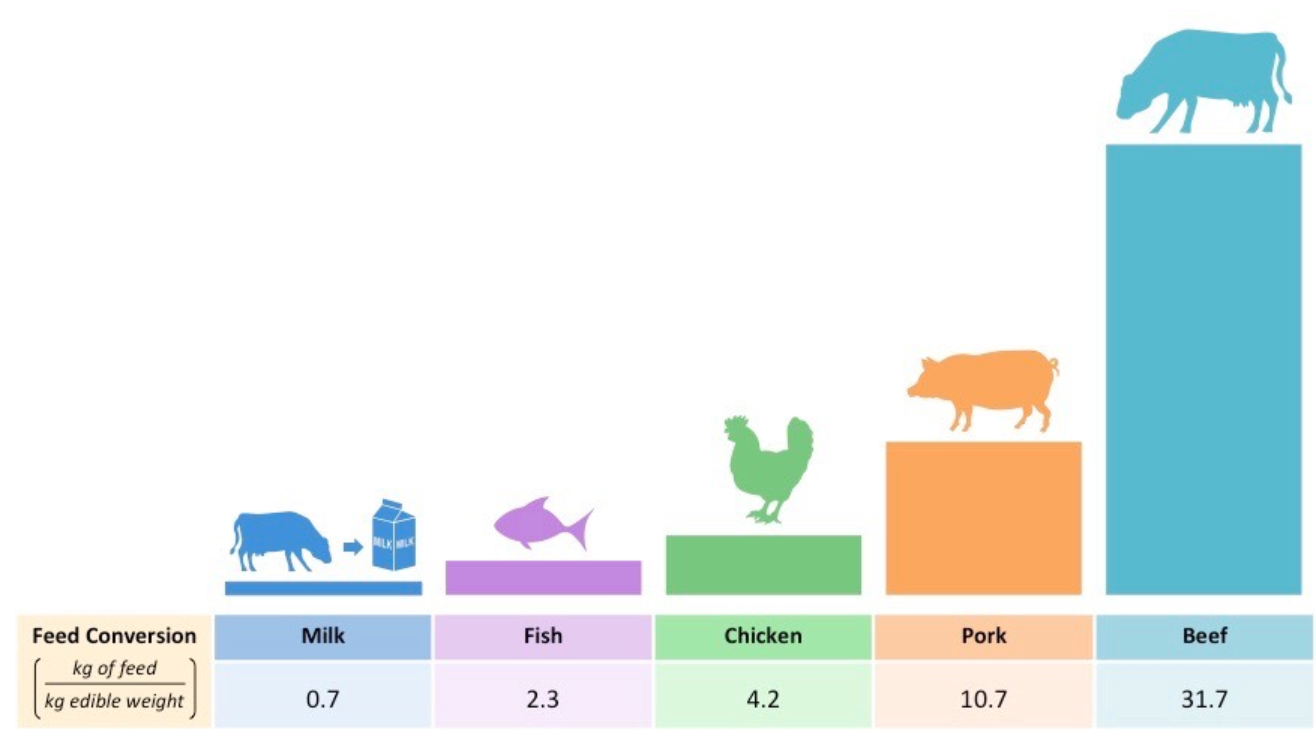
- Feed Conversion Ratio
- A: Conversion ratio in sustainable food production practices
- Feed Conversion Ratio (FCR) = mass of feed/mass of desired output
- FCR measure the efficiency of an animal in converting food into a desired output
- The lower the FCR the more efficient the method of food production
- Low FCR is achieved by minimizing the potential losses of energy for the animal stock
- Restricting animal movement will reduce energy lost to cell respiration
- Optimizing feeding practices so that food is ingested and digested more effectively
- Slaughtering animals at a young age
- As older animals tend to grow more slowly and have a higher FCR
- Theoretically the most efficient FCR is best as it lowers cost, however there are a number of potential ethical issues involved
- Is it ethical to restrict animals and kill them early?
- Diagram displaying the FCRs of different species:
- EC: Sustainable food practices
- Most of the protein found in Western human diets comes from farmed animal meet
- E.g. cattle and poultry
- These animals must be fed and housed → this creates an ecological footprint, the size of which depends on the FCR
- Sustainable food practices provide food for the consumer while minimizing the environmental impact of the food source
- The benefits of lowering food production costs must be balanced against ethical considerations regarding animal treatment
- One sustainable food practice is the use of crickets as a protein source (as opposed to cattle)
- Crickets have a substantially lower FCR → minimizes feed costs
- They require significantly less water → minimizes water usage
- They can reproduce much faster and require less space
- Produce far less methane
- For these reasons, certain health professionals are advocating the introduction of crickets into normal diets
- The advantages of crickets as a food source is still debated though, so implementation is likely to be slow
- Types of Ecosystems
- U: In closed ecosystems energy but not matter is exchanged the with the surroundings
- Ecosystems can either be open or closed, depending on whether matter moves into and out of the system
- A closed ecosystems exchanges energy with its surrounding, but not matters
- It is self-contained
- E.g. a mesocosm
- An open ecosystem changes both energy and matter with surrounding environments
- A natural ecosystem such as a forest
- U: The type of stable ecosystem that will emerge in an area is predictable based on climate
- Ecosystem = the interaction of living and non-living things within an area
- A community and its abiotic environment
- Particular types of stable ecosystems will emerge in a given geographical area according to its climate conditions
- Biome = a geographical area that has a particular climate and sustains a specific community of plants and animals
- Basically a specific type of natural ecosystem, created from its climate and environment
- The main factors affecting the distribution of biomes is temperature and rainfall
- These factors vary according to latitude, longitude, altitude, proximity to ocean, etc.
- Many different biomes are found across continents, including:
- Tropical rainforests
- Hot and humid environments
- Near the equator
- Dense vegetation
- High biodiversity
- Taiga
- Coniferous forests
- Near the poles
- Have cold temperatures
- Little precipitation
- Moisture trapped as snow or ice
- Deserts
- Dry and arid environments
- Display extreme temperature conditions (hot and cold)
- Picture examples:
- EC: Types of Biomes
- Biomes are geographical area that have a particular climate and sustain a specific community of flora and fauna
- The total area where all living things are found is called the biosphere
- The totality of biomes
- Certain biomes are named and recognized according to their specific characteristics
- Tropical rainforest
- Hot climate → 25-30 degrees Celsius
- Very high levels of precipitation → > 250 cm per year
- Large diversity in species
- Vegetation includes epiphytes, tall trees and undergrowth
- Epiphytes: organisms that grow on the surface of plants
- Temperate forest
- Also called deciduous forests
- Moderate temperatures and clear seasonal changes
- Growing period of around 200 days during 4-6 frost free months
- Boreal forest (Taiga)
- Coniferous forests
- Cold and icy → 0-15 degrees Celsius
- Only small amount of precipitation
- Coniferous trees are densely packed and there is little variation in species
- Tropical Grassland (Savannah)
- Warm → 20-30 degrees Celsius
- Medium amounts of moisture, although seasonal droughts are common
- Trees are intermittent and widely spaced
- Occasional fires prevents thicker vegetation from encroaching
- Temperate Grassland
- Moderate temperatures and amounts of rainfall
- Trees and shrubs are largely absent
- Grass is the dominant vegetation
- Mediterranean (Chaparral)
- Moderate temperatures → 15-25 degrees Celsius
- Rainy winters and dry summers
- Vegetation consists of dry woody shrubs that are quick to grow
- Desert
- Extreme temperature conditions → > 30 degrees Celsius during the day, < 0 degrees at night)
- Very low precipitation
- < 30 cm per year
- Dominant plant species are xerophytes which are adapted for water conservation
- Tundra
- Freezing temperatures → < 0 degrees Celsius
- Very little precipitation
- Vegetation is low growing
- E.g. mosses
- Perennial plants may grow during the summer
- Mountain ranges
- Found all over the world at high attitudes → > 10 000 feet
- Temperatures are typically low due to the altitude
- Weather conditions may change rapidly
- Distribution of biomes in the biosphere:
- Ecosystem Analysis
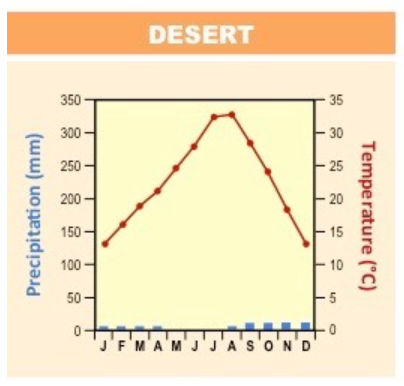
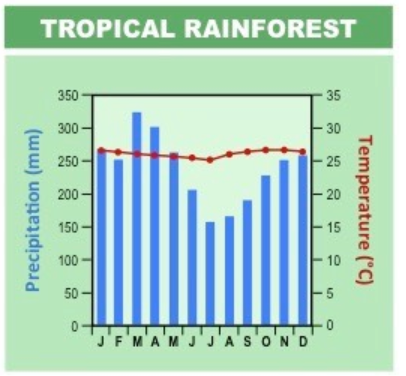
- S: Analysis of a climograph showing the relationship between temperature, rainfall and the type of ecosystem.
- Climograph = graphical representation of basic climate parameters at a given geographical location
- Shows a combination of monthly average temperature and precipitation at a certain location
- Precipitation = rainfall
- Provides a quick overview of the climate of a region and can be used to identify seasonal patterns and changes
- Examples:
- Whittaker’s climograph
- In 1975, ecologist Robert Whittaker developed a holistic climograph that allowed for the classifying of 9 distinct biomes
- Biomes distinguished according to their average yearly temperatures and precipitation
- Deserts typically have high average temperatures but low precipitation
- Hot and dry
- Rainforests typically have high average temperatures and high precipitation
- Hot and wet
- Taigas typically have low average temperatures and reasonably low precipitation
- Cold and icy
- S: Comparison of pyramids of energy from different ecosystems
- Pyramids of energy (PoE) = diagram of the flow of energy between trophic levels
- Measures in units of energy per area per time
- Standard units are kJ m^-2 and y^-1
- Triangular and never inverted as 90% of energy is lost between trophic levels
- PoEs differ between ecosystems due to the effect of climate on primary productivity
- Warmer temperatures speed up enzyme reactions required for photosynthesis
- High precipitation also increases photosynthesis as the photolysis of water is essential for non-cyclic photophosphorylation
- Higher (optimal) rate of photosynthesis = more energy transferred
- Tropical rainforests have a high NPP whereas deserts have a low NPP
- Higher NPP = more energy supplies to consumers hence more trophic levels can exist
- Tropical rainforests PoE has a wider base and more levels than a desert
- Types of species within a particular biome may also affect how efficiently energy is transferred between trophic levels
- Example: Homeotherms will use more energy maintaining a stable body temperature compared to poikilotherms
- Diagram:
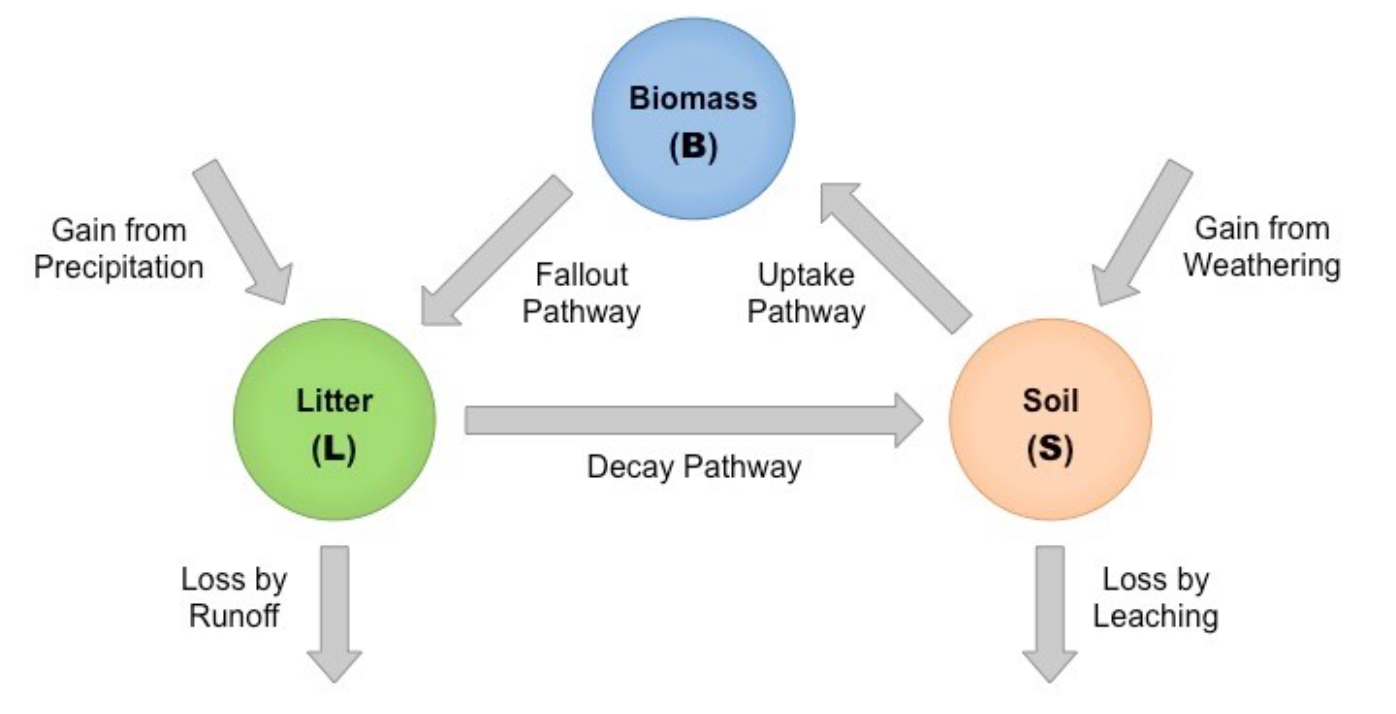
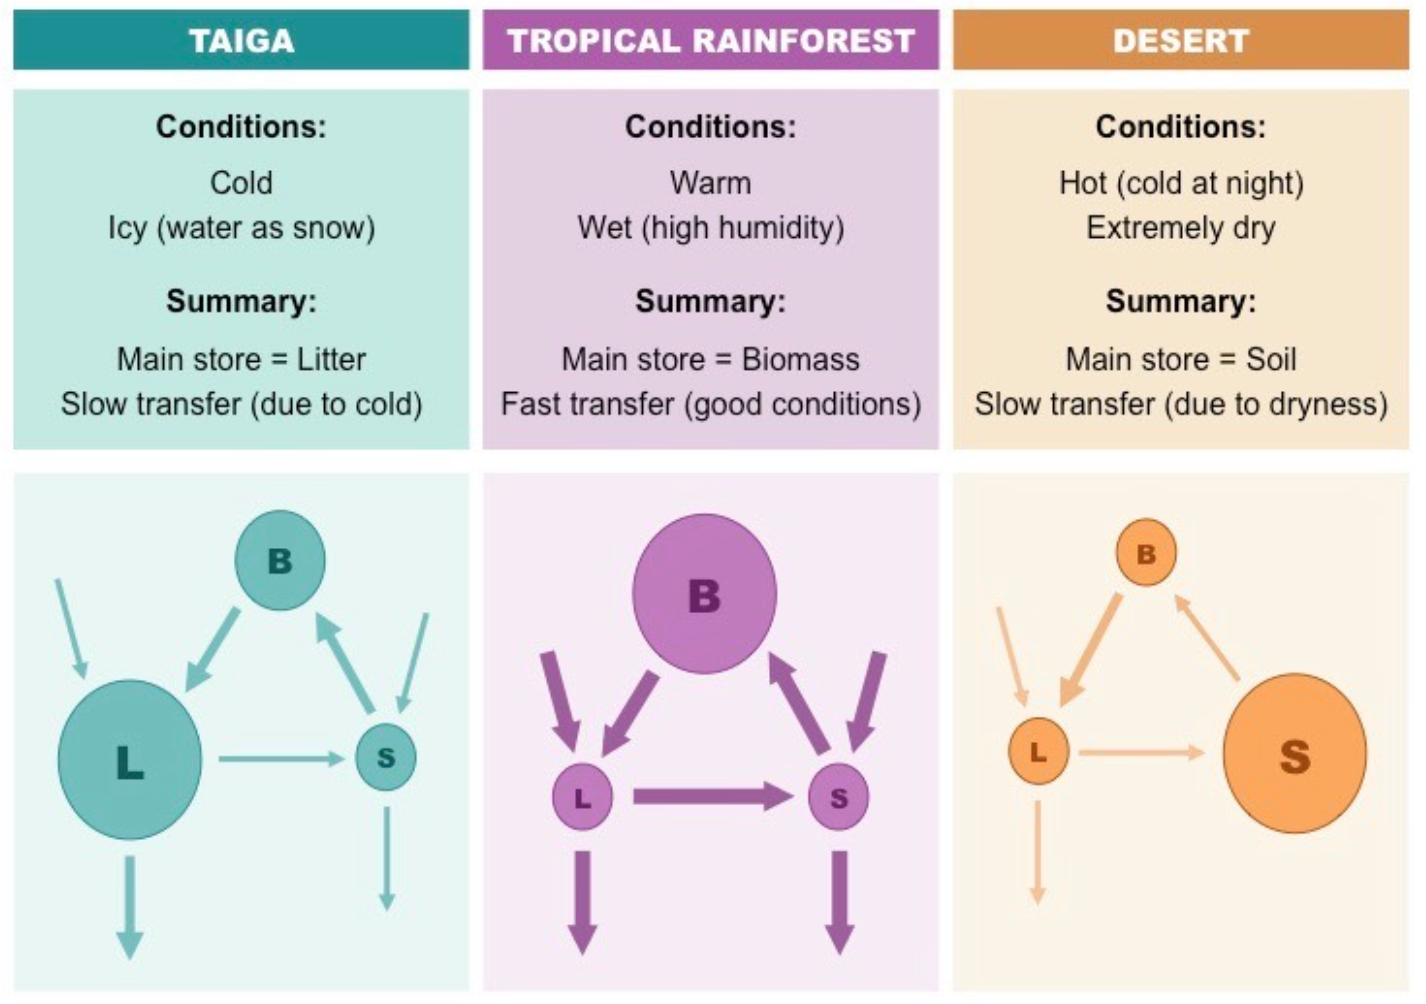
- S: Construction of Gersmehl diagrams to show the interrelationships between nutrient stores and flows between taiga, desert and tropical rainforest
- Gersmehl diagrams show the differences in nutrient flow and storage between different types of ecosystems
- Nutrients are stored in one of three nutrient sinks
- Biomass → the total mass of living organisms in a given area
- Mainly plant tissue
- Litter → any organic matter in and on the soil
- Includes humus and leaf litter (defoliation)
- Soil → the top layer of the earth that is composed of disintegrated rock particles
- Nutrients can be transferred between nutrient sinks and may also be cycled via environmental inputs and outputs
- Transfer from biomass to litter → fallout
- Transfer from litter to soil → decay
- Transfer from soil to biomass → uptake
- Litter can additional gain nutrients via precipitation and lose nutrients in surface runoff
- Soil can gain nutrients from the erosion of rocks via weathering and lose via leaching
- Standard: Gersmehl diagram
- Comparing Gersmehl diagrams
- The inter-relationships between nutrient stores and flows will be affected by climatic factors
- Such as temperature and rainfall
- Therefore Gersmehl diagrams will differ between biomes
- Tropical rainforest
- Most nutrients are stored as biomass
- Litter is rapidly decomposed and vast roots quickly draw nutrients from soil
- There is a fast rate of transfer between stores
- Hot and wet conditions promote precipitation, runoff, weathering and leaching
- Taiga
- Most nutrients are stored as litter
- Low temperatures slow decomposition which delays nutrient transfer to soil and biomass
- There is little nutrient gain from precipitation or weathering due to low levels of precipitation
- Cold temperatures produce snow instead
- There is little nutrient loss via leaching due to low precipitation
- But surface runoffs may be high at certain times if the snow melts
- Desert
- Most nutrients are stored in the soil
- Few plants exist to store nutrients as biomass nor to produce litter
- There is little nutrient gain from precipitation and little nutrient loss via runoff → both due to the dry climate
- The amount of weathering and leaching is insignificant
- Primary Succession
- S: Analysis of data showing primary succession
- Ecological succession = the process by which a sequence of increasingly complex communities develop over time
- Climax community = when succession has ended and the community has all of its characteristics
- Primary succession = when communities develop on entirely new land without any established soil
- May occur at river deltas, glaciers, sand dunes or on exposed rock
- First organisms to colonize the region are called pioneer species
- Typically consist of lichen or moss
- When they die, they decompose which creates the first organic soil capable of sustaining plant growth
- As plant species colonize a new area, the litter produced by their growth and decomposing remains will cause changes
- Soil depth will increase because plants add humus to the soil
- Soil pH will become altered by the additions
- Soil mineral content will increase and rocks will begin to be broken down by the action of roots
- The soil will become aerated and water retention increases
- Drainage is reduced
- These changes will allow for growth of larger plants, which will reduce erosion through the binding action of their roots
- Not all plant species will thrive in unison → larger plants will eventually outcompete smaller shade intolerant plants
- Overview of primary succession:
- Primary succession data
- A primary succession sequence can be identified according to the distribution of plants
- This applies for any location where a new community may emerge from uninhabitable land
- The regions closer to the site of development will be in the earlier chronological stages of succession
- E.g. Glacial retreat exposes bare rock for colonization, so regions further from the glacier have had more time to develop life
- Diagram example:
- Ecological Disturbance
- U: Disturbance influxes the structure and rate of change within ecosystems
- Environmental disturbances may cause fluctuations to the structure and rate of change within ecosystems
- Such disturbances may be natural or artificial (human-induced)
- E.g. bushfire, earthquake
- Natural disturbance
- A natural environmental disturbance may give rise to secondary succession
- Secondary succession = one ecosystem is replaced by another
- Occurs when succession starts on existing soil following the upheaval (change) of a pre-existing ecosystem
- This upheaval results in the removal of existing biota and allows a new ecosystem to develop on the site of the old
- Because the soil is already developed during secondary succession, dominance is usually achieved by the fastest growing plants
- The progression of secondary succession can be summarized as follows:
- An environmental disturbance destroys the pre-existing climax community
- Grasses and herbaceous plants are the first to grow back as the soil is already present
- Soil = no pioneer species required
- Fast growing trees will develop to their fullest while shade tolerant trees will develop in the understory
- Eventually the fast-growing trees may be overtaken by larger, slower-growing trees as the ecosystem reverts to its prior state
- Diagram:
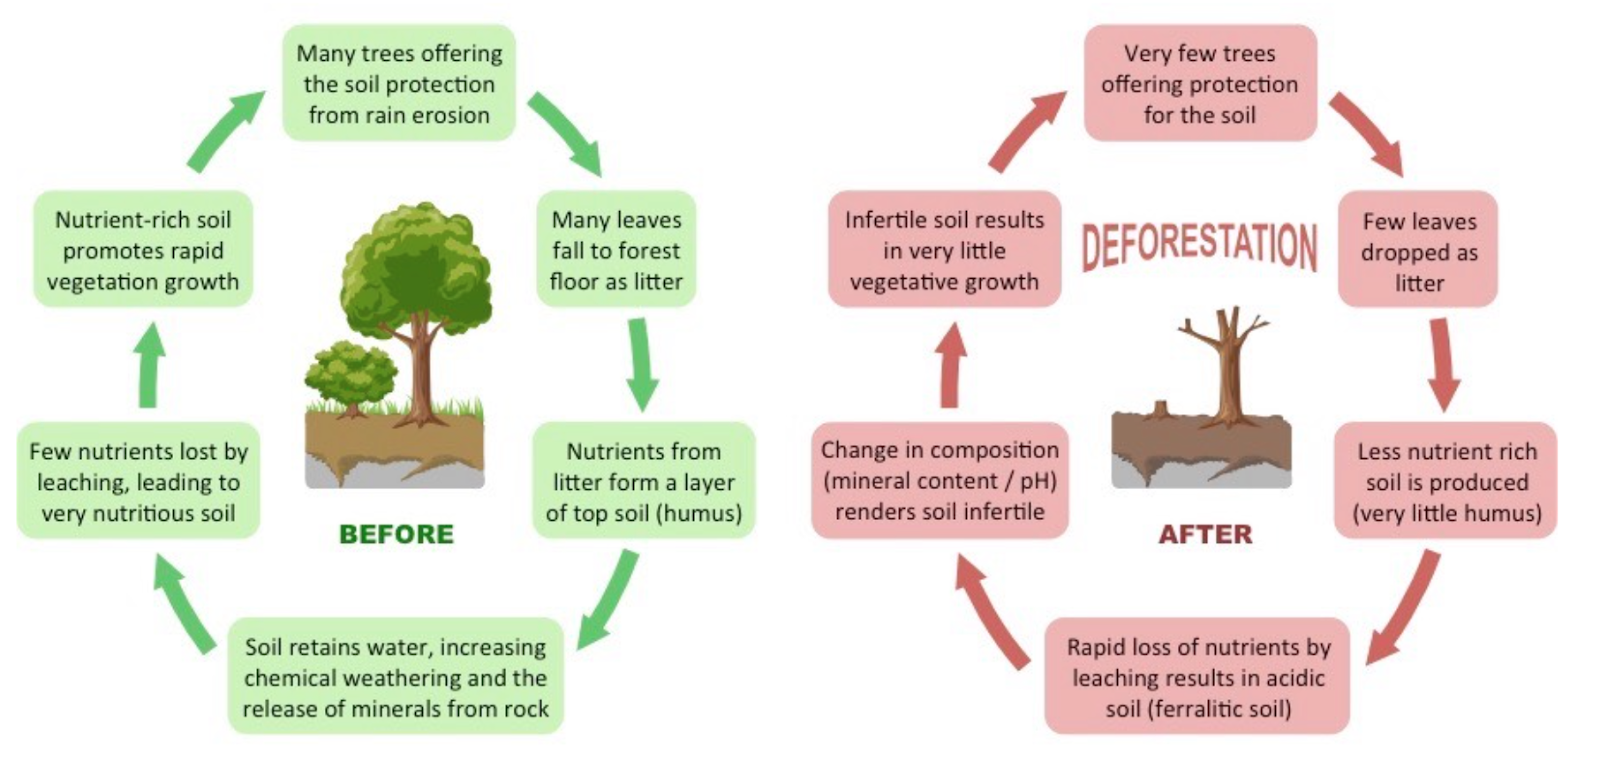
- A: Consideration of one example of how humans interfere in nutrient cycling
- Deforestation is the permanent destruction of a forest via the removal or clearance of trees
- Human-induced degradation of forests
- Driven primarily by a need for timber and cleared land for agricultural purposes
- Deforestation disturbs the normal nutrient cycling within the region in a number of ways
- Less trees means there is less evapotranspiration meaning there is less moisture/precipitation in the air
- Fewer trees means less litter
- Due to less defoliation (leaves falling off a plant)
- This reduces the production of humus, so there will be less nutrients in the soil
- Rapid loss of nutrients from leaching
- Less chemical weathering of rock, due to less water in soil
- The soil will become more acidic and release iron and aluminum to form an infertile ferralitic soil
- Ferralitic soil = nutrient poor
- The soil layer will become increasingly thin and eroded
- The infertile soil will prevent vegetative growth, reducing biodiversity and nutrient cycling
- Logging operations may also alter the distribution of plant species by removing the canopy and increasing light exposure
- Canopy = the upper layer of habitat zone, usually formed by mature tree crowns
- Removal of the canopy also results in an increases loss of nutrients from the soil via runoff
- The effect of deforestation on nutrient cycling:
- S: Investigation into the effect of an environmental disturbance on an ecosystem
- Environmental disturbances are caused by natural or artificial disruptions to a normal ecosystem
- Examples:
- Fire breaks in bush lands or regions damaged by bushfires
- Outer boundaries of population settlements or regions bordering roads
- Dams and artificial rivers and creeks
- E.g. irrigation sites
- The effect of an environmental disturbance on an ecosystem can be measured in a number of ways
- Population density
- Using the Lincoln index via the capture-mark-recapture technique
- Species diversity and richness
- Using the Simpson’s reciprocal index
- The presence and distribution of indicator species
- To measure levels of pollution
- Canopy coverage and relative light intensity
- Could measure with a lux meter
- Biomass
- Via the average width of tree stems at a specified height
- Edaphic factors such as soil erosion (via depth), water retention (via drainage), pH and nutrient content
- Measurements taken from a disturbed area need to be compared against measurements taken from an undisturbed control area
- This enables the investigator to statistically calculate both the effect and magnitude of the environmental disturbance


C3 Impacts of humans on ecosystems
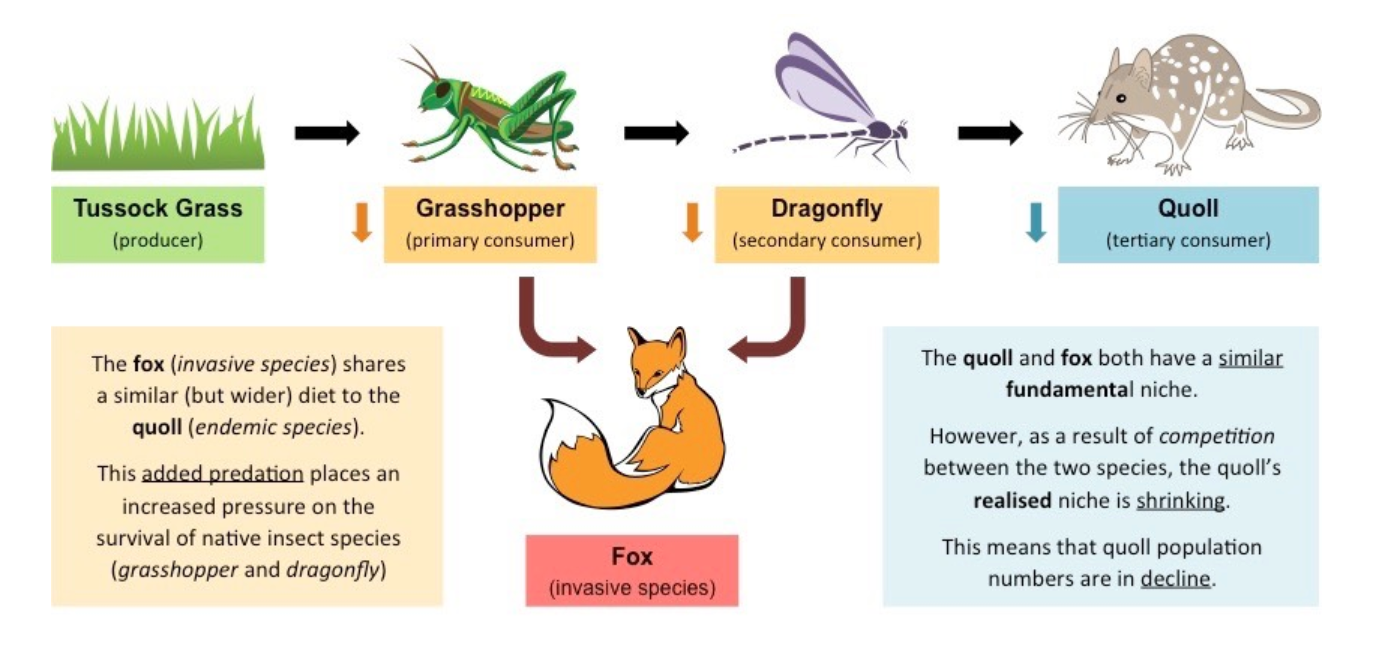
- Invasive species
- U: Introduced alien species can escape into local ecosystems and become invasive.
- The species within any given ecosystem can be broadly described as either endemic or alien
- Endemic = native species to a defined geographic region
- E.g. koalas in Australia
- Alien = species that have been transferred from their natural habitat into a new environment
- If an introduced alien species has detrimental effects on the pre-existing food chains, it is classified as invasive
- Invasive species typically threaten the biodiversity of the ecosystem they are introduced into by displacing native species
- Example: invasive species in Australia → cane toad, European rabbit, red fox, camel, feral cat
- U: Competitive exclusion and the absence of predators can lead to reduction in the number of endemic species when alien species become invasive
- Competitive exclusion principle = two species cannot occupy identical niches within a community
- One species will have a competitive advantage and survive at the expense of the other
- Evolution via natural selection results in adaptations that function to minimize direct competition between species in nature
- Invasive species possess several advantages that allow them to displace endemic species via competitive exclusion:
- Typically possess a large fundamental niche
- = can occupy a wider area than endemic species
- Commonly lack a predator capable of limiting their survival
- As they are introduced into a foreign environment
- May possess certain features that are suited to the new environment
- E.g. more aggression, better foraging, etc.
- Diagram:
- A: Study of the introduction of cane toads in Australia and another local example of an introduced alien species
- Case study one: Cane toads (Bufo marinus)
- Cane toad was introduced in Australia in 1935 by humans to control the spread of the sugar cane beetle that was damaging crops
- Failed to limit the beetle population → beetles live at the tops of sugar canes where the toads could not reach
- The cane toad has reproduced rapidly and is now classified as an invasive species that endangers native wildlife
- It has a wide diet → depleted the prey population for native insectivores
- Secretes a toxic chemical from its skin that has poisoned native predators
- Carries diseases that have been transmitted to native species of frogs and fish
- The cane toad has spread across the northern fringes of Australia
- Now numbers in the millions
- Proven difficult to eradicate as there are no natural predators in Australia to reduce its population size
- Case study 2: Wild rabbits
- European rabbits were introduced in Australia with the arrival of the First Fleet
- Ostensibly for recreational hunting
- Australian conditions promoted a population explosion
- Mild winters allowed rabbits to breed the entire year
- Fastest spread ever recorded for any mammal anywhere in the world
- Rabbits have had a devastating effect on native Australian ecology
- Killed native plant species by ringbarking
- Ringbarking = removing a strip of bark that prevents future growth beyond that point
- Loss of native plants has left the topsoil exposed and vulnerable to extensive erosion from wind and rain
- Various strategies have been employed to control rabbit populations with varying effect
- ‘Rabbit-proof’ fences were built to try and contain rabbit populations
- Methods of hunting and poisoning have been utilized
- Also efforts to destroy rabbit warrens (burrows)
- Rabbit-borne diseases have been released with moderate success
- E.g. myxomatosis virus
- Biological control
- S: Evaluation of eradication programmes and biological control as measures to reduce impact of alien species.
- Controlling the population of invasive species once they have become established is difficult and typically very expensive
- Three main methods: physical, chemical, biological
- Physical control
- Involves removal or restriction by manual or mechanical measures
- May include:
- Installation of barriers and fences
- Removal of habitat by excavation or trimming
- Population numbers may be reduced by hunting, trapping and culling
- Although this is labor intensive
- Physical methods to contain invasive species are not usually species specific and can also impede endemic wildlife
- Chemical control
- Involves the use of chemical agents to limit population numbers and spread
- Chemical agents = poisons and toxins
- Chemical agents may include:
- Herbicides for plants
- Pesticides for insects
- Other compounds such as rat poison
- Chemical agents may have moderate specificity, but can also detrimentally affect local wildlife + are costly
- The effect may become more pronounced in high trophic levels due to biomagnification
- Biological control
- Involves using living organisms or viruses to control an invasive species
- Biological control may eat the invasive species or cause it to become diseased
- Biological agents mut be carefully assessed before release to ensure they do not become invasive themselves
- Examples:
- The Vedalia beetle feeds on citrus plant invertebrates
- The Myxoma virus that affects rabbits
- Biological control agents must be monitored for unintended side effects
- E.g. development of immunity in invasive species
- Biocontrol case study: The Vedalia Beetle (ladybug)
- The cottony cushion scale is an invertebrate pest from Australia that was accidentally released in California
- Spread and fed on citrus plants such as orange trees
- Devastated the Californian citrus industry
- The Vedalia beetle is a predatory insect from Australia that was introduced into California as a means of biological control
- It worked to limit the numbers of the cottony cushion scale
- Minimized the economic impact on the citrus industry
- Diagram:
- Biomagnification
- U: Pollutants become concentrated in the tissues of organisms at higher trophic levels by biomagnification
- Biomagnification = the process in which chemical substances become more concentrated at each trophic level
- Bioaccumulation = the build up of a chemical substance in the tissues of a single organism
- Biomagnification occurs because organisms at higher trophic levels must consume more biomasse to meet feeding requirements
- Energy transformations are only ca. 10% efficient, so higher order consumers must eat more to meet energy demands
- This means higher order consumers will experience increased contamination from a chemical substance
- Diagram of effect:
- S: Analysis of data illustrating the causes and consequences of biomagnification
- Dichloro Diphenyl Trichloroethane (DDT) is an example of a chemical substance which is biomagnified
- DDT = a chemical pesticide that is sprayed on crops to eliminate mosquito larvae and washed into waterways at low concentrations
- Taken up by algae and passed on to primary consumers
- DDT is fat soluble and selectively retained within the tissues of an organism instead of being excreted
- At each subsequent trophic level DDT is passed on through the algae, the concentration of DDT stored in the body increases
- Increased trophic level = increased food uptake = increased DDT
- Very high levels of DDT were discovered in birds that preyed on fish
- Birds exposed to high levels of DDT through feeding on fish that fed on algae were found to produced thinner shells as a consequence
- This decreased survival rates of fledglings
- Diagrams we may encounter for such data analysis
- A: Discussion of the trade-off between control of the malarial parasite and DDT pollution
- DDT was widely employed as a chemical pesticide in the 1940s and 1950s to control insect-borne diseases like malaria
- Agricultural insecticide
- Led to complete eradication of malaria in many high socioeconomic world regions
- Less effective in low socioeconomic tropical regions where eradication programs could not be sustained
- Eradication programs were curtailed by the World Health Organization (WHO) in 1969
- For safety and environmental concerns
- DDT can bioaccumulate to toxic levels and poses a significant threat to high trophic levels due to biomagnification
- Current interventions for malaria now focus on non-spraying strategies
- E.g. the use of bednets soaked in insecticides
- Malaria vs. DDT
- Arguments for DDT spraying:
- DDT spraying is an affordable and effective means of killing mosquitos that carry disease
- E.g. malaria, dengue fever, etc.
- Where the use of DDT has been discontinued, the incidence of malaria and associated deaths have increased
- Health costs associated with the treatment of malaria are reduced when DDT spraying is implemented
- Alternative strategies are not as cost-effective or successful
- Arguments against DDT spraying
- It is associated with adverse health effects in humans
- E.g. cancer, birth defects, reduced fertility, etc.
- Persists in the environment for long periods of time
- More than 15 years
- DDT is biomagnified in higher order consumers which has adverse consequences on ecosystems
- Plastic pollution
- U: Macroplastic and microplastic debris has accumulated in marine environments
- Plastic = a type of synthetic polymer
- Found in certain types of clothes, bottles, bags, food wrappings, containers, etc.
- Most plastics are not biodegradable → persist in the environment for many centuries
- Macroplastic = large visible plastic debris
- > 1 mm
- Macroplastic debris can be degraded and broken down into microplastic debris by UV radiation and the action of waves
- Microplastic = smaller plastic debris
- < 1 mm
- Ocean currents will concentrate plastic debris in large oceanic convergence zones called gyres
- Plastic debris in the ocean will leach chemical into the water + absorb toxic contaminants called persistent organic pollutants
- Microplastics will absorb more persistent organic pollutants (POPs) due to their smaller size
- More surface area available
- Both macro- and microplastic debris is ingested by marine animals, which mistake the debris for food
- This leads to the bioaccumulation and biomagnification of POPs within marine animals
- It may also damage the stomach of animals or cause them to stop feeding
- By taking up space in the digestive tract
- Diagram:
- A: Case study of the impact of plastic debris on Laysan albatrosses and one other named example
- Case Study 1: Laysan Albatross
- Nests on islands found in the North Pacific gyre where large amounts of plastic debris is found
- Feeds by skimming the ocean surface with their beak → this causes them to ingest large quantities of plastic too
- Adults can regurgitate (throw up) the plastic they have swallowed, but chicks are unable to
- Instead, it fills up their stomachs
- The mortality rate in albatross chicks is very high
- Estimated 40% die before fledgling
- Case Study 2: Sea turtles
- Will commonly mistake plastic bags for jellyfish
- Jellyfish = one of their primary food sources
- Ingestion of the plastic can be fatal
- It can become lodged in the esophagus and cause future feeding problems
- Plastic debris can also become wrapped around the turtle → restricting movement and developmental growth
- It is estimated plastic pollution harms ca. 100 000 sea turtles and other marine animals each year
- EC: Cholorfluorocarbons
- Chlorofluorocarbons (CFCs) = chemicals widely used as refrigerants, propellants and solvents in the past
- Contribute to ozone depletion in the upper atmosphere
- Therefore their manufacture and use is being phased out
- Ozone layer = stratospheric region composed of ozone (triatomic oxygen)
- CFCs are broken down by UV radiation to release chloride ions that react with ozone
- The ions breaks the ozone down into oxygen
- One chloride ions can destroy 100 000 ozone molecules
- Diagram of the process:
- Ozone in the stratosphere absorbs UV radiation, however there is a limit to how much radiation ozone can absorb
- Regions where the ozone layer is thinner will experience higher terrestrial UV levels
- Thinning caused by for example CFCs
- UV light penetrates tissues and damages DNA → this causes gene mutations and cancer
- Can also damage the ability of plants to carry out photosynthesis + kill phytoplankton → this reduces productivity
- EC: Earth spheres
- The Earth is made up of four distinct and connected spheres
- Lithosphere, hydrosphere, atmosphere, biosphere
- Lithosphere = all the rocks, minerals and molten magma found on or in the Earth
- Also called geosphere
- Hydrosphere = all the water on Earth
- Liquid water such as oceans and rivers
- Precipitation and vapor
- Atmosphere = the layer of gasses surrounding the Earth
- Divided into further sections
- E.g. stratosphere
- Biosphere = all the living organisms on the planet
- Including plants, animals, bacteria, etc.
- As the four spheres are interconnected, human impact on one sphere will potentially affect other spheres
- Examples:
- The release of plastic pollution into the hydrosphere (oceans) will impact the biosphere (marine life)
- The production and release of CFCs into the atmosphere will impact how much UV radiation the biosphere is subjected to


C4 Conservation of biodiversity
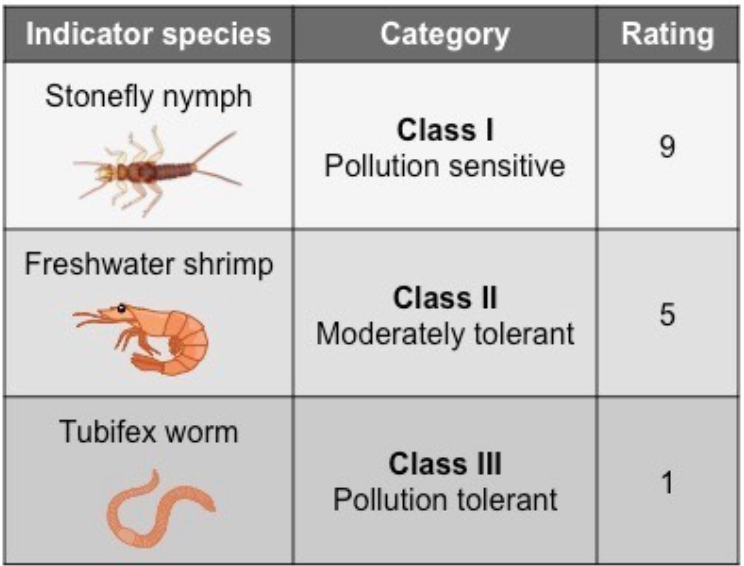
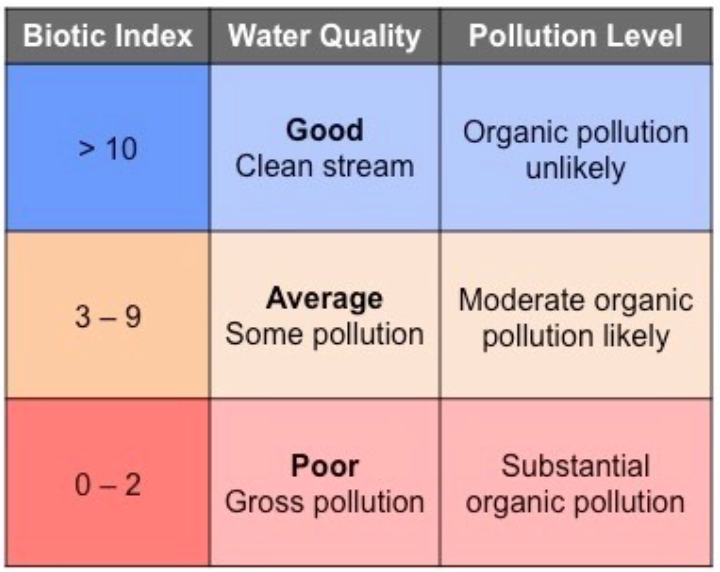
- Indicator species
- U: An indicator species is an organism used to assess a specific environmental condition
- Indicator species are sensitive to specific environmental conditions → limited range of tolerance
- Reduction or growth of their population therefore indicates changes in the environment
- Useful means of monitoring change
- Examples of indicator species and their environmental conditions
- Lichen and mosses are susceptible to air-borne pollutants dissolved in water
- E.g. sulfur dioxide
- Tubifex worms are sensitive to concentrations of heavy metals
- Mayfly larva and certain aquatic invertebrates are sensitive to dissolved oxygen levels in water
- Diagram:
- U: Relative numbers of an indicator species can be used to calculate the value of a biotic index
- Biotic indices compare the relative frequency of indicator species
- + Provide an overall assessment of environmental health
- Calculating a biotic index involves multiplying the population size of each indicator species by its pollution tolerance rating
- The following conclusions can be drawn from a biotic index:
- A high biotic index = the presence of many pollution-sensitive organisms
- Denotes an unpolluted environment
- A low biotic index = the absence of pollution-sensitive organisms + abundance of pollution-tolerant organisms
- Indicates a polluted environment
- A change in the biotic index over time marks a change in the environmental conditions within a given ecosystem
- Pollution tolerance rating
- Environmental pollution levels
- Biodiversity
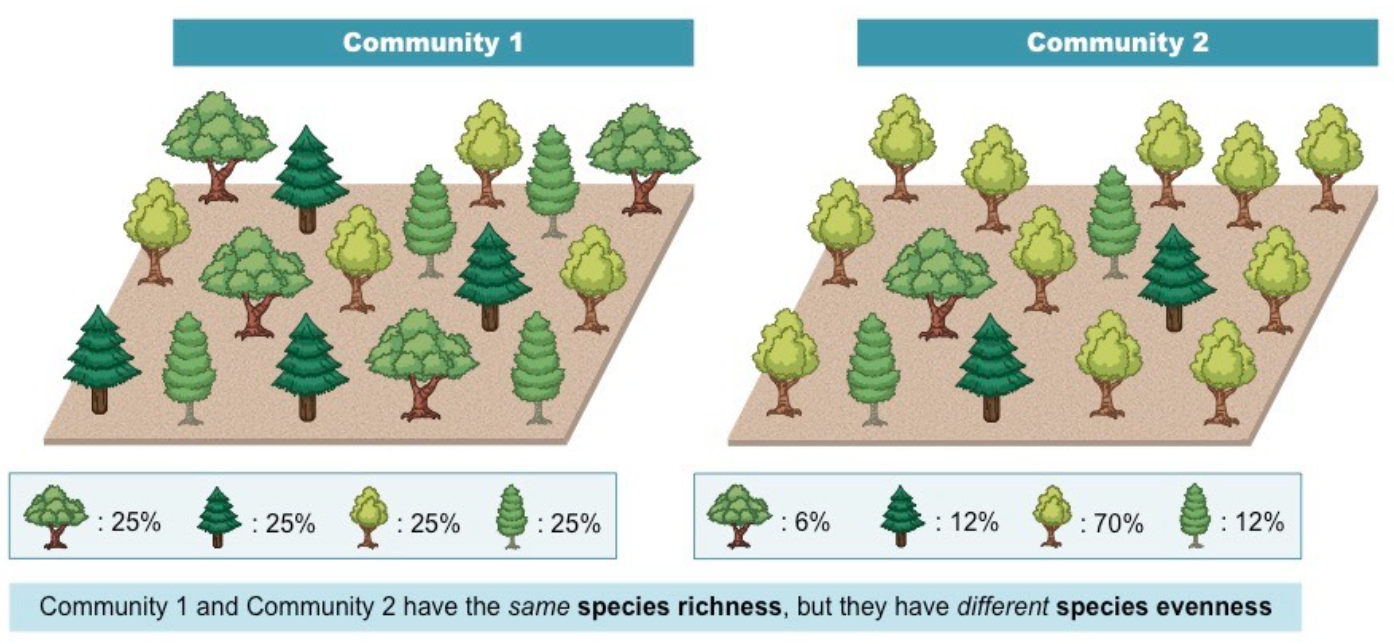
- U: Richness and evenness are components of biodiversity
- Biodiversity = the variety and variability of all living organisms within a given ecological area
- Can be used to refer to the number of species, their genetic diversity or habitat variety
- Habitat variety = ecological variations
- 2 main components contribute to biodiversity
- Species richness → the number of different species present in an area
- More species = greater richness
- Species evenness → the relative abundance of the different species in an area
- Similar abundance = more evenness
- Richness vs. evenness
- S: Analysis of the biodiversity of two local communities using Simpson’s reciprocal index of diversity
- Simpson’s reciprocal index can be used to measure the relative biodiversity of a given community
- It takes into account both the number of species present (richness) and the number of individuals per species (evenness)
- A higher index value is indicative of a greater degree of biodiversity within the community
- Simpson’s reciprocal index can be used to compare communities to identify intrinsic values
- Intrinsic value = something we value for itself, not its consequences
- A high index value = a stable site with many different niches and low competition
- High richness and evenness
- A low index value = a site with few potential niches where only a few species dominate
- Low richness and evenness
- The index value may change in response to ecological disturbance
- E.g. human intervention, natural disasters, etc.
- Biogeographic factors
- U: Biogeographic factors affect species diversity
- Biodiversity within a given ecosystem will be affected by a number of biogeographic factors
- Larger habitats tend to promote biodiversity better than smaller ones
- More available niches = less competition
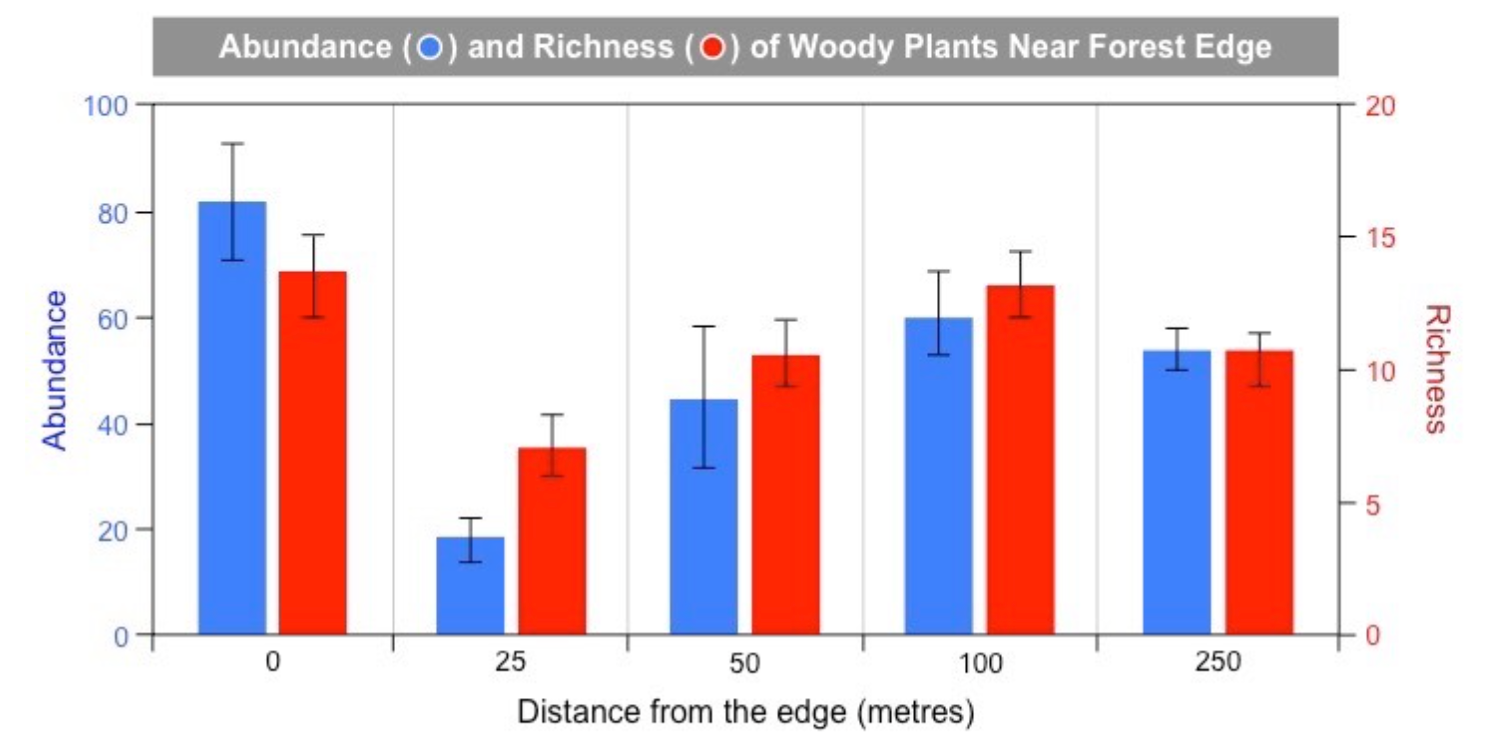
- Ecology at the edges of ecosystem is different from central areas
- E.g. more sunlight, more wind, etc.
- This is known as the edge effect, whereby species distribution is influenced by divergent environmental conditions
- Edges tend to have greater biodiversity as different habitats with different abiotic factors exist in close physical proximity
- However, edges tend to have more competition than central regions → may restrict survival prospects of certain species
- Habitat corridors between parts of a fragmented habitat can connect disparate regions to improve genetic diversity
- These principles of biogeographic factors are routinely applied when setting aside land as a nature reserve to improve the conservation of biodiversity
- A: Analysis of the impact of biogeographic factors on diversity limited to island size and edge effect
- Island size
- The biodiversity of an island is typically proportionate to island size
- Larger island = greater biodiversity
- Larger islands support a greater range of habitats
- Hence more available niches for species to occupy → more survival + diversity
- Larger islands can sustain higher population numbers for each species
- Increases species evenness
- Larger islands have greater productivity at each trophic level
- Leads to longer + more stable food chains
- Smaller island = less biodiversity
- Diagram depicting the relationship between island size and biodiversity
- Edge effect
- The diversity of species within a given environment changes with proximity to the ecosystem’s boundaries
- Biodiversity may be greater at the border between two ecosystems as different abiotic factors favor certain species
- However, certain species may not be able thrive under these conditions
- Instead must occupy more central regions
- The effect of edges on biodiversity will be greatly influenced by the particular conditions caused by the ecological disturbance
- Diagram:
- Conservation
- U: In situ conservation may require active management of nature reserves or national parks
- Conservation = the careful preservation, protection and maintenance of natural resources
- Such as trees, water, wildlife, etc.
- Can be either in situ or ex situ
- On site or off site
- In situ conservation is the preservation of plant and animal species within their natural habitat
- Typically involves the designation of protected areas of land as either nature reserves or national parks
- These areas may require active management to ensure that an appropriate and sustainable ecological balance is maintained
- Ecological monitoring of a species may be required to ensure viable population levels are maintained
- Interventions may be required to prevent habitat degradation or competition from invasive species
- Legislation may be necessary to ensure adequate funding for policing and education
- In situ conservation offers several advantages when protecting endangered species from extinction
- It allows species to live in the environment to which they are adapted
- + to occupy their natural position in the food chain
- It maintains the animal’s normal behavior
- Offspring usually acquire skills from parents and peers around them
- Retaining the natural habitat prevents its eventual loss + ensures it remains available for other endangered species
- Such areas provide a place to return animals from breeding programs as they provide realistic conditions for reintegration
- Reserves in different areas can share information and provide a place for scientific study and developing public awareness
- U: Ex situ conservation is the preservation of species outside their natural habitats
- Ex situ conservation involves the preservation of plant and animal species outside their natural habitats
- May typically be required for critically endangered species when urgent intervention is necessary
- There are several advantages associated with ex situ conservation
- It allows for greater control of essential conditions
- E.g. climate control, dietary intake, veterinary care, etc.
- It can improve the chances of successful breeding by utilizing artificial methods
- E.g. embryo transfer, IVF, etc.
- Ex situ conservation is also associated with several disadvantages
- They do not prevent the potential destruction of their natural habitats
- Species raised in captivity are less likely to be successfully reintroduced into the wild
- Loss of autonomous survival
- Increases inbreeding by restricting the gene pool → restricts the evolution of the species
- Some examples of ex situ conservation measures employed around the world:
- Captive breeding → animals are raised and bred in containment to ensure survival prospects
- E.g. zoos
- Botanical gardens → areas devoted to the collection, cultivation and display of a wide variety of plant species
- Seed banks → secure sites that store and catalog seeds in order to preserve plant genetic diversity
- A: Case study of the captive breeding and reintroduction of an endangered animal species
- Case Study 1: Indian rhinoceros
- An endangered species with only ca. 3500 rhinoceros living in the wild
- This number was as low as 2000 in the early 1990s → increased due to successful captive breeding programs
- In addition to habitat loss, the Indian rhinoceros is threatened by poachers
- Their horn is considered potent in some cultures
- It is listed as vulnerable on the IUCN red list + the majority of the species is situated in Indian protected areas (reserves)
- Case Study 2: Mountain Chicken Frog
- A species of frog native to the Carribean islands of Dominica and Montserrat
- The population of this frog has declined i81% in the last 10 years
- Due to the fungal disease chytridiomycosis
- Also threatened by human consumption → local delicacy said to taste like chicken
- Considered critically endangered with fewer than 8000 individuals existing in the wild
- The frog has been artificially bred in laboratories in England prior to being reintroduced into the wild
- EC: Endangered species
- Endangered species = categorized by the International Union for Conservation of Nature (IUCN) as likely to become extinct
- Conservation status = likelihood of becoming extinct
- Currently 3000 endangered species according to IUCN
- Factors for determining a species’ conservation status
- Rate of decline
- Population size
- Area of geographic distribution
- Degree of population fragmentation
- IUCN has a red list which classifies species into nine groups
- Extinct (EX)
- No surviving individuals
- E.g. tasmanian tiger
- Extinct in Wild (EW)
- Captive individuals survive, but there is no wild population
- E.g. barbary lion
- Critically endangered (CR)
- Faces an extremely high risk of extinction in the near future
- E.g. red wolf
- Endangered (EN)
- Faces a high risk of extinction in the near future
- E.g. snow leopard
- Vulnerable (VU)
- Faces a high risk of endangerment in the medium term
- E.g. Indian rhinoceros
- Near Threatened (NT)
- May be considered threatened in the near future
- E.g. tiger shark
- Least Concern (LC)
- No immediate threat to species survival
- E.g. giraffe
- All other organisms may be listed as Data Deficient (DD) or Not Evaluated (NE)
- EC: Extinction
- Extinction = the complete cessation of a species or higher taxon level, reducing biodiversity
- Can occur gradually as one population of organisms evolves into something else
- Phyletic extinction
- Can be sudden without any identifiable descendents → cease to exits
- Abrupt extinction
- Can be very difficult to determine the moment of extinction → most categorizations are usually done retrospectively
- Occasionally species thought to be extinct can be rediscovered after a period of time
- E.g. lazarus taxa
- 99% of all species that ever lived on Earth are considered to be extinct
- Estimated to amount over 5 billion species
- Natural catastrophes may cause mass extinction events
- Large scale loss of species in relatively short period
- Case Study: Tasmanian Tiger
- Thylacinus cynocephalus
- Became extinct after the arrival of European settlers to Australia
- Tasmanian tigers would feed on introduced sheep → therefore hunted and poached
- The loss of habitat due to human development + lack of successful breeding programs = population numbers dwindling
- Aboriginal rock paintings suggest the Tasmanian tiger once lived on the mainland, but died out from predation and/or competition
- Last Tasmanian tiger died in captivity in 1936
- Declared extinct by international standards in 1986