Lecture 9: Introduction to 3D Spatial Visualization
Motivation: Industrial Revolution
1765 (1st revolution)
Mechanization - led by the steam engine
1870 (2nd revolution)
Mass Production - driven by electricity and oil-based power
1969 (3rd revolution)
Automated Production - supported by electronics and information technologies
Today (4th revolution)
New technologies - Internet of Things (IoT), Artificial Intelligence (AI); Big Data, Cloud, Cyber-Physical Systems…
Smart Cities and the 4th Industrial Revolution
Smart City, one of the core technologies of the 4th Industrial Revolution, is a technology to respond to unpredictable changes in the future society
Digital twin technology, is a key technology for implementing smart city platforms
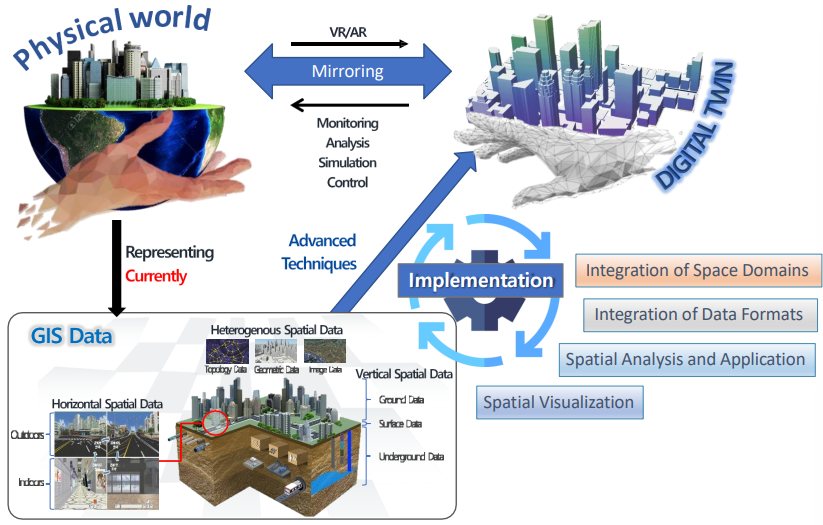
Digital Twin Cities
Digital twins aim to represent the physical world to aid in data-driven decision making by mirroring real-world processes
The digital twin must be composed by an integrated spatial system in order to perform these roles. and hence rely on geographic data for its implementation
Geographic Information System (GIS)
A computer-based information system that enables capture, modeling, manipulation, retrieval, analysis, and presentation of geographically referenced data
In simpler terms, GIS is a set of computer-based systems for managing geographic data and using these data to solve real-world spatial problems
GIS Layers to model the real world
Visualization
Central to the communication of spatial data
A representation of our environment
GIS-based Visualization
Advances in computer graphics allowed for these visualizations to become real-time, interactive and very complex
Visualization techniques are essential to extract useful information from the large mass of data
“In GIS, visualization is used to organize spatial data and related information into layers that can be analyzed or displayed as maps, three-dimensional scenes, summary chart, tables, time-based views, and schematics.” - ESRI
3D Visualization
Traditional GIS systems are plotted along two dimensions: horizontal (x) and vertical (y) axes
3D GIS goes beyond providing coordinates and makes it possible to depict objects in greater detail by adding another dimension (z)
3D geographical information is the addition of height, image, attribute information on the geographic information 2D
3D GIS Data = 2D GIS Data + height
Representation of geographic information is similar to the real world
3D Visualization Approaches
Image Draping
the process of projecting a 2D image onto a 3D surface to create a more realistic and detailed visualization of the terrain
Geometric Modelling
Builds a scene of realistic features
Features are modelled more realistically and may closely resemble the appearance of these features as seen in the ground
3D Analysis in GIS
Line of Sight (LOS)
Predicting whether one point is visible from another (intervisibility analysis)
Determining line of sight
Types of 3D Data
3D-surface terrain data
Raster: image and grid
TIN
Represents height values over an area, and the 3D information for each location within that area can be either stored as cell values or deduced from a triangulated network of 3D faces
3D-feature data
Shapefile
Geodatabase feature class
Layer property:
base heights - the elevation values that are used to display a layer in 3D
extrusion - 3D extension for features
Represents discrete objects, and the 3D information for each object is stored in the feature’s geometry
Types of 3D Models
Small Scale Models (Multi-level)
Medium Scale Models
Large Scale Models - more detailed
3D Models: Level of Detail (LoD)
LoD 0 - It can be argued that the LoD0 cannot be considered as a 3D city model since it is a boundary representation in 2D with a height as an attribute
LoD 1 - with height
LoD 2 - with roofings
LoD 3 - with detailed architectural features and possibly interior elements
LoD 4 - includes detailed information about building materials and furniture layouts
Examples and Applications
3D Analysis in GIS
Line of Sight (LOS)
Visibility Analysis - Viewshed and Observer Points
Viewshed Analysis: Determines the visible areas from one or multiple observer points, used for planning and site analysis.
Observer Points: Specific locations where visibility calculations are based, crucial for urban planning and landscape assessments.
Shadows
Watersheds
Volume computations
Solar Exposure
3D Path Routing
4D (temporal change)
Feature Interference
Skyline
Urban visualization
Describes 3D rendering of urban landscapes
Corresponds to the use of behavioral or process modeling of the dynamic changes in urban activities and landscapes
Constructing 3D Data for City Models
Using LiDAR for 3D City Modeling
To extract 3D building shapes from lidar data, you’ll first classify the point cloud, identifying the cloud points representing the ground and the buildings of the area of interest
UAV data and 3D modelling
Indoor GIS
Includes any or all of the following:
Indoor Mapping
Building Information Modelling (BIM)
“A model-based technology linked with a database of project information”— American Institute of Architects;
3D, virtual representation of a design project
Includes:
Geometry
Spatial Relationships
Geographic Information
Quantities
Properties of Building Components
Indoor Location-based Services (e.g. Indoor Routing and Navigation)