🌱 AP Environmental Science Unit 3 Notes
10-15% of The AP Test
Topics
3.1 Generalist and Specialist Species
3.2 K-Selected r-Selected Species
3.3 Survivorship Curves
3.4 Carrying Capacity
3.5 Population Growth and Resource Availability
3.6 Age Structure Diagrams 5 EIN 3.7 Total Fertility Rate
3.8 Human Population Dynamics
3.9 Demographic
These notes are based on Mr Jordan Dischinger-Smedes’s YouTube videos and the fill in template notes for these videos created by Carolyn Kelleher Mendonca. Some changes were made. Videos available here.
Good luck on the AP Test! 🩷
3.1 - Specialist vs Generalist species
Specialists: Smaller range of tolerance, or narrower ecological niche makes them more prone to extinction
Specific food requirements (bamboo)
Less ability to adapt to new conditions
Generalists: Larger range of tolerance, broader niche makes them less prone to extinction & more likely to be invasive
broad food requirements
High adaptability
a
3.2 - K-selected & r-selected
K-selected- “quality”
few offspring, heavy parental care to protect them
Usually reproduce many times over lifespan
Ex: most mammals, birds
Long lifespan, long time until to sexual maturity = low biotic potential = slow pop. growth rate
More likely to be disrupted by env. change or invasives
r-selected - “quantity”
Many offspring, little-to-no care
May reproduce only once
Ex: insects, fish, plants
Shorter lifespan, quick to sexual maturity = high biotic potential = high pop. growth rate
More likely to be invasive
Better suited for rapidly changing env. conditions
Trait | K-selected | R-Selected |
|---|---|---|
Life Span | long | short |
Parental Care | yes | no |
Size of offspring | large | small |
K-selected
low biotic potential (rep. rate) = hard for pop. to recover after a disturbance (env. change)
High parental care means death of parent = death of offspring
Invasives (usually r) outcompete for resources with high biotic potential & rapid pop. growth
less likely to adapt & more likely to go extinct
r-selected
High biotic potential (rep. rate) = more rapid pop. recovery after disturbance
low parental care means death of parent doesn’t mean death offspring
Not as impacted by invasive species since their pop. grow quickly
More likely to be the invasive
Larger pop. & faster generation time = higher chance of adaptation & lower chance of extinction
3.3 - Survivorship Curve
Survivorship Curves: line that shows survival rate of a cohort (group of same-aged individuals) in a pop. from birth to death
Faster drop in line = quicker death/life span of individuals
Slower drop in line = longer life span
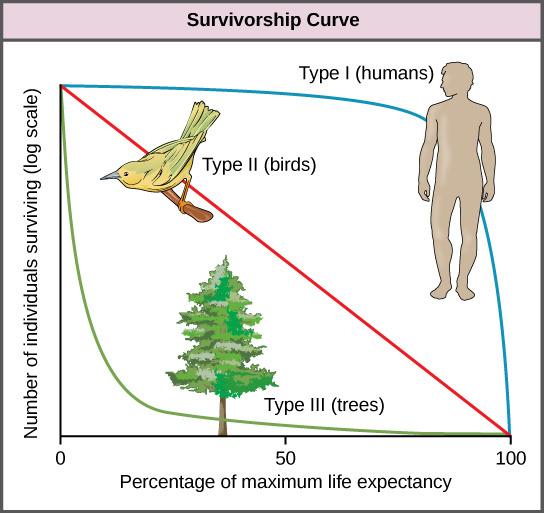
Type I (mostly K-selected)
High survivorship early in life due to high parental care
High survivorship in mid life due to large size and learned defensive behavior
Rapid decrease in survivorship in late life as old age sets in
Ex: most mammals
Type II (mostly r-selected)
Steadily decreasing survivorship throughout life
Type III (mostly r-selected)
High morality (low survivorship) early in life due to little to no parental care
Few make it to midlife; slow, steady decline in survivorship in midlife
Even fewer make it to adulthood; slow decline in survivorship in old age
Ex: insects, fish, plants
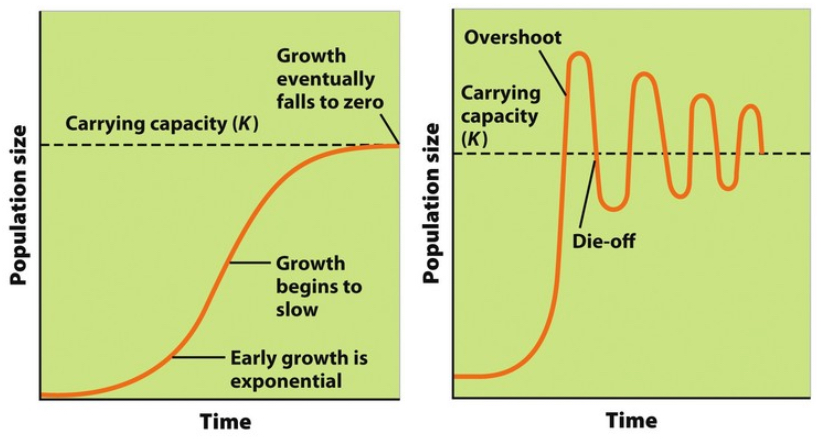
3.4 - Population and Carrying Capacity
Carrying Capacity (k): the max. Number of individuals in a pop. that an ecosystem can support(based on limiting resources)
Fig. 1 is theoretical
Fig. 2 is more realistic
Pop. briefly “overshoots” (k) and then die-off happens
Highest Population an ecosystem can support based on limiting resources:
Food
Water
Habitat (nesting sites, space)
Overshoot: when a population briefly exceeds carrying capacity
Ex: deer breed in fall, give birth all at once in spring; sudden spike in pop. = overshoot
Consequence of overshoot: Resource depletion ex: overgrazing in deer
Die-off: when resource depletion (overshoot) leads to many individuals dying
Ex: many deer starve with too many new fawns feeding in spring
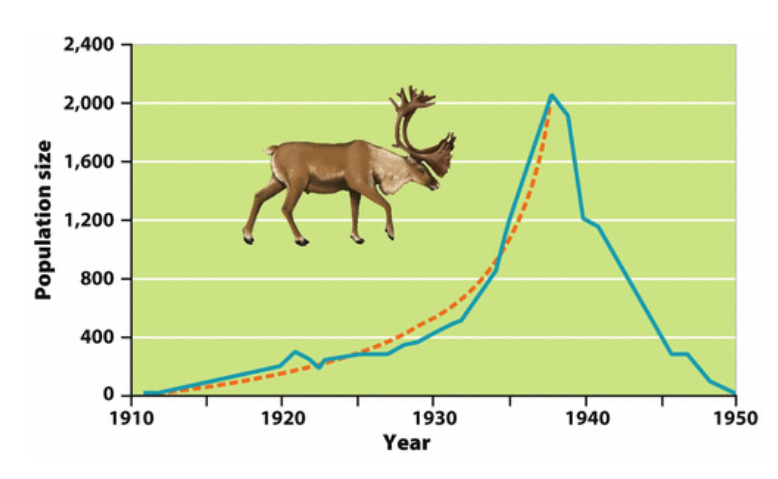
Example of die-off:
Reindeer of St. Paul Island
25 introduced in 1910
Growth was gradual (10’-30’), then exponential (30’-37’)
Carrying Capacity was overshot
Die-off lead to pop. crash as food resource (lichen) were severely depleted
Real pops. don’t always fluctuate around carrying capacity. If resource depletion is severe enough, total population crashes can occur
Hare pop. Increase due to low predator pop. (lynx)
Lynx pop. Increase due to increase in food/prey (hare)
Increasing lynx pop. Decreases hare pop; leads to die-off
Hare die-off decrease lynx food source, leading to die-off
Hare pop. Increase due to low predator pop. (lynx)
3.5 - Population Change Factors
Size: total number of individuals in a given area at a given time
Larger = safer from population decline
Density: individuals/area
Ex: (12 panthers/km2)
High density = higher competition, possibility for disease outbreak, possibility of depleting food source
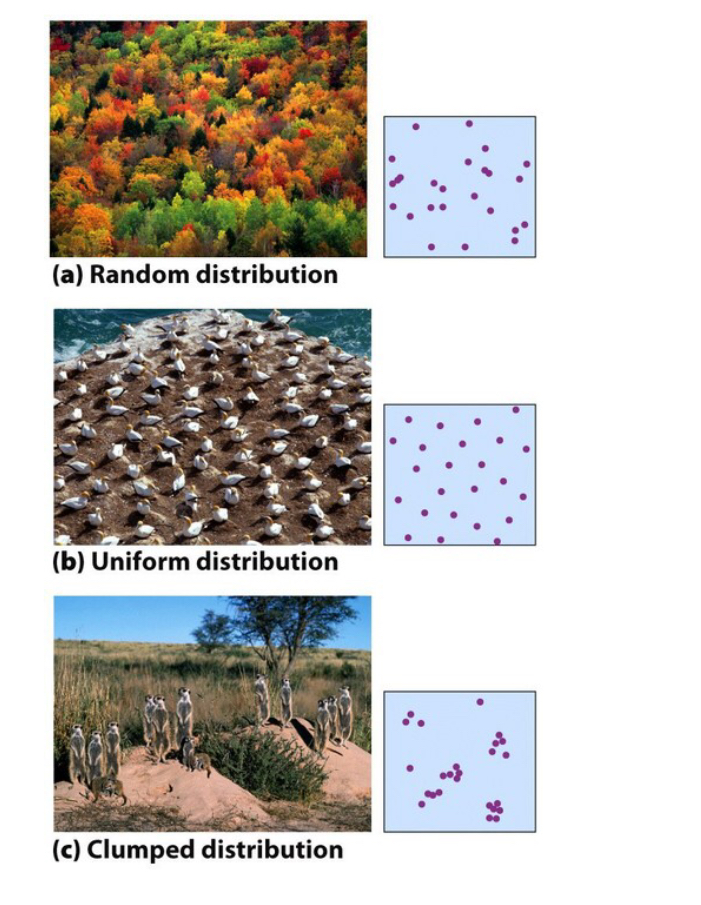
Distribution: how individuals in pop. are spaced out compared to each other
Random (trees)
Uniform (territorial animals)
Clumped (herd/group animals)
Growth factors
Sex ratio: ratio of males to females. Closer to 50:50, the more ideal for breeding (usually)
Die-off or bottleneck effect can lead to skewed sex ratio (not enough females) limiting population growth
Density-Dependent Factors: factors that influence pop. growth based on size:
Ex: food, competition for habitat, water, light, growth based on size
All of these things limit pop. growth based on their size; aka - small pop. don’t experience these, large do
Density-independent: factors that influence pop. growth independent of their size
Ex: natural disasters
(flood, fire, tornado, hurricane)It doesn’t matter how big or small a pop. is, natural disasters limit them both
Food is a density dependent factor. (also a limiting resource)
When twice as much food was added to the dish, both species increased carrying capacity by about 2x
Biotic Potential = max. potential growth rate, with no limiting resources
May occur initially, but limiting factors (competition, food, disease, predators) slow growth, & eventually limit pop. to carrying capacity (k)
Biotic potential = exponential growth
Logistical growth = initial rapid growth, then limiting factors to limit population to carrying capacity, or sigmoid curve
3.5 - Population Pyramids
Age cohorts & growth = groups of similarly aged individuals
0-14 = prereproductive; 15 - 44 = reproductive age; 45 + = post reproductive
Size difference between 0-14 & 15-44 indicates growth rate
Larger 0-14 cohort = current & future growth
Roughly equal 0-14 & 15-44 = slight growth/stable
Larger 15-44 = pop. decline
Extreme Pyramid shape = rapid growth
Less extreme pyramid = slow, stable growth
“House” shape = stable, little to no growth
Narrowest at base = declining pop.
Highest to Lowest Growth Rate
India > US > China > Germany
Number of 0-14 Individuals
India = 360 million
US = 62 million
Germany = 11.5 million
China = 270 million
3.7 - Calculating Future Population
Total Fertility Rate (TFR): average number of child a women will have
Higher TFR = higher birth rate, higher pop. growth rate (generally)
Replacement Level Fertility: The TFR required to offset deaths in a population and keep the population stable
About 2.1 in developed countries (replace mom & dad)
Higher in less developed countries due to higher infant mortality
Infant Mortality Rate (IMR): number of deaths of children under 1 per 1,000 people.
Higher in less developed countries due to lack of access to: healthcare, clean water, and food
Higher IMR = higher TFR, due to families having having replacement children
Factors of IMR decline:
Access to clean water
Access to healthcare
Factors that affect TFR
Development (Affluence): the more developed the nation, the lower the TFR
More education for women
More economic opportunity for women
Higher access to family planning and education
Later age of first pregnancy
Less need for children to provide income through agricultural labor
Gov. Policy: can play a huge role in fertility by coercive (forceful) or noncoercive (encouraging) policies
Forced or voluntary sterilization
China’s 1 child policy
Tax incentives to have fewer children
Microcredits or loans to women without children to start businesses.
3.8 Malthusian Theory
(what Malthus theorized):
Earth has a human carrying capacity, probably based on food production
Human population growth is happening faster than growth of food production
Humans will reach a carrying capacity limited by food
Technological Advancement
Humans can alter earth’s carrying capacity with technological innovation
Ex: synthetic fixation of Nitrogen in 1918 leads to synthetic fertilizers, dramatically increasing food supply.
Growth Rate (r) = % increase in a population
Ex: a growth rate of 5% for a population of 100 means they grow to 105
Crude Birth Rate (CBR) & Crude Death Rate (CDR)
Births & deaths per 1,000 people in a pop.
Ex: Global CBR = 20 & CDR = 8
Calculating Growth Rate (r)
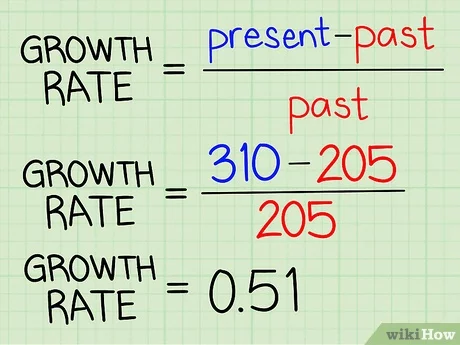 Multiple by 100 for percentage!
Factors that increase pop. growth
Higher TFR → higher birth rate
High mortality can drive up TFR (replacement children)
High immigration level
Increased access to clean water & healthcare (decreases death rate)
factors that decrease population growth rate
High death rate
High infant mortality rate
Increased development (education & affluence)
Increased education for women
Delayed age of first child
Postponement of marriage age
Standard of Living
What the quality of life is like for people of a country is based on GDP and Life Expectancy.
Gross Domestic Product (GDP) = key economic indicator of standard of living
Total value of the goods & services produced
Per capita GDP is total GDP/total population
So per capita means per person
Life expectancy = key health indicator of standard of living
Average age a person will live to in a given country
Increases with access to food, water, and healthcare.
High GDP & life expectancy are both indicators of development and low population growth.
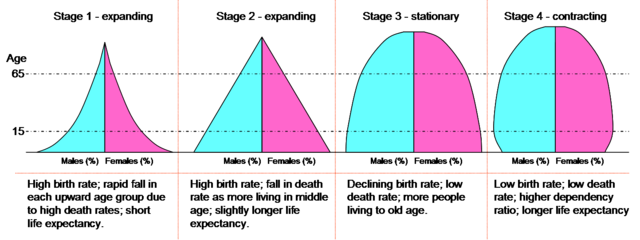
3.9 Demographic Transition Model
Industrialization: the process of economic and social transition from an agrarian (farming) economy to an industrial one (manufacturing based)
Pre-industrialized/Less developed
A country that has not yet made the agrarian to industrial transition
Typically very poor (low GDP)
Typically high DR & high IMR
High TFR replacement children & agricultural labor
Industrializing/developing
Part way through this transition
Decreasing death rate & IMR
Rising GDP
Industrialized/developed: completed the transition
Very low DR and IMR
Livery high GDP
Low TFR
Stage 1
High IMR & high death rate due to lack of access to water and healthcare
High TFR due to lack of access to:
Family planning
Need for child labor
Little to no growth due to high CBR & CDR balancing each other out
Ex: Virtually no country is in phase 1, but there are pockets or regions in phase 1 within countries who have transitioned to phase 2
Stage 2
Modernizations bring access to clean water, healthcare, stable food supply
IMR and CDR decline
TFR remains high due to
Lack of family planning
Need for labor
Generational lag
Rapid growth, due to high CBR and declining CDR
Econ./societal Indicators
Low per Capita GDP
High TFR
high IMR
low literacy rate
Stage 3
Modernized economy and society increase family income, so TFR declines significantly due to
More education for women
Delayed age of marriage & first child to focus on ed./career
Access to family planning
Slowing growth rate as CBR drops closer to CDR
Econ./societal Indicators
High per capita GDP
long life expectancy
TFR near 2.1
High literacy rate
Stage 4
Highly modernized countries that are very affluent
TFR declines even further as families become more wealthy and spend even more time on education and career pursuits
Increased wealth & education brings even more prevalent use of family planning
CBR drops lower than CDR & growth becomes negative (pop. decline)
Econ./Societal Indicators
High per capita GDP
~2.1 TFR
Long life expectancy
Growth factors
Sex ratio: ratio of males to females. Closer to 50:50, the more ideal for breeding (usually)
Die-off or bottleneck effect can lead to skewed sex ratio (not enough females) limiting population growth
Density-Dependent Factors: factors that influence pop. growth based on size:
Ex: food, competition for habitat, water, light, growth based on size
All of these things limit pop. growth based on their size; aka - small pop. don’t experience these, large do
Density-independent: factors that influence pop. growth independent of their size
Ex: natural disasters
(flood, fire, tornado, hurricane)It doesn’t matter how big or small a pop. is, natural disasters limit them both
Food is a density dependent factor. (also a limiting resource)
When twice as much food was added to the dish, both species increased carrying capacity by about 2x
Biotic Potential = max. potential growth rate, with no limiting resources
May occur initially, but limiting factors (competition, food, disease, predators) slow growth, & eventually limit pop. to carrying capacity (k)
Biotic potential = exponential growth
Logistical growth = initial rapid growth, then limiting factors to limit population to carrying capacity, or sigmoid curve