AP Macro Unit 2
2.1 GDP
The Circular Flow and GDP
Macroeconomics is the study of the large economy as a whole
Why study it? - Government during the Great Depression didn’t understand how to fix a depressed economy with 25% unemployment
GDP - Gross Domestic Product
All countries have three economic goals
Promote economic growth
Limit unemployment
Keep prices stable (limit inflation)
Natural income accounting
Economists collect stats on production, income, investment and savings.
GDP is the dollar value of all final goods and services produced within a country in one year.
What does it tell us?
GDP measures how the U.S. is doing financially
How do you use it?
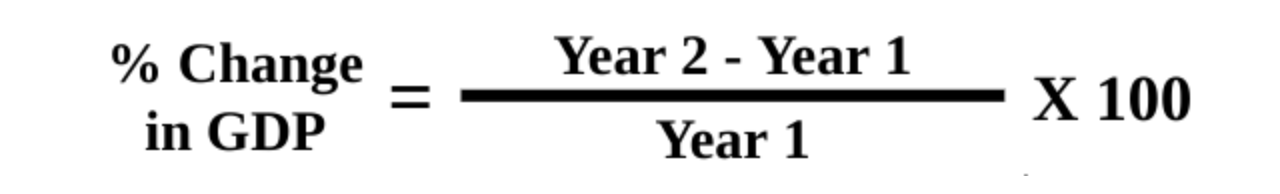
Compare to previous years (Is there growth?)
Compare to policy changes (Did the new policy work?)
Compare to other countries (Are we better off?)
How to measure growth from year to year?
GDP does not accurately measure the standard of living
GDP Per Capita (one person)
GDP divided by the population. It identifies on average how many products each person makes.
What is NOT included in GDP?
Intermediate Goods
Goods inside the final goods (Price of finished car, not the stock radio or tires)
Non Production Transactions
Financial transactions (stocks, bonds, real estate)
Used goods (old goods, used clothes, existing homes)
Non-market and Illegal Activities
Things made at home (Unpaid work, black markets, drugs)
Ways to Calculate GDP
Expenditure Approach - add up all the spending on final goods and services produced in a given year.
Consumer spending + investment + government spending + net exports (exports minus imports) provides a complete picture of the economy's total output.
GDP (Y) = C + I + G + (X-M)
Consumer spending
Durable goods (cars)
Non-durable goods (food)
Services (dental work)
Investment spending
Investment is NEVER when individuals buy assets like stocks and bonds.
Investments is ALWAYS when businesses by capital like machines, resources and tools.
Government spending
Includes payments made by the gov. for goods and services
NOT stuff like social security
Income Approach - adds up all income earned from selling all final goods and services produced in a year.
Value-added Approach - add up the dollar value added at each stage of the production process.
Each method should generate the same number
2.2 Limitations of GDP
GDP does not account for the distribution of income among residents of a country, which can lead to an incomplete understanding of economic well-being.
It ignores non-market transactions, such as household labor and volunteer work, which can significantly contribute to societal welfare.
GDP may not reflect the sustainability of growth, as it does not consider the depletion of natural resources or environmental degradation.
Non-market transactions - many goods and services provide value but don’t count in GDP
2.3 Unemployment
Unemployment
workers that are actively looking for a job but aren’t working.
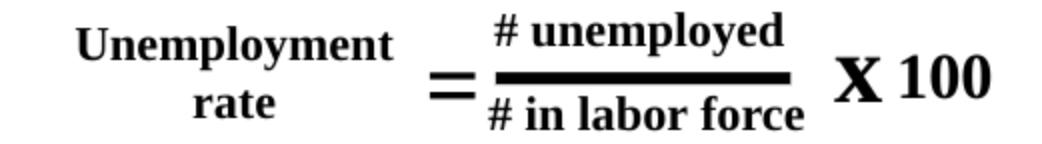
The unemployment rate
the percent of people in the labor force who want a job but are not working.
Real GDP = nominal GDP/GDP deflator x 100
3 Types of Unemployment
Frictional unemployment
Temporary employment or being between jobs
Ex: High school or college graduates looking for jobs
Individuals that were fired or are looking for a better job
Season unemployment is a specific type of frictional employment
Structural unemployment
Changes in the labor force make some skills obsolete
These workers don’t have transferable skills and these jobs will never come back, workers must learn new skills.
Ex: AI replacing jobs, milkman, VCR repair man
Technological unemployment is a type of structural employment where automation and machinery replace workers.
Cyclical Unemployment
Unemployment caused by a recession
As demand for goods and services falls, demand and labor workers are laid off
Sometimes called “demand deficient unemployment”
Ex: Steel workers laid off during recessions
Natural Rate of Unemployment
The economy is doing great if there is only frictional and structural unemployment
NRU - Frictional plus structural
Full Employment Output (Y) - Real GDP created when there is no cyclical unemployment
The US is at full employment when there is 4-6% unemployment
Difference between Natural Rate of Unemployment (NRU) and Non-Accelerating Inflation Rate of Unemployment (NAIRU)
NRU focuses on output and not having too much unemployment
NAIRU focuses on inflation and not having too little unemployment
Criticisms of Employment Rate
Discouraged workers
Underemployed workers
Race/age inequalities
2.4 Price Indices and Inflation
Inflation can disproportionately affect different groups, leading to varying impacts on purchasing power and living standards.
Inflation is rising general level of prices and it reduces the “purchasing power” of money.
Ex: It takes $2 to buy what $1 bought in 1989.
Deflation is a decrease in general prices or negative inflation rate
Deflation is bad because people will hoard money and assets
This decreases consumer spending and GDP
Disinflation - prices increasing at slower rates
How is inflation measured?
The Inflation Rate - the percent change in prices from year to year
Price Indices - index numbers assigned to each year that show how prices have changed relative to a specific base year
Consumer Price Index (CPI)
Base year is given an index of 100
To compare, each year is given an index number as well
CPI = price of market basket/price of market basket for base year x 100
Inflation rate: New#-Old#/Old# x100
Problems with CPI
Substitution bias - as prices increase for the fixed market basket, consumers by less of these products
New products - the CPI market basket may not include the newest consumer products
Product quality - CPI ignores both improvements and decline in product quality
2.5 Costs of Inflation
Effects of Unanticipated Inflation
Nominal Wage - wage measured by dollars rather than purchasing power
Real Wage - wage adjusted for inflation
2.6 Real v. Nominal GDP
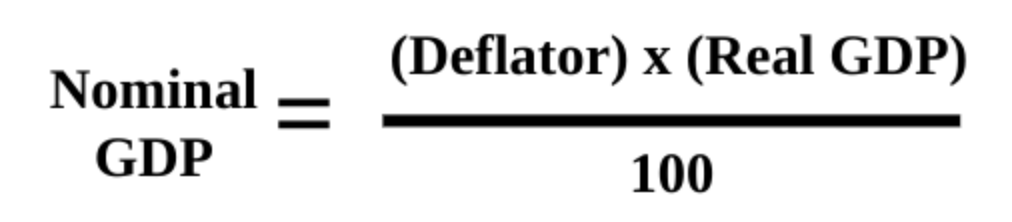
Nominal GDP - measured in current prices, doesn’t account for inflation
Real GDP- expressed in constant, unchanging, dollars. adjusts for inflation
CPI VS GSP Deflator
Measures the prices of all goods produced, whereas the CPI measures prices of onlu the goods and services bought by customers
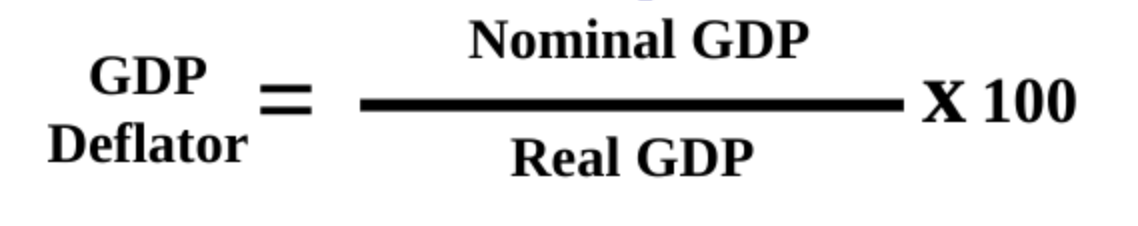
Real GDP = Nominal / GDP Deflator x 100
2.7 Business Cycles
The Business Cycle (real GDP over time) fluctuates
Real GDP per capita
Money supply
Inflation rate
Cyclical rate of unemployment
Velocity of Money
Tracks how many time a dollar is repeatedly spent in an economy
Formula:
MV=PY
(Money being tracked)(Velocity that money changes hands in a given time period)=(Price)(GDP)
Higher velocity the more active an economy