Intelligence
Definitions of Intelligence over the years
Spearman & “G” Factor early 1900s
Itelligence consisted of 2 kinds of factors
Single, general factor “g”
Specific factors or s (s1-4)
G factor was most important; s factors specific to particular tests
Advantaged - g can be represented with IQ score
Advantages - neglects other kinds of abilities (motor, musical, practical, creative)
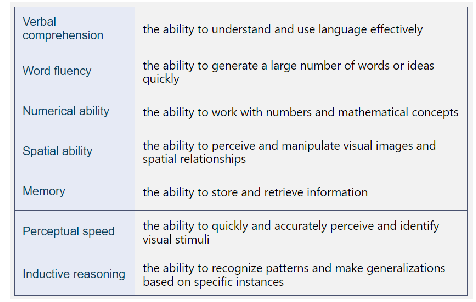
Thrustone’s primary Mental Ability
Analysed differents test of mental abilities
Applied factor analysis to items making up intelligence tests, discovered several broad factors
Cattell-Horn: Crystalized and fluid Intelligence
Fluid Intelligence: ability to reason abstractly, identify patterns, form concepts, use logic to solve problems, regardless of previous knowledge or experience
Crystallized Intelligence: requires the use of info that a person has acquired from previous experiences including verbal comprehension, social skills, and general knowledge
Gardner’s Multiple Intelligence
Proposed intelligences theory
Intelligence is not believed to be a single, unified concept
Combination of different abilities or intelligences that are relatively independent of one another
Sternberg’s triarchic Theory
Criticized spearman’s g as being too narrow (IQ tests only limited to solving skills and cognitive abilities
Defined intelligence by analyzing three different kinds of reasoning:
Analytic
Problem-solving
Practical
Cattell-Horn-Carroll Theory of Intelligence
Most comprehensive theory of intelligence that currently has the most scientific support
CHC theory rests on the assumption that intelligence is made up of multiple abilities categorized through hierarchies
Bottom of the hierarchy are domain-specific and highly specialized abilities (eg. spelling ability)
These specific abilities are the ones that would be measured directly
Clustered into several broad abilities which work together form our overall
Consistency/Reliability
Consistency among scores
Consistency among raters
Consistency over time
Inter-Rater Reliability
Measure of agreement do two raters on ratings of performance or behaviour?
Computed in two-ways:
Correlated raters’ scores
% agreement among raters, # agreements, # possible agreements
High Level of training is needed to ensure same judgment
Test-Retest Reliability
Administer same test at two separate times, find correlation between scores
Only for traits that remain stable over time
Concerns
Influenced by learning, memory, fatigue
Changes in participants responses for performance
Split-Half Reliability
Test is given and items are divided into halves, scored separately
Concerns
Reliability depends on number of items in test
Validity
Just cuz test is measuring something, consistently, does not mean it is measuring what it is supposed to measure
Does the test measure what is intended to measure?
Concurrent Validity
Test and criterion can be measured at the same time
If correlation is high, we have evidence of validity
Criterion is a direct & independent measure of what is being tested or assessed
Measuring Intelligence
Binet-Simon Intelligence Test
French government mandated all children attend school, Both men were commissioned to develop a scale for identifying children who would struggle
Age Differentiation - belief that younger and older children differed intellectual ability
Mental vs Chronological Age - eg. if your were 7 and could complete tasks of a 10 year old, you had a mental age of 10
Idiot - most severe intellectual impairment
Imbecile - moderate impairment
Moron - mildest level of impairment
IQ testing in adults Wechsler Adult Intelligence Scale
Wechsler-bellevue intelligence scale developed in 1938 in reaction to problems with 1937 Stanford-Binet
SB items not appropriate for use with adults
SB had lots of timed tests, difficult for older adults
SB did not consider that intellectual performance can deteriorate as a person grew older
SB produced only one score
Structure of the WAIS-IV
Mean for use with adults ages 16 years and 0 months to 90 years and 11 months
Takes 60-90 minutes to complete the 10 core subtests
Can be completed using paper and pen or a web-based platform
Verbal Comprehension Scale
Measures ability to understand and se verbal information, including vocabulary, general knowledge, and verbal reasoning skills
Perceptual Reasoning Scale
Measures ability to reason and problem solve using visual-spatial and nonverbal information
Working Memory Scale
The Working Memory Index Scale measures a person’s ability to temporarily hold and manipulate information in memory
Processing Speed Scale
Measures an individual’s ability to process simple or routine information quickly and accurately in order to assess visual and motor speed
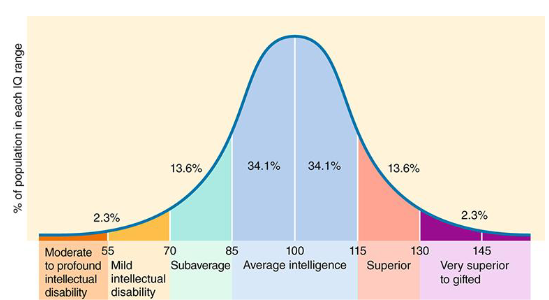
Average IQ
Average IQ is 100, standard deviation of 15
68% of people score between 18-115
95% of people have IQs between 70 and 130
Nearly all people have IQs between 55 and 145
The Flynn Effect
Steady increase in IQ scores between 1932 and 1978
Trend continued and supported through the 2000s
Greater gains found in nonverbal and performance based measures, not arithmetic and vocabulary scales
May be due to education or test development
Intelligence Tests and Performance
Modern intelligence tests have high reliability and validity
Consistent measure of what is intended to measure
Scores correlate with occupational and social achievements, income, and health-related behaviours
Correlation does not mean causation
Nature of Nurture?
Stronger correlation between intelligence scores of identical twins compared to fraternal twins
Strong correlation exists between IQ scores of parents and biological children
Heritability of IQ is around 50%
Education may be the most consistent means of increasing IQ scores
Enrichment and early intervention can help support intellectual development for children living in deprived environments
Other ways to assess intelligence
Brain size
Neural density
Processing Speed
Neural efficiency
Cortical Maturation