Operational Case Study Notes
Throughput Accounting:
Throughput accounting is a management accounting tool/ modern costing technique that focuses on making good use of bottleneck time and improving the flow of production by measuring the contribution margin per unit of constrained resource. Maximises throughput contribution
Throughput is the ‘Selling Price - Direct Material’
Return per factory hour = Throughput/Bottleneck hours
Cost per Factor Hour = All Factory Costs/All Bottleneck hours
TPAR = Return per Factor Hour/ Cost per Factor Hour
This ratio helps determine the profitability of each factory hour in relation to the overall costs incurred, allowing for better decision-making in resource allocation. Bigger than 1 indicates that the factory is generating more return relative to its costs, which suggests efficient use of resources and higher profitability. Conversely, a TPAR less than 1 indicates that the factory is not generating enough return to cover its costs, which may necessitate a reevaluation of operational processes or cost structures to enhance efficiency.
This shows profitable use of bottleneck time, allows us to see what is worthwhile
It does assume that we use JIT and that there is no closing stock.
Sensitivity Analysis:
This enables management to examine the estimated budget figures to find out how much each can change by before the budgeted profit becomes a loss.
Pro - Provides us with more information about critical variables and sensitivities of estimates involved in the budget.
Con - Although it assumes that changes to estimated variables will occur independently and other figures remain the same. Assumes each variable changes in isolation however some variables are interrelated.
A “What if” analysis would be more useful for simultaneous changes.
Budgetary Control:
Feedback -
Comparison of planned against actual results
Take action going forward after the period
Correct for the next period (reactive)
Feedforward -
Anticipates the problem, aims to prevent them
Proactive
Involves regularly updated forecasts being reported
Linear Regression:
Is the relationship between 2 variables and is a forecasting tool. y=a+bx
Correlation - a link, a relationship
Correlation Coefficient - Is the degree of correlation, obtaining a value for ‘r’. Shows how strongly related the two variables are
Coefficient of Determination - Measures how good the estimated regression equations is ‘r2’ . The higher the ‘r2’ , the more confidence. It is shown as a percentage. This shows how much of Y can be explained by the change in X
Limiting Factors:
1 limiting factor - can use contribution per unit of limiting factor
2+ limiting factors - must use linear programming,solving using either a graph or simultaneous equations
Linear Programming:
Used in linear programming graphs to determine the optimum value for X and Y while satisfying a number of constraints
Feasible Region - An area of the graph that lies inside the various production constraints and contains all possible combined quantities of X and Y
Optimal Production Point - Where constraints meet (last point reached parallel to the ISO contribution line). It represents the optimal production quantity for both products that maximises contribution and does not exceed any constraints.
ISO Contribution Line - dotted line that shows the relative contribution attributable from each product type and is a moveable line. We should slide away from 0 keeping at the same angle until it touches the last vertex of feasible region.
Shadow Price - This is the premium amount that we are willing to pay over the usual for one unit of scarce resource. We would look at extra contribution of production plans.
Assumes - Fixed costs are unchanged by decision, Unit variable costs is constant, No interdependence of demand between products, Demand and resource estimates are known certainty, Units of output are divisible and Scarce resource amount is known with certainty.
Budgeting:
Planning
Controlling
Evaluation
Communication
Coordination
Motivation
Authorisation
Sensitivity - Revise one key budget assumption and analyse impact
Stress testing - Preparing for unexpected events e.g changes in consumer taste etc
Types of Budgeting:
Incremental
Zero Based Budgeting (ZBB)
Rolling
Activity Based
Flexible
Beyond Budgeting
Activity Based Budgeting:
One method of budgeting that brings greater discipline to the process of budgeting for overhead activities and costs.
Similar to ABS using drivers data to calculate a budgeted figure
Pro - accurate targets/budgets
Pro - Better for performance management
Zero Based Budgeting:
Steps:
Identify objectives
Create decision packages - mutually exclusive (different ways to achieve the same objective) and incremental (different levels of the same idea)
Evaluate, rank and allocate
Pro - Is efficient allocation of resources
Con - Is time consuming
Beyond Budgeting:
This incorporates the idea that companies need to move beyond budgeting because of inherent flaws in traditional budgeting methods e.g outdated, restricted, blame culture, backwards looking.
More effective for the changing environment as well as for continuous improvement
This prefers the use of rolling forecasts
This gives us a range of performance measures including non financial measures e.g KPIs and benchmarking and not just traditional variance analysis (not just financially focused)
There is an emphasis on he future, how will Backoffice meet the Carbon Neutral goal by 2030?
Encourages participation like bottom up budgeting.
CGMA Transformation Model:
Was developed along side AICPA and explains how the principles of costings can help a business. It encourages cost competitiveness while also making sure the risks of cost competitiveness is managed within companies with 6 principles.
Engendering to a Cost Conscious Culture -
The aim is to have low costs
Want to reduce costs by reducing wasteful expenditure and should be an aim for all departments within the business e.g instead of post using email.
Want to encourage competition.
Managing the Risks Inherent in Driving Cost Competitiveness -
Managing the risks that come with lowering costs
Don’t want to damage the quality of products/service
This can lead to damaging customer satisfaction
Understanding Cost Drivers -
Having an understanding of what is driving the costs of the business
Allows managers to have more insight and understanding what is influencing their costs and how to control it.
Could implement ABC that apportions overheads based on cost drivers/pools.
Helps with better decision making along with greater visibility of costs
Connecting Products with Profitability -
Making sure products we are selling generate profit and is still making positive contribution.
Still creating value
Generating Maximum Value Through New Products
Analysing the profitability of any new product we decide to produce
To assess if it will add value and ensure there is a viable market that they are able to reach (see if there is demand)
Incorporating Sustainability to Optimise Profits -
Not only to optimise profits but also to create strong reputation
Avoid waste
Making sure we adhere to environmentally friendly practices
Recycled materials/products
Reducing emissions (improves reputation)
Look at the products, packaging and behaviours
Corporate Governance:
OECD -
Was for companies with tradeable shares
6 principles from fair treatment for all shareholders through to responsibility of the board (e.g NEDs)
Represents common basis for OECD member countries and is considered essential for development of good government practice however is not intended to be a substitute for individual governments
NEDs -
currently no NEDs at Backoffice but already have an experienced team
To look at the Cost vs the Benefit
Assuming Backoffice is not a listed company
Capital Tax:
For when a company disposes of an asset (capital gains)
Accounting wise = Selling Price - Cost - Initial Cost of Purchase = Gain on Disposal
Capital Tax = Net Sales - Initial Costs - Further Costs= Gain - Index taxation allowance = Taxable Gain x 20%
Index taxation allowance - allowance for impact of inflation (available on original cost from date of purchase until date of sale)
Tax:
Taxable Profit is taxed at 25%
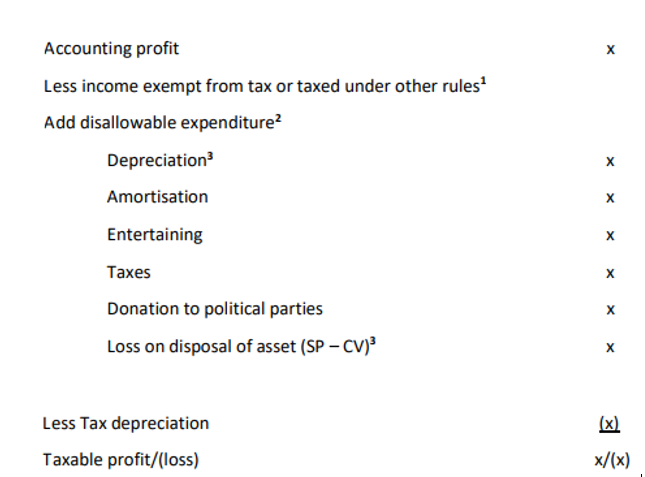
Tax depreciation allowance of 25% on plant and equipment. There is a full year allowance in the year the asset is acquired
Tax losses carried forward indefinitely against future taxable profits from the same business
Tax payable = Accounting Profit + Accounting Depreciation - Tax Depreciation Allowances.
Assume tax depreciation allowance is higher than accounting depreciation since depreciation rate (25% compared to 20%) and the fact tax depreciation allowance is not pro-rated.
IAS 36 Impairment:
An accounting standard that outlines procedures an entity must follow to ensure their assets are carried on the SOFP at no more than their recoverable amount
Recoverable amount - higher of value in use (by using it) or it’s fair value less costs to sell (by selling it)
If asset is not being used, value in use will be low
Impairment is necessary where there is a change in use of the asset (if the carrying value is affected)
Or could it be a NCA held for sale if they plan to sell? IFRS 5
Backoffice currently use historic costs
Will reduce the asset carrying amount on the SOFP and charge the decrease as an expense to the SOPL
IAS 10 Events after Reporting Date:
This looks at adjusting and non adjusting events after year end but prior to the accounts being finalised (signed off by directors)
An adjusting event will be recognised and updated in the accounts
A non adjusting event will be disclosed if material
To adjust the accounts, the condition needs to have existed at year end
If after year end however will affect next years accounts, will need to disclose the nature of the event, the value of any costs and losses that will feature in the next year. To look at any mitigation costs (insurance costs?)
IFRS 5 NCA Held for Sale:
To be classed as an asset held for sale, needs to meet the following conditions:
Expected to sell within 12 months
Immediately available in its current condition
Active market
Management are committed to the sale, there is a plan and is highly probable
Financial statements - Stop depreciating, move to current assets on the SOFP.
The value of the asset will be recognised at the lower of the carrying value or the net realisable value (fair value less costs to sell)
IFRS 16 Leases:
Looks at lease accounting, gives rise to both ‘right of use asset’ and a lease liability being recognised in the SOFP.
NCA:
A NCA is created which is depreciated over the shorter of it’s lease term or UEL
The NCA is initially recorded at it’s in year payment plus the present value of lease payments and fees (is capitalised).
The NCA is depreciated using it’s capital cost divided by the shorter of the lease period or UEL multiplied by the current months.
Lease Liability:
Split between Current Liability and Non Current Liability and recognise as the PV of the lease
Current liability is the payments due within 12 months where we would increase by the interest in the year pro rata on the SOPL
Non current liability is the payments due after 12 months where we would increase by interest and decrease by lease payments on the SOFP
PV + Interest = Lease payments
IAS 2 Inventory Value:
Inventory is to be valued at the lower of cost or net realisable value
Costs include cost of purchase, other costs to bring inventory to present location, cost of conversion less any discounts or rebates.
The NRV is the Selling Price less estimated completion/selling costs
This allows us to use standard cost as long as it’s a good approximation of actuals
IAS 16 PPE:
This looks at what can be recognised as an asset
It can be recognised if it is probably that future economic benefits will flow to the entity and it can be reliably measured.
Capitalise costs - directly attributable costs that bring the asset to it’s present condition/ intended use (includes delivery and installation costs)
Revenue costs - maintains and repairs the asset that do not meet requirements. Includes training costs as we cannot control if staff members choose to leave.
Digital Product:
refers to product that is stored, delivered and consumed in an electronic format
Digital Costing for Apps:
Considers both fixed and variable costs
Although marginal costs are virtually zero
There will be an initial fixed cost for the start up and will be spread over estimated downloads
Variable costs will be a royalty fee per download as well as ongoing costs like maintenance, software upgrades, hosting costs.
Cost per unit = (fixed costs/estimated downloads) + Variable costs
Con - Estimating the amount of downloads is difficult
Con - Estimating ongoing costs is difficult
Con - Drivers difficult to determine
Digital Costing System:
A fully integrated system solution that enable a company to quickly find costs for their production
Links to internal digital systems with those of suppliers, customers and the eternal market
In real time
Pros - Increases competitiveness, Better understanding of costs, long term reduction in costs (low operational costs), improved communication with supply chain
Relevant Costing:
Excludes sunk, committed and notional costs
Should be future, incremental, cash based and include opportunity costs that are purely based on a decision (FICO)
External Data Graphs:
Problems-
Using historical data
Veracity of information
Company background (in the same market?)
External factors (consumer preferences, economic conditions)
Importance of KPIs:
Provides quantifiable metrics to assess performance in real time
Identifies issues quickly
User friendly and visibly see performance
Multiproduct Breakeven Graph (CVP or P/V):
Horizontal axis show cumulative sales revenue
Vertical axis show the resulting profit or loss at different levels of sales
Fixed cost- this is where the Y axis are nil, sales volume is nil, shows cost still incurred which is fixed costs nature to be independent.
Points A - F - Represents sales and profits that would be earned in order of selling highest c/s ratio first. (products sold in order of c/s ratio). The steeper the line, the higher the c/s ratio.
Straight line - Different sales assumption of selling products at their budgeted sales mix proportions (weighted average).
Margin of Safety - The difference between the breakeven point on either of the two lines and the estimated total sales revenue. This it the tolerance of sales that can fall before breaking even.
This assumes no stepped fixed costs, bulk discounts etc.
Cons - assumes me want to sell most profitable first.
Cons - assumes constant standard costs and selling prices
Cons - assumptions of straight line and standard sales mix (consumer preferences)
Pro - an idea of the minimum level of sales revenue to achieve breakeven
Time Series:
Past data that aids forecasting by identifying a trend including seasonal variation for future sales
Trend - Underlying general direction of sales over time (upwards/downwards). You can make a trendline by moving averages, line of best fit or regression.
Seasonal Variation - is a regular pattern/ fluctuations that occur throughout a period of time
Cyclical Variation - Long/medium term fluctuation/cycles e.g inflation
Residual Variation - Random variations (anomalies/outliers) e.g war
Decision Trees:
A map of possible outcomes of a series of related choices (evaluate from right to left)
Square - is a point at which the decision maker has control over
Circle - is an outcome over which the decision maker does not have control (probabilities usually available for various outcomes)
Branches - Show potential direct or results from each decision or outcome
Probabilities & outcome values - estimated figures as an outcome resulting from each decision.
They rely on expected value technique so we are assuming this is a risk neutral decision maker. Probabilities are subjective (estimates and are unknown).
Short Term Investment:
To look at risk, return and liquidity
Examples like certificate of deposits, interest bearing savings accounts, corporate bonds, short dated government bonds, negotiable instruments.
Short Term Financing:
Factoring-
Customers are aware of he factor
Debt is collected for you (professional collection)
Debt sold at a discount for immediate cash
Non recourse (client protection from irrecoverable debt)
Invoice Discounting -
Temporary source of cash
Customers are not aware of the third party input
We are responsible for the collection
Recourse
Trade payables/receivables
Financing Exports (Documentary credits, Bills of exchange, Export factoring, Forfaiting)
Bank Overdraft
Working Capital Position:
Receivables are to do with retail outlets (60% of revenue)
Assume that all website sales are cash
Operating cycle - money going out is to pay credit suppliers and money coming back in from credit customers
Current working capital suggests conservative approach
Aggressive Policy - Reduce costs by holding the lowest levels of cash, inventory, receivables and payables
Conservative Policy - Reduce risk by holding high levels of cash, inventory, receivables and payables, long operating cycles.
Moderate Policy - in between aggressive and conservative
Economic Order Quantity (EOQ):
√(2CoD/Ch)
Cost per Order, annual Demand, Holding Cost per unit
Helps to minimise total inventory costs (holding and inventory costs) placing small vs big orders
Con - Lead times are assumed to be constant and predictable so we know when to order
Con - Assumes costs are constant and relies on constant demand
To include buffer stock in case of unpredictable situations where we an’t receive stock on time.
Activity Based Costing:
A costing method that allocated overheads based on cost drivers or usage of costs causing activities. Cost drivers are the cause of the cost.
The difference of the usage of resources determines if suitable.
Useful when overheads are high/ big proportion of direct costs.
Creates better costing/ pricing
Steps:
Group overheads into activities and group costs into cost pools
Identify the cost drivers
Calculate the cost driver rate for each activity
Absorb activity costs into products
Calculate full production costs
Pros -Better information, Better cost control, Better pricing, Fairer overheads in units.
Cons - Expensive/time consuming, still some arbitrary allocations, Need best cost drivers, ABC not allowed for statutory accounting
Marginal Costing:
Only variable production costs are charged to cost units
Fixed costs are charged to the period in which they are incurred
Pro - good for decision making and short term pricing, simple variance analysis
Con - Does not comply with IAS 2 inventories so YE adjustments required, may not cover fixed costs
If inventory increased = lower profit than absorption costing
Absorption Costing:
Includes production overheads/ fixed costs (along with variable)
Allocates, apportion and reapportion and absorption
Pro - Shows full production cost, complies with IAs 2
Con - Fixed cost not relevant to decision making, does not guarantee profitability, profits artificially increased by increasing production (costs carried forward in closing inventory)
If inventory increase = higher profit than marginal costing
Expected Values:
Is the long run weighted average and is the sum of probability multiplied by the outcome
Con - Ignores range of possible outcomes, heavily dependent on probability estimates, long-run average so inappropriate for one off decisions, EV may not correspond to any of the actual outcomes
Standard Deviation - Spread/volatility of outcomes (how far outcomes are spread)
Coefficient of Variation - SD/EV, ratio of the SD to the mean. Risk averse would be the lowest coefficient of variation.
Perfect Value:
Perfect value is the value if you knew for definite what the outcome will be
It’s the difference between the Expected Value (EV) without the perfect value (PV) and the EV with the PV (which would be the best outcome for each scenario)
Pro - gives us a ceiling limit
Con - not 100% accurate as still using EV
Decision Making Criteria:
Maximax - the best of the best case scenarios (maximising the maximum return)
Maximin - The best out of the worst case scenarios (maximising the minimum return)
Minimax Regret - Minimising the maximum loss (sore loser)
Sales Variances:
Sales Price - difference in revenue due to change in selling price
Sales Volume -
Sales Mix - proportions of products sold different to budget (calculate by looking at actual sales volumes at budgeted mix, comparing to actual sales mix - individual method) (can also be calculated at weighted average method - looks at difference between std margin per unit and the weighted average std margin per unit. We hope to sell less of the low margin and more of the high margin).
Sales Quantity - Change in the total volume of sales (calculated by comparing budgeted sales to actual sales in standard mix)
Overhead Variances:
Expenditure - Actual costs (AH x AR) vs budgeted costs (AH x SR)
Efficiency - Actual hours (AH x SR) vs budgeted hours (SH x SR)
Fixed Overhead Variances:
Expenditure - Actual costs vs Budgeted costs
Volume -
Efficiency - Hours needed for actual production (AH x FOARpH) vs hours should have needed for actual production (SHAP x FOARpH)
Capacity - Hours needed for actual output (AH x FOARpH) vs Budgeted expenditure
Operational and Planning Variances:
Planning - compares original vs revised standard (outside of managers control)
Operational - Compares actuals vs revised standard (within managers control)