🌱 AP Environmental Science Unit 1 Notes
6-8% of The AP Exam
Topics
1.1 Introduction to Ecosystems
1.2 Terrestrial Biomes
1.3 Aquatic Biomes
1.4 The Carbon Cycle
1.5 The Nitrogen Cycle
1.6 The Phosphorus Cycle
1.7 The Hydrologic (Water) Cycle
1.8 Primary Productivity
1.9 Trophic Levels
1.10 Energy Flow and the 10% Rule
1.11 Food Chains and Food Webs
These notes are based on Mr Jordan Dischinger-Smedes’s YouTube videos and the fill in template notes for these videos created by Carolyn Kelleher Mendonca. Some changes were made. Videos available here.
Good luck on the AP Test! 🩷
Important Figure to Know - Rachel Carson
During WW1, Carson wrote books to raise awareness about the environmental effects of DDT. (A synthetic insecticide) They would even spray DDT on people to kill typhus-carrying lice. They would cover entire islands to prevent malaria. However, DDT ends up killing birds and fish. This information was really only spread around professionals. Carson tried to bring it to public attention, but newspapers didn’t want the story. She published Silent Spring, showing the problems.
1.1 - Ecosystems
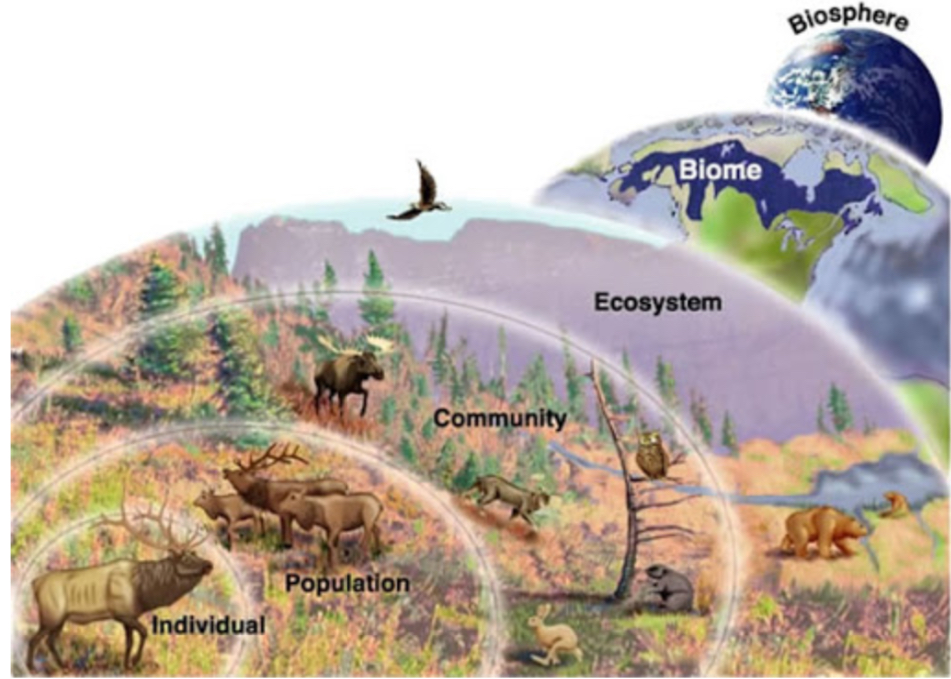
Individual - one organism
Population - group of same-species individuals of same area (elk herd)
Community - all living things in an area
Ecosystem - all living and nonliving things in an area (plants, animals, rocks, soil, water, air)
Biome - large area with similar climate conditions that determine plant and animal species there
Ex: (tropical rainforest)
Competition: organisms fighting over a resource like food or shelter; limits pop. size
Predation: one organism using another for energy source (hunters, parasites, even herbivores)
Mutualism : relationship that benefits both organisms (coral reef)
Commensalism: relationship that benefits one organism & doesn’t impact the other (birds nest in trees)

Herbivores: (plant eaters) eat plants for energy (giraffe & tree). It is still considered predation.
True predators: (carnivores) kill and eat prey for energy (leopard & giraffe)
Parasites: use a host organism for energy, often without killing the host & often living inside host
—‹ Ex: mosquitoes, tapeworms, sea lamprey
Parasitoids: lay eggs inside a host organism; eggs hatch & larvae eat host for energy
—‹ Ex: parasitic wasps, bot fly
Symbiosis:
Any close relationship between two organisms of different species
—‹ Mutualism (+/+), commensalism (+/0), and parasitism (+/-) are all symbiotic relationships
Mutualism: Organisms of diff. species living close together in a way that benefits both
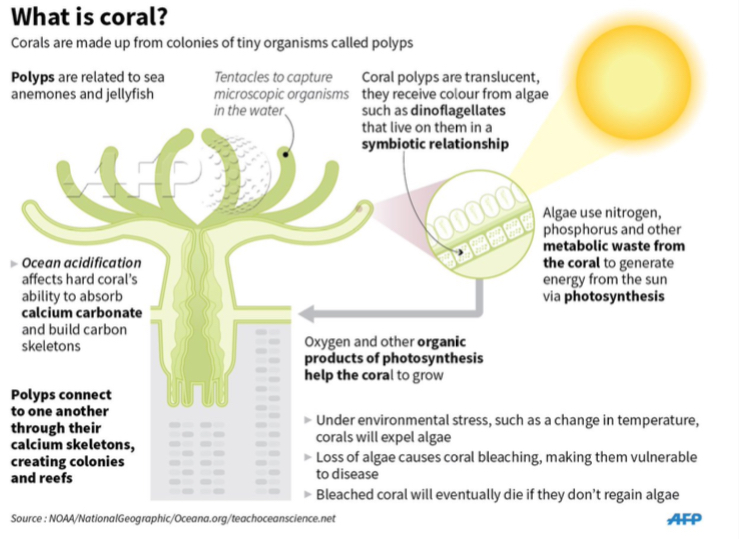
Coral (animals) provide reef structure & CO2 for algae; algae provide sugars for coral to use as energy
Lichen = composite organism of fungi living with algae; algae provide sugars (energy) & fungi provides nutrients
Competition
Competition reduces population since there are fewer resources available & fewer organisms can survive
Resources partitioning: different species using the same resource in diff. ways to reduce competition
Temporal partitioning: using resource @ different times, such as wolves & coyotes hunting @ different times (night vs. day)
Spatial partitioning: using diff. areas of a shared habitat (diff. length roots, live in different trees)
Morphological Partitioning: using diff. resources based on diff. evolved body features
1.2 - Terrestrial (Land) Biomes
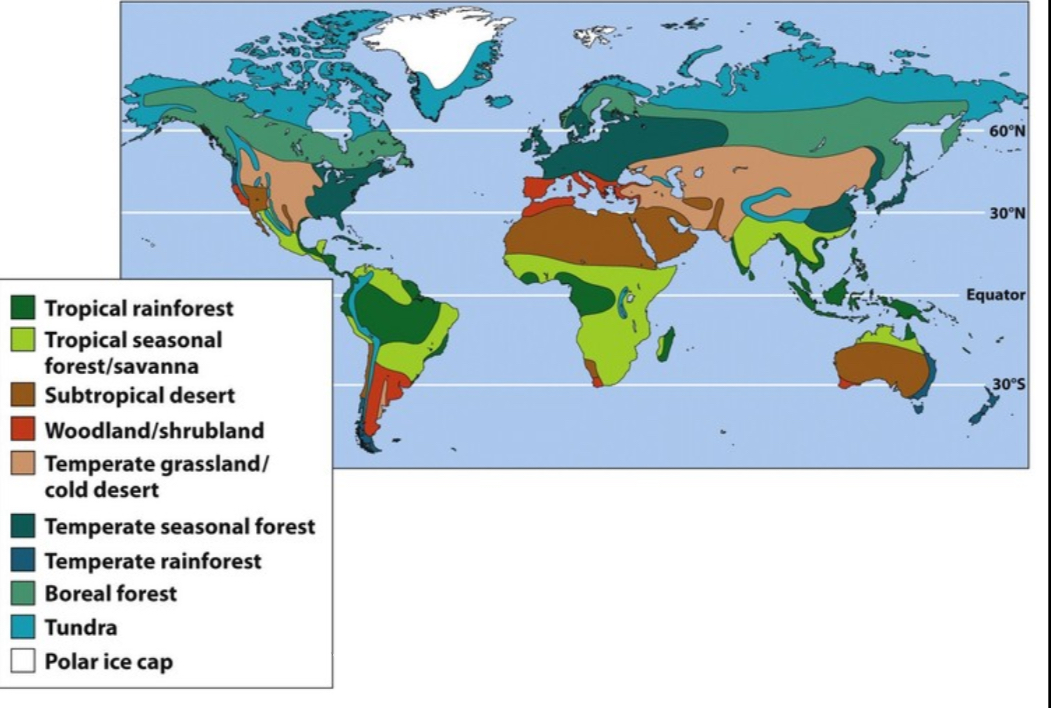
Biome: an area that shares a combination of avg, yearly temp. & precipitation (climate)
The community of org. (plants & animals) in a biome are uniquely adapted to live in that biome Ex: camels & cacti have water preserving traits for desert; shrubs & wildflowers store lots of energy to recover quickly from fire in grasslands
Latitude (distance from eq) determines temp. And precipitation which is why biomes exist in predictable pattern on earth
Biome chart can also predict where on earth biomes are found
Biomes are defined by annual temp. And avg. precipitation
Plants need soil nutrients to grow, so availability determines which plants can survive in a biome
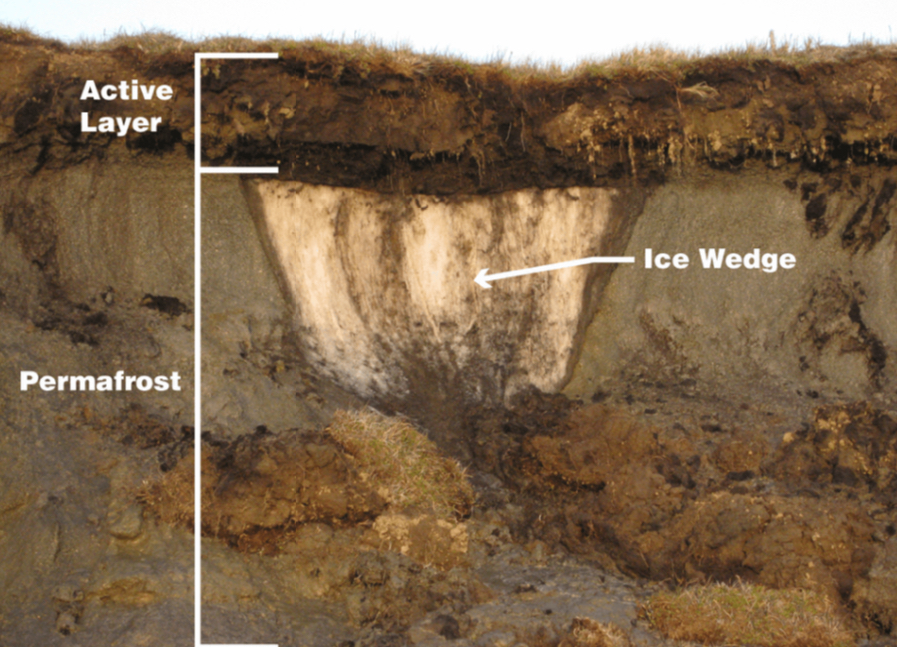
Ex: frozen soils of tundra don’t allow nutrients in dead organic matter to be broken down by decomposers
- Low soil nutrients
- Low water availability
- Few plants survive here
Tropical RF = nutrient-poor soil (high competition from so many diff. plant species)
Boreal forest = nutrient-poor soil (low temp. & low decomp. rate of dead org. matter)
Temp. forest = nutrient-rich soil (lots of dead org. matter - leaves & warm temp/moisture for decomp.)
Biomes shift in location on earth as climate changes
Ex: warming climate will shift boreal forests further north as tundra permafrost soil melts & lower latitudes become too warm for aspen & spruce
1.3 - Aquatic Biome
Salinity
How much salt there is in a body of water, determines which species can survive & usability for drinking
(Fresh water vs. estuary vs. ocean)
Depth
Influences how much sunlight can penetrate and reach plants below the surface for photosynthesis
Flow
Determines which plants and organisms can survive, how much O2 can dissolve into water
Temp.
Warmer water holds less o2 so it can support fewer aq. organisms
Rivers have high O2 due to flow mixing water & air, also carry nutrient-rich sediments (deltas & flood plains = fertile soil)
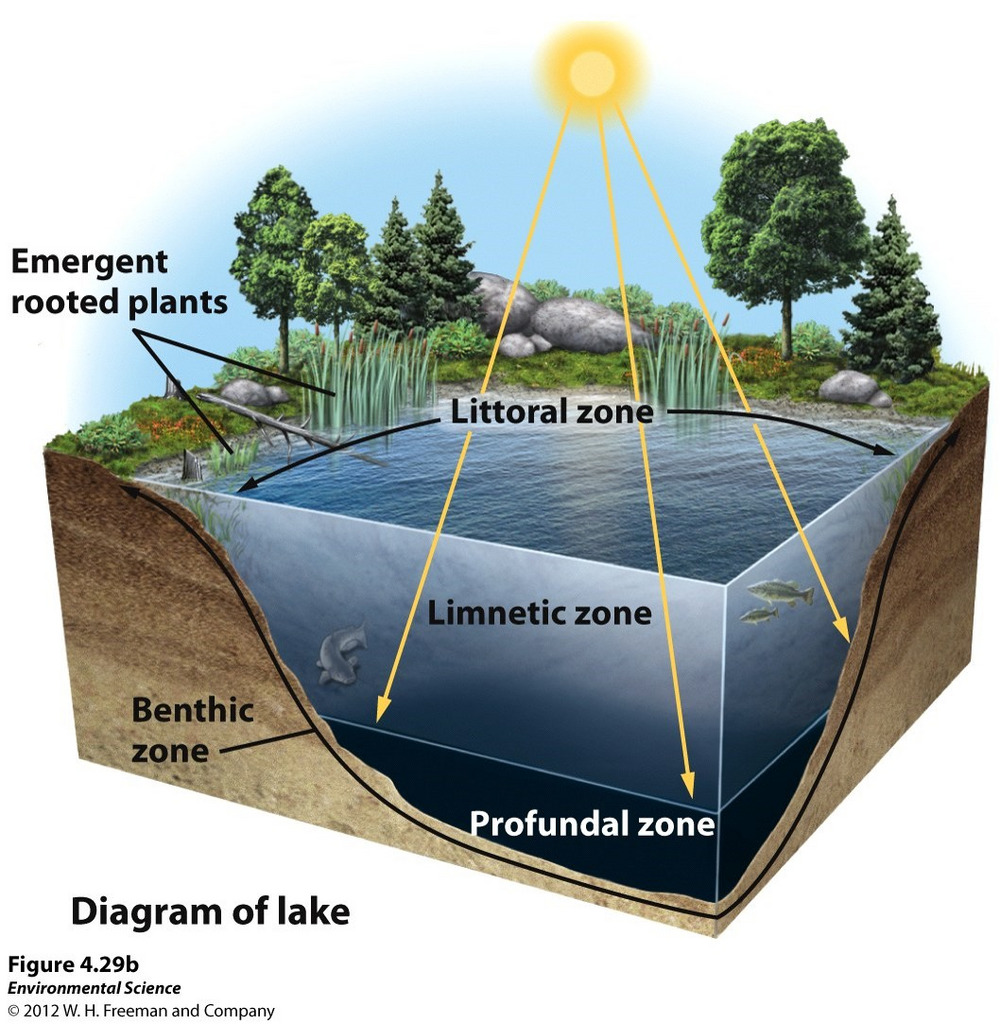
Lakes = standing bodies of fresh H2O (key drinking H2O source)
— Littoral: shallow water w/emergent plants
— Limentic: where light can reach (Photosynthesis)
—‹ No rooted plants, only phytoplankton
— Profundal: too deep for sunlight (no photosynthesis)
— Benthic: murky bottom where inverts (bugs) live, nutrient-rich sediments
Freshwater: Wetlands
Wetland: area with soil submerged in water for at least part of the year, but shallow enough for emergent plants. Plants living here have to be adapted to living with roots submerged in standing water (cattails, lily pads, reeds)
Benefits of Wetlands
Stores excess water during storms, lessening floods
Recharged groundwater by absorbing rainfall into soil
Roots of wetland plants filter pollutants from water draining through
High productivity (plant growth) due to lots of peat (dead organic matter) in sediments
Estuaries
Areas where rivers empty into the ocean
Mix of fresh and saltwater (species adapt to this ex: mangrove trees)
High productivity (plant growth) due to nutrients in sediments deposited in estuaries by river
Salt Marsh:
Estuary habitat long coast in temperate climate
Breeding ground for many fish & shellfish species
Mangrove Swamps:
Estuary habitat along coast of tropical climates
Mangrove trees with long, stilt roots stabilize and provide habitat for many species of fish & shellfish
Coral Reef
Warm shallow waters beyond the shoreline; most diverse marine (ocean) biome on earth
Mutualistic relationship between coral (animals) & algae (plants)
Coral take CO2 out of ocean to create calcium carbonate exoskeleton (the reef) & also provide CO2 to the algae
Algae live in the reef & provide sugar (energy) to the coral through photosynthesis
Both species rely on the other:
Coral couldn’t survive without sugar from algae.
Algae need the home of the reef & CO2 from the coral
Intertidal Zones
Narrow band of coastline between low and high tide
Organisms must be adapted to survive crashing waves & direct sunlight/heat during low tide
Ex: Barnacles, sea stars, crabs that can attach themselves to rocks
Shells & tough outer skin can prevent drying out (desiccation) during low tides
Different organisms are uniquely adapted to live in diff. Zones of the Intertidal Zone.
Ex: Spiral wrack (type of seaweed) curls up & secretes mucus to retain water during low tide
Open Ocean
Low productivity/area as only algae & phytoplankton can survive in most of ocean
So large though, that algae & phytoplankton of ocean produce a lot of earth’s O2 & absorb a lot of atmospheric CO2
Photic Zone = area where sunlight can reach (photosynthesis)
Aphotic Zone (abyssal) = area too deep for sunlight
1.4 - Carbon Cycle Overview
The Carbon Cycle is the movement of molecules that contain Carbon (CO2, Glucose, CH4) between sources and sink. Some steps are very quick (Fossil Fuel Combustion); some are very slow (sedimentation & burial)
It leads to imbalances in which reservoirs or sinks are storing carbon
The atmosphere is a key carbon reservoir; increasing levels of carbon in atm. Leads to global warming
Carbon Sink: a carbon reservoir that stores more carbon than it releases.
Ex: Ocean (algae & sediments), plants, and soil.
Carbon Source: processes that add Carbon to the atmosphere.
Fossil fuel (oil, coal, nat gas) combustion
Animal Agriculture. (cow burps & farts = CH4)
Deforestation, releases CO2 from trees
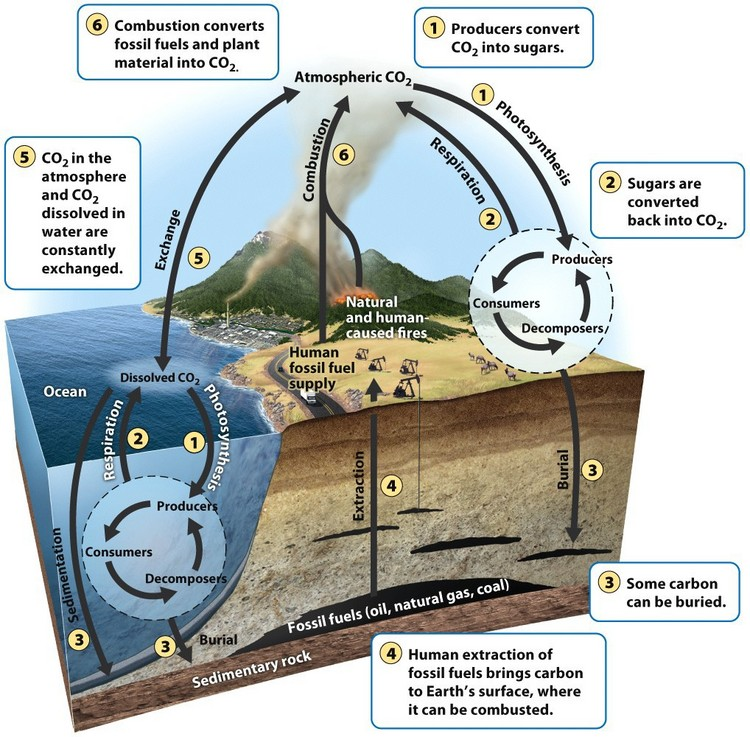
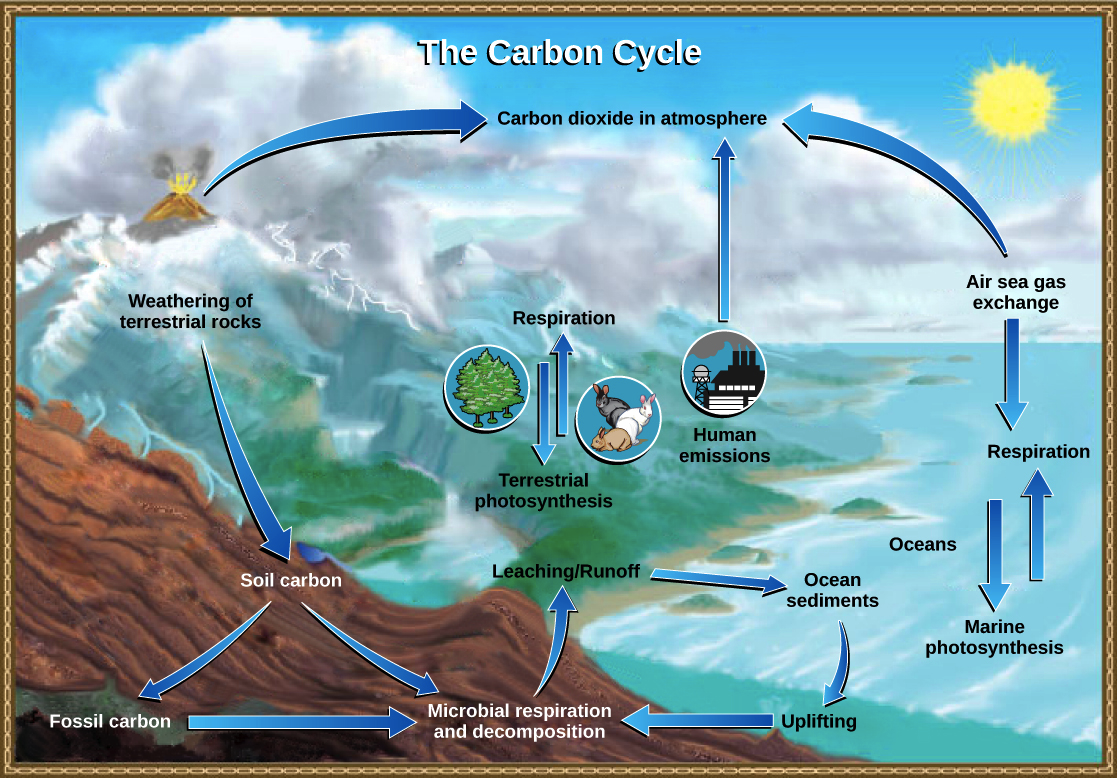
Photosynthesis is done by plants, algae, and phytoplankton. It is a CO2 sink that removes CO2 from the atmosphere and turns it into glucose.
Cellular Respiration is done by plants and animals and breaks down glucose. This releases CO2 into the atmosphere; it is a CO2 source.
Both of these processes balance each other out. There is no net increase in the atmosphere.
Carbon Cycle Steps in The Ocean & Atmosphere
Direct Exchange: CO2 moves directly between atmosphere & the ocean by dissolving into & out of ocean water at the surface. It happens very quickly & in equal directions, balancing levels of CO2 between atm. & ocean
Because of direct exchange, increasing atmosphere CO2 and ocean CO2, leading to ocean acidification
Algae and Phytoplankton: take CO2 out of the ocean & atm. through photosynthesis
Coral reef & marine org. with shells also take CO2 out of the ocean to make calcium carbonate
Sedimentation: when marine org. die, their bodies sink to ocean floor where they’re broken down into sediments that contain carbon
Burial: over, long, periods of time, pressure of water compresses C-containing sediments on ocean floor into sedimentary stone (limestone, sandstone) - long-term carbon reservoir
Burial, Extraction, & Combustion
— Burial: slow, geological process that stores C in underground sinks like sedimentary rock or fossil fuels
— Fossil Fuels (bits of rock, soil, organic matter) compressed into sed. rock, or FF, by pressure from overlying rock layers or water
— Extraction & Combustion: coal, oil, and natural gas is formed from fossilized remains of organic matter. Ex: dead ferns (coal) or marine algae & plankton (oil)
Burial (formation of FFs) takes far longer than extraction & combustion, which means they increase concentration of CO2 in the atmosphere.
1.5 - Nitrogen Cycle Overview
The nitrogen cycle is the movement of nitrogen containing molecules between sources & sinks. Sources release nitrogen into the atmosphere; sinks take nitrogen out of the atmosphere in increasing amounts.
Nitrogen reservoirs hold nitrogen for relatively short period of time compared to Carbon cycle.
Ex: plants, soil, and atmosphere
The atmosphere is the main nitrogen reservoir. Nitrogen in the atmosphere exists mostly as N2 gas, which is not usable by plants or animals. Nitrogen is the critical plant & animal nutrient. All living things need Nitrogen for DNA & amino acids to make proteins.
Steps:
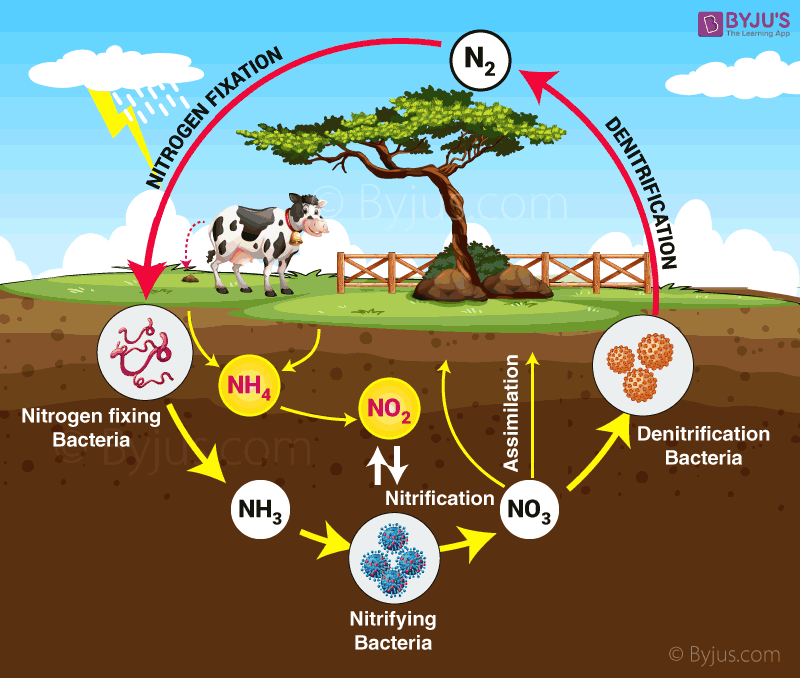
Nitrogen Fixation is the process of N2 gas being converted into biologically available (usable by plants) NH3 (ammonia) or NO3 (nitrate).
Bacterial fixation: This is a type of Nitrogen fixation. Certain bacteria that live in the soil, or in symbiotic relationship with plant roots convert N2 into ammonia (NH3)
Rhizobacteria live in root nodules of legumes (peas, beans) & fix nitrogen for them in return for amino acids from the plant
Synthetic Fixation: This is a type of Nitrogen Fixation. Humans combust fossil fuels to convert N2 gas into Nitrate (NO3). Nitrates are added to synthetic fertilizers like miracle grow & used in agriculture
Assimilation: plants & animals taking nitrogen in and incorporating it into their body
Plant roots take in NO2 or NH3 from soil; animals assimilate nitrogen by eating plants or other animals
Ammonification: soil bacteria, microbes & decomposers converting waste & biomass back into NH3 and returning it to soil
Nitrification: conversion of NH4 into Nitrite (NO2) & then Nitrate (NO3) by soil bacteria
Denitrification: conversion of soil nitrogen (NO3) into nitrous oxide (N2O) gas which returns to atmosphere
Human Impacts on the Nitrogen Cycle
Climate: N2O (nitrous oxide) is a greenhouse gas which warms earth’s climate. It is produced by denitrification of nitrate in agricultural soils (especially when waterlogged and over watered)
Ammonia Volatilization: excess fertilizer use can lead to NH3 gas entering atm. NH3 gas in the atmosphere leads to acid precipitation (rain) and respiratory irritations in humans & animals. It also means less Nitrogen stays in the soil for crops to use for growth (lost profit)
Leaching & Eutrophication: Synthetic fertilizer use leads to nitrates (NO3) leaching, or being carried out of soil by water. Nitrates runoff into local waters, causing algae blooms that block sun & kill other aq. Plants.
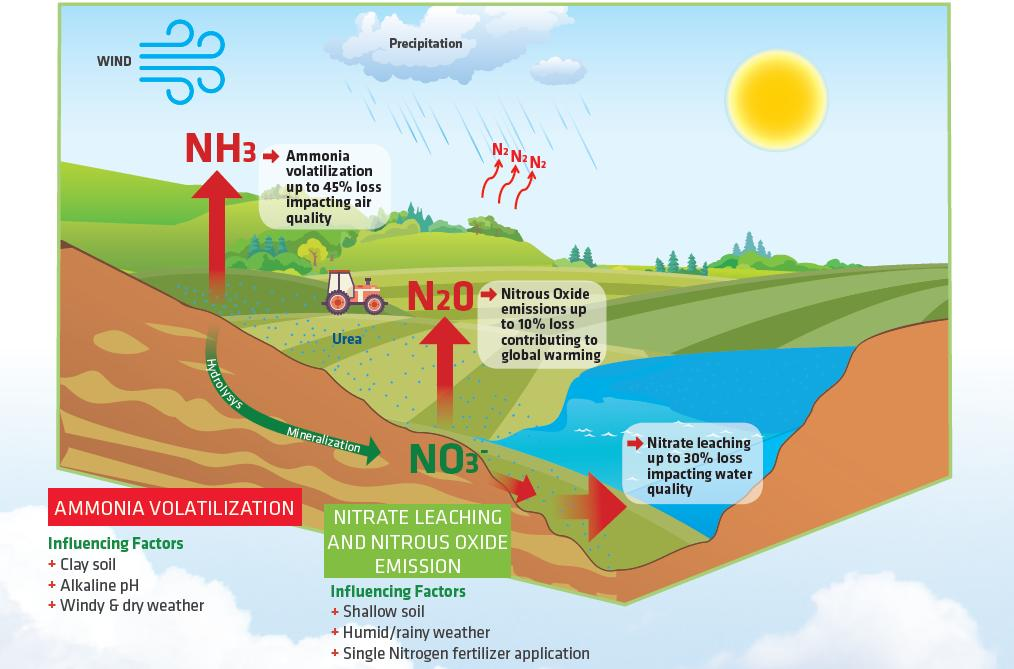
Climate Effects
N2O is a greenhouse gas which warms the earth.
Eutrophication can occur from leaching
Ammonia volatilization is when ammonia from fertilizers escapes into the atmosphere, which is toxic to humans
1.6 - Phosphorus Cycle Basics
The phosphorus cycle is the movement of phosphorus atoms & molecules between sources & sinks. Rocks and Sediments containing phosphorus minerals are major reservoirs.
The Phosphorus cycle is very slow compared to C/H2O/N cycles.
It takes a long time for phosphorus minerals to be weathered out of rocks out of rocks & carried into soil/bodies of water
There is no gas phase of phosphorus (doesn’t enter atmosphere)
Because it cycles so slowly, it is a limiting nutrient, meaning plant growth in ecosystems is often limited by phosphorus availability in soil/water
P is needed by all organisms for DNA, ATP (energy), bone & tooth enamel in some animals
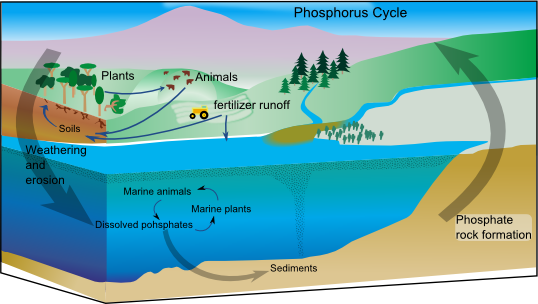
Phosphorus Sources
Major natural source of phosphorus is the weathering of rocks that contain P minerals.
Wind & rain break down rock & phosphate (PO3) is released and dissolves into water; wind and rain water carries phosphate into nearby soils & bodies of water
Weathering is so slow that P is often a limiting nutrient in aquatic and terrestrial ecosystems
Synthetic Phosphorus Sources
A synthetic (human) sources of phosphorus example is mining phosphate minerals & adding to products like synthetic fertilizer & cleaners/detergents
Synthetic fertilizers containing phosphates are added to lawns or agriculture fields; runoff carries P into nearby bodies of water
Phosphates from detergents & cleaners enter bodies of water via wastewater from homes
Assimilation & Excretion/Decomp.
Just like Nitrogen, Phosphate is absorbed by plant roots & assimilated into tissues; animals assimilate Phosphate by eating plants or other animals.
Animal waste, plant matter & other biomass is broken down by bacteria/decomposers that return phosphate to soil.
Assimilation & excretion/decomposition form a mini-loop within P cycle just like assimilation & ammonification in nitrogen cycle, photosynth & resp. in Carbon cycle
Sedimentation & Geo. Uplift
Phosphate doesn’t dissolve very well into water; much of it forms solid bits of phosphate that fall to the bottom as sediment (sedimentation)
P sediments can be compressed into sediment rock over long time periods by pressure of overlying water
Geological Uplift is the collision of tectonic plates forcing up rock layers that form mountains; P cycle can start over again with weathering & release of phosphate from rock
Eutrophication (too much N & P)
Eutrophication can occur from fertilizer runoff, human/animal waste contamination
Because phosphorus is a limiting nutrient in aquatic ecosystems, extra input of N & P lead to eutrophication (excess nutrients) which fuels algae growth
Algae bloom cover the surface of water, blocking sunlight & killing plants below surface
Algae eventually die-off; bacteria that break down dead algae use up O2 in the water (b/c decomp. = aerobic process)
Lower O2 levels (dissolved oxygen) in water kills aquatic animals, especially fish
1.7 - Water Cycle Overview
Movement of H2O (in different states) b/w sources & sinks. State of matter (solid/liquid/gas) as well as where water is moving are key in H2O cycle
Ex: precipitation = atmosphere (gas) → land or surface water (liquid)
Energy from the sun drives the H2O cycle
Ex: heat from the sun causes liquid water in the ocean to become a gas (evaporation) in atmosphere
The ocean is the largest water reservoir. Ice caps & groundwater are smaller reservoirs, but contain fresh, useable water for humans
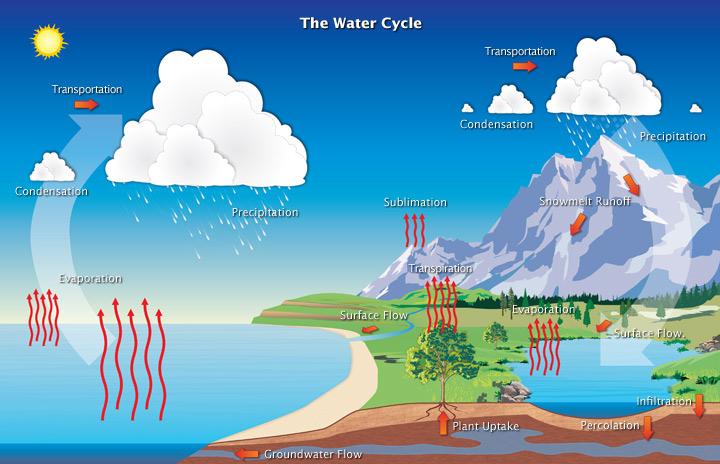
Evaporation & Evapotranspiration
Evaporation: 2 main source of water (processes that cycle it from liquid on earth back into the atmosphere)
Sometimes called “vaporization” since liquid water becomes water vapor (gas) in atm.
Transpiration: The process plants use to draw groundwater from from their roots up to their leaves
Leaf openings called stomata open, allowing water to evap. into atm. from leaf
Movement of H2O out of leaf creates low H2O potential in leaf, pulling H2O up from roots
Evapotranspiration: amount of H2O that enters atm. from transpiration & evap. combined.
Both processes are driven by energy from the sun
Runoff & Infiltration
Precipitation (rain) either flows over earth’s surface into a body of water (runoff) or trickles through soil down into groundwater aquifers (infiltration)
Groundwater (aquifers) & surface waters (lakes/rivers) are important freshwater reservoirs for humans & animals
Precipitation recharges groundwater through infiltration, but only if ground is permeable (able to let water pass through)
Runoff recharges surface waters, but can also carry pollutants into water sources
1.8 - Primary Productivity
Primary Productivity: rate that solar energy is converted into organic compounds via photosynthesis over a unit of time. Aka: rate of photosynthesis of all producers in an area over a given period of time. Since photosynthesis leads to growth, you can also think of PP as the amount of plant growth in an area over a given period of time
Units: kcal/m2/yr.
High PP = High plant growth = lots of food & shelter for animals.
Ecosystems with high PP are usually more biodiverse (more div. of species) than ecosystems with low PP
Respiration loss (RL): plants use up some of the energy they generate via photosynthesis by doing cellular respiration (movement, internal transportation, etc.). Think of respiration loss as taxes plants need to play.
Gross Primary Productivity (GPP): The total amount of sun energy (light) that plants capture and convert to energy (glucose) through photosynthesis. Think of GPP as the total paycheck amount the plant earns
NPP = GPP - RL
Net Primary Productivity (NPP): The amount of energy (biomass) leftover for consumers after plants have used some for respiration. Think of NPP as the actual amount of the plant’s paycheck it keeps after taxes
Ecological Efficiency: The portion of incoming solar energy that is captured by plants & converted into biomass (NPP or food available for consumers)
Generally, only 1% of all incoming sunlight is captured & converted into GPP via photosynthesis
Of that 1%, only about 40% (or .4% of total incoming solar energy) is converted into biomass/plant growth (NPP)
Some ecosystems are more efficient (higher NPP) than others
The more productive a biome is, the wider the diversity of animal life it can support (high. biodiv.)
***Try to predict the most & least productive terrestrial and aquatic biomes ***
Water availability, higher temperature temperature, and nutrient availability are all factors that lead to high NPP
Shortage of any of these three factors will lead to decreased NPP
Ex: Desert (low H2O & nutrients) Tundra (low temp & liquid H2O) Open ocean (low nutrients)
1.9 & 1.20 - Trophic Levels and The 10% Rule
Matter & energy are never created or destroyed; they only change forms
Ex: Tree dies & the C/N/H2O/P are returned to the soil & atmosphere. Ex: Sun rays (light energy) hit leaves & are converted into (chemical energy)
1st law of thermodynamics : energy is never created or destroyed
Biogeochem cycles demonstrate conservation of matter (C/N/H2O/P)
Food webs demonstrate conservation of energy
Ex: When a rabbit eats a leaf, the energy from the leaf (glucose) is transfered to the rabbit & stored as body tissue like fat/muscle
Each time energy is transferred, some of it is lost as heat
Applied to food webs: the amount of usable energy decreases as you move up the food chain (organisms use up most of it for movement, development, etc.)
Because *available* energy decreases with each step up the food chain, a trophic pyramid (troph = nourishment or growth) is used to model how energy moves through an ecosystem
10% Rule: in trophic pyramids, only about 10% of the energy from one level makes it to the melt level; the other 90% is used by the organism or lost as heat
Tertiary Consumers: animals that eat secondary consumers or carnivores & omnivores (aka - top/apex predators)
Secondary Consumers: animals that eat primary consumers or herbivores (aka - carnivores & omnivores)
Primary Consumers: animals that eat plants (herbivores)
Producers (plants): “produce”- really convert sun’s light energy into chemical energy (glucose)
10% rule also applies to biomass (or mass of all living things at each trophic level) Since energy is needed for growth & only 10% of energy transfers from one level to the next, only 10% of the biomass can be grown/supported.
To calculate biomass or energy available at the next level up, move the deck cal place to the left (or divide by 10)
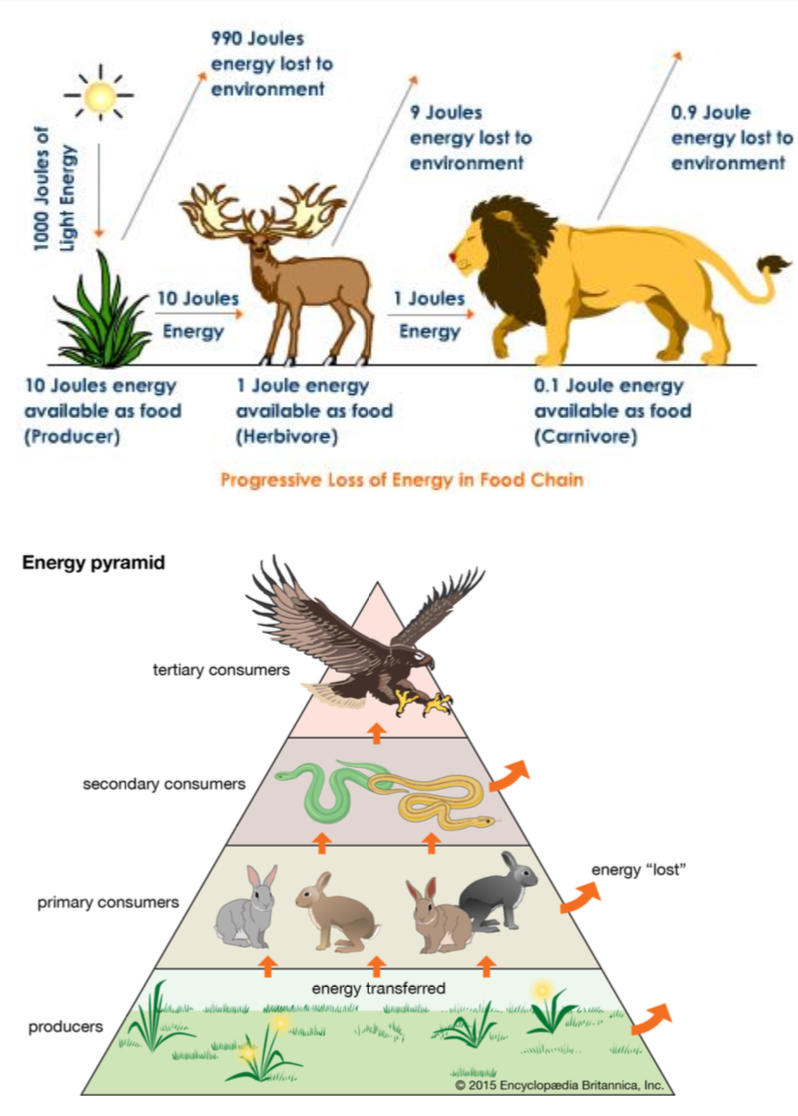
To calculate biomass or energy available at the next level up, move the deck cal place to the left (or divide by 10)
1.11 Food Chains & Food Webs
Food Web Basics
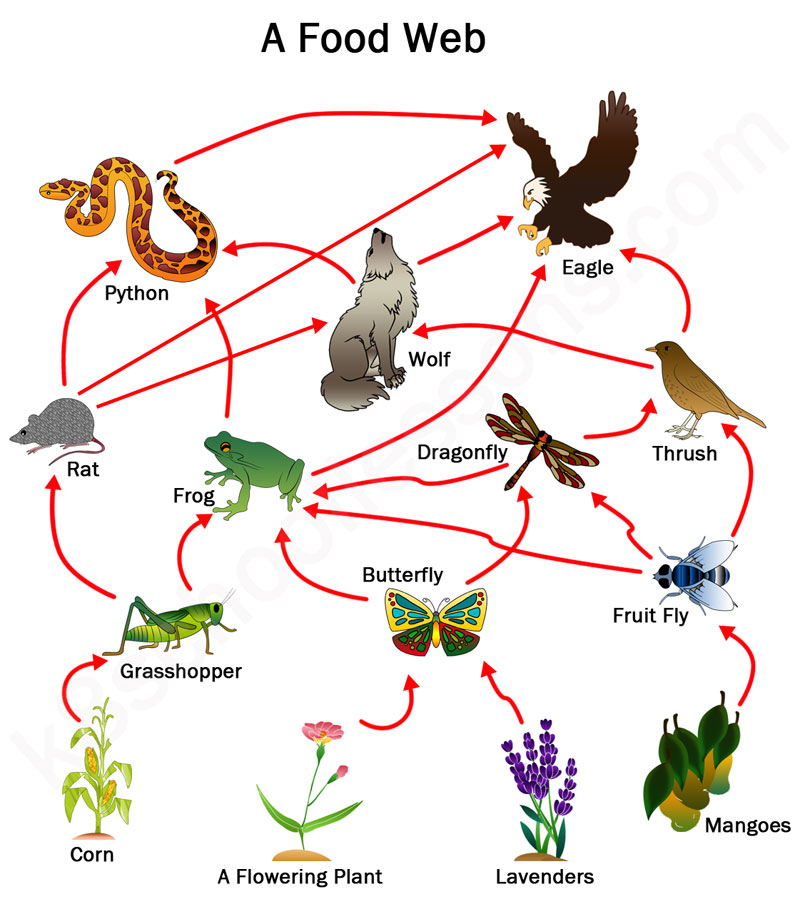
Shows how matter & energy flow through an ecosystem, from organism to organism. When one organism preys on (eats) another, the matter (C/N/H2O/P) and energy (glucose, muscle tissue, etc.) are passed on to the predatory
⛰️ Arrows in food webs indicate direction of energy flow (point to the org. taking in the energy)
Food Web vs. Chain
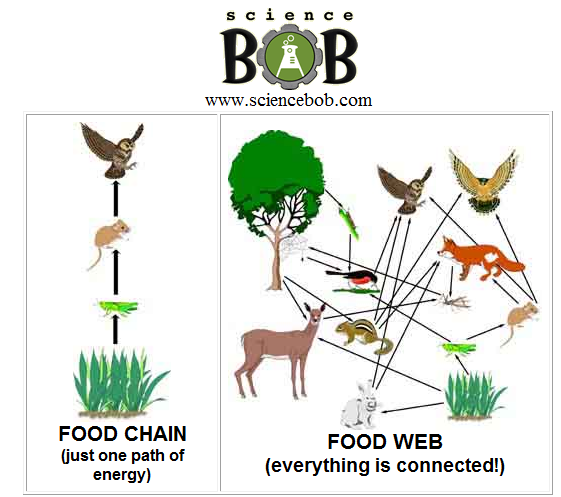
Food chains just show one linear path of energy & matter
Food webs have at least 2 different, interconnected food chains
Webs show that organisms can exist at different trophic levels
grass → hare → owl (sec. cons.)
grass → grasshopper → robin → owl (tert. cons.)
Interactions & Trophic Cascade
Food webs show how increase or decrease in population size of a given species impact the rest of the food web
Ex: Increase in python pop.
Decrease in frog & rat pops.
Increase in grasshopper pop.
Decrease in corn
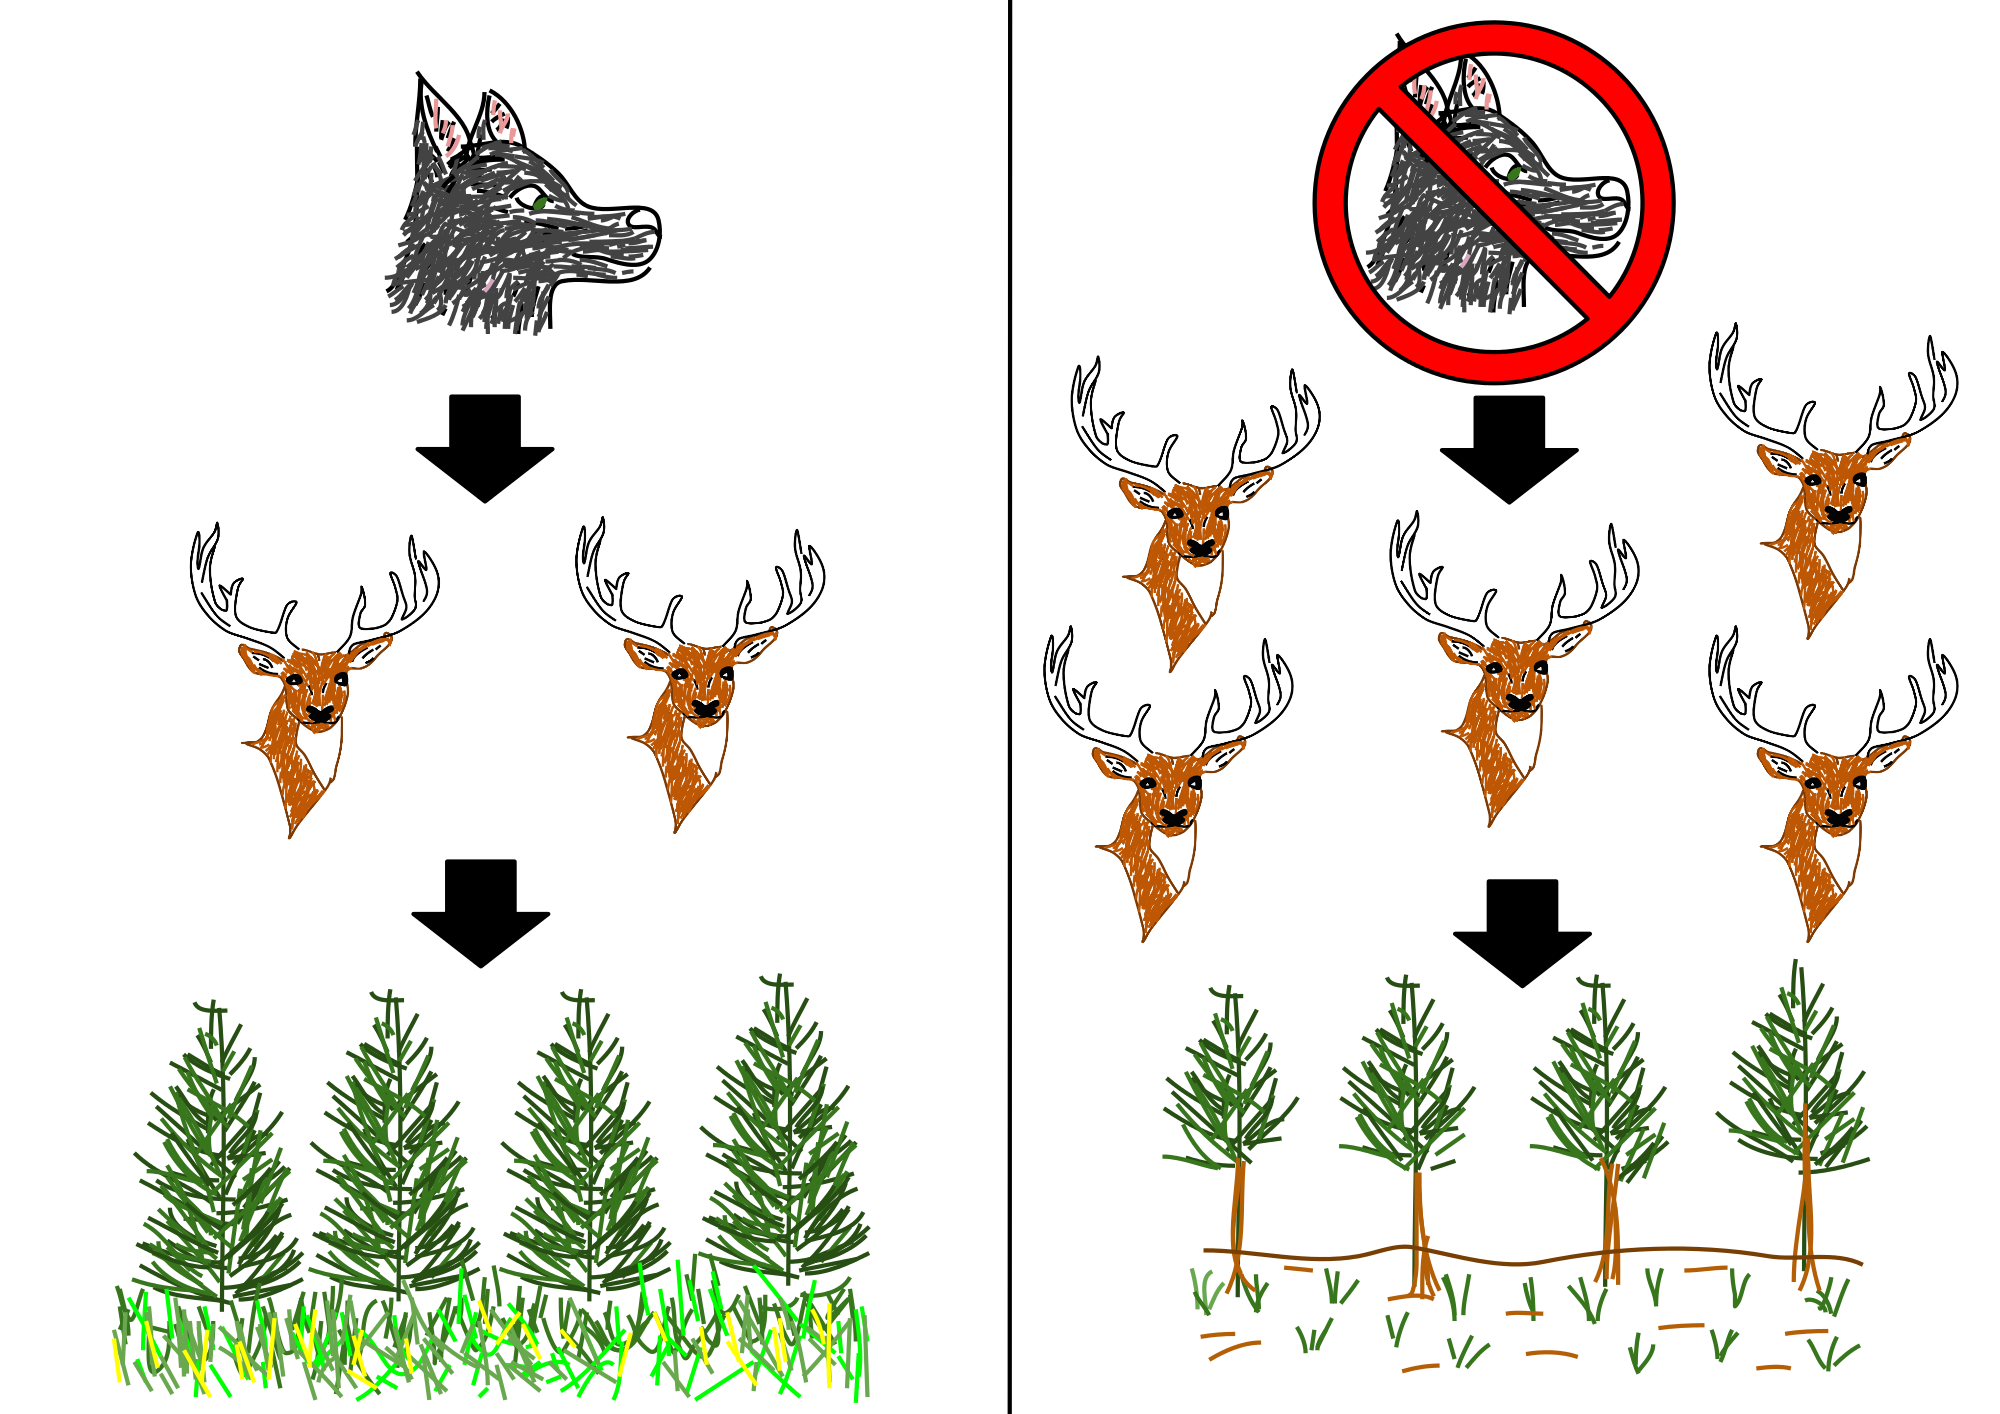
Trophies cascade: removal or addition of a top predator has a ripple effect through lower troph. Levels
Ex: decline in wolf pop. = increase in deer pop. which leads to overgrazing & decline in trees
