4.2 Area
Sigma Notation:
What is Σ? Σ “sigma” stands for sum
2 + 4 + 6 + 8 + 10 = [ _(i = 1)Σ^5 ] 2i
Examples:
- [ ᵢ₌₁Σ^6 ] i = 1 + 2 + 3 + 4 + 5 + 6
- [ ᵢ₌₁Σ^6 ] i + 1 = 1 + 2 + 3 + 4 + 5 + 6
- [ ᵢ₌₃)Σ^7 ] i^2 = 3^2 + 4^2 + 5^2 + 6^2 + 7^2
- [ ᵢ₌₁)Σ^5 ] (1/√i) = 1/√1 + 1/√2 + 1/√3 + 1/√4 + 1/√5
- [ ᵢ₌₁Σⁿ ] 1/n • (k^2 + 1) = 1/n • (1^2 + 1) + 1/n •(2^2 + 1) … 1/n • (n^2 + 1)
Formulas:
- Constant: [ᵢ₌₁Σⁿ ] ==c== = nc
- Just i: [ ᵢ₌₁Σⁿ ] ==i== = [ n( n+1 )] / 2
- i^2: [ ᵢ₌₁Σⁿ ] ==i^2== = [ n( n+1 )(2n + 1)] / 6
Properties (a is some function within i):
Constant: [ ᵢ₌₁Σⁿ ] ==k== • a = ==k== • [ ᵢ₌₁Σⁿ ] a
- Ex: [ ᵢ₌₁Σ^6 ] 3i = 3 • [ ᵢ₌₁Σ^6 ] i
Sub/Difference: [ ᵢ₌₁Σⁿ ] ==a== +- ==b== = [ ᵢ₌₁Σⁿ ] ==a== +- [ ᵢ₌₁Σⁿ ] ==b==
- Ex: [ ᵢ₌₁Σ^4 ] (i + i^2) = [ ᵢ₌₁Σ^4 ] i +- [ ᵢ₌₁Σ^4 ] i^2
The Area of a Plane Region:

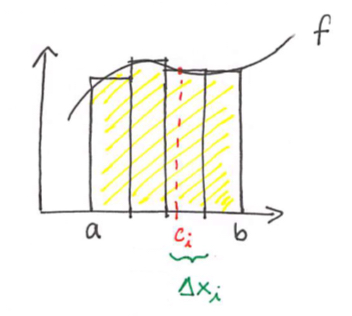
Area ~ [ ᵢ₌₁Σⁿ ] rectangles
= [ ᵢ₌₁Σⁿ ] height • width
= [ ᵢ₌₁Σⁿ ] f(c) • ∆x
—> f(ci) is the sampling position in subinterval “i” (red dashed line on graph)
—> ∆x is the width of the subinterval “i” (different rectangles on the graph’s width)
Use rectangles to approximate the area bound by:
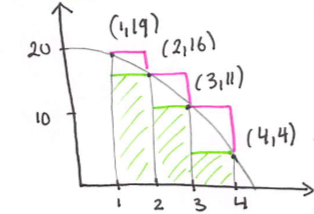
f(x) = -x^2 + 20, x = 1, x = 4, y = 0
4 - 1 = 3 so use 3 rectangles of equal width (1).

%%3 Inscribed rectangles (lower sum):%%
Area ~ 1•16 + 1•11 + 1•4 = 31
==R Circumscribed rectangles (upper sum):==
Area ~ 1•19 + 1•16 + 1•11 = 46
Since 3 rectangles in somewhat inaccurate, try using 100 rectangles:
Width of each rectangle: ∆x = (4-1)/100 = 3/100
Right end of subinterval:
- C₁ = 1 + 3/100 • 1
- C₂ = 1 + 3/100 • 2
- C₃ = 1 + 3/100 • 3
- i = Ci = 1 + 3/100 • i
Area ~ [ ᵢ₌₁Σ^100 ] f(ci) * ∆x
= [ ᵢ₌₁Σ^100 ] [ -(1 + 3/100 • i)^2 + 20 ] • 3/100
n rectangles:
∆x = 3/n, ci = 1 + 3/n • i
Area = [ ᵢ₌₁Σⁿ ] (- (1 + 3/n • i)^2 + 20) • 3/n
Finding Area by the Limit Definition
f continuous and non-negative on [ a,b ]
A = _(n → ∞ )lim [ ᵢ₌₁Σⁿ ] f(c) • ∆x, as long as the width of the subintervals approaches 0
Definite Integral:
f must be continuous and non-negative
ₐ∫ᵇ f(x)dx = ₋(n → ∞ )lim [ ᵢ₌₁Σⁿ ] f(cᵢ) • ∆x
^^∆x = (b-a)/n^^
^^cᵢ = a + (b-a)/n • i^^
→ ==ₐ∫ᵇ f(x)dx = ₋(n → ∞ )lim [ ᵢ₌₁Σⁿ ] f( a + (b-a)/n • i) • (b-a)/n==