4. Adsorption
Surface tension

Surface pressure- It shows how much does the surface tension decrease
γ = surface tension [mN/m or mJ/m2]
γ0 = initial surface tension [mN/m or mJ/m2]
Π=surface pressure [mN/m or mJ/m2]
Adsorption- Molecules adhere to a surface. Adsorption is the formation of surface layer.
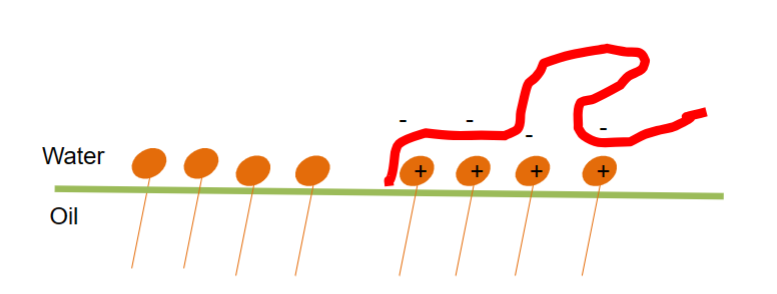
• Molecules with affinity for a surface
– Hydrophobicity
– Opposite charge
Different surface properties:

Different types of affinity can lead to adsorption
Simple adsorption experiment (serum depletion)
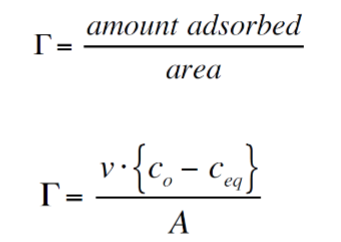
v=Volume of sample (m3)
c0=inital concentration of particle (kg/m3)
ceq= equilibrium concentration of particle (kg/m3)
A=Total surface area of particles (m2)
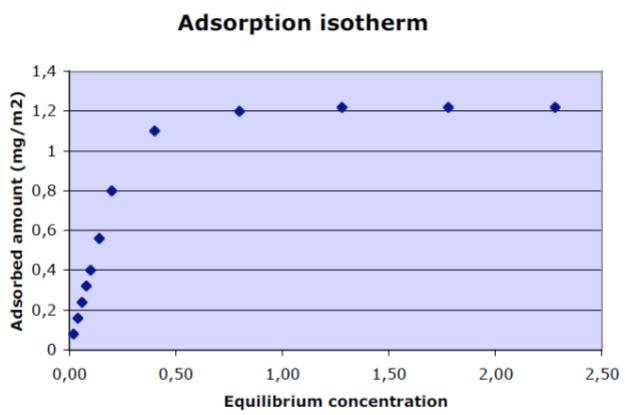
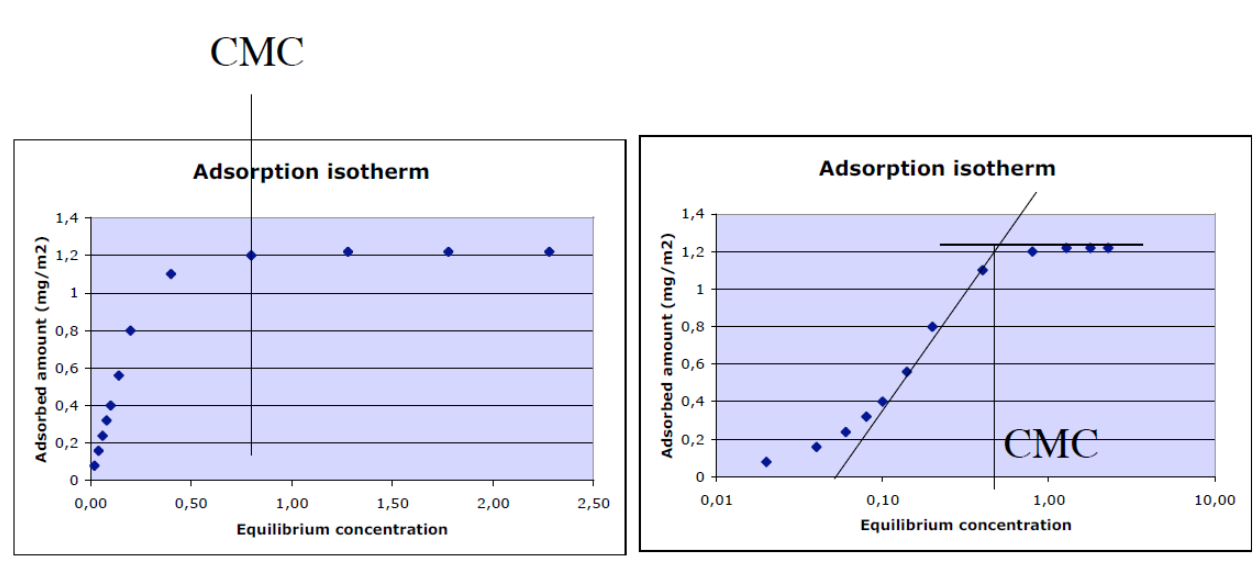
Adsorption isotherm- Relationship between adsorbed amount and equilibrium concentration of absorbate in surrounding fluid at constant temperature. Usually logarithmic scale
Adsorbed amount
• It is useful to express the adsorbed amount in mg/m2
– A completely covered surface by a monolayer of surfactant is typically ≈ 1-2 mg/m2
– A completely covered surface by a monolayer of protein or polymer is typically ≈ 1-5 mg/m2
• For macromolecules adsorbed amounts can be higher
– Higher adsorbed amounts can indicate multilayer adsorption
Gibbs’ adsorption isotherm- It assumes equilibrium
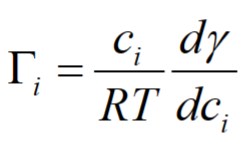
ci= concentration [kg/m3]
R=Gas constant=8.3145 J/K⋅mol
T=temperature [K]
γ = surface tension [mN/m or mJ/m2]
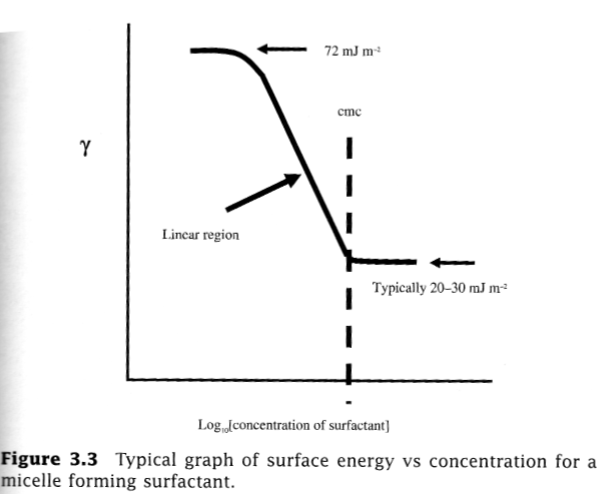
Adsorption from micellar solutions- The critical micellar concentration (cmc) can be determined from a logarithmic adsorption isotherm diagram.
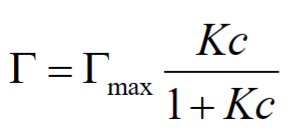
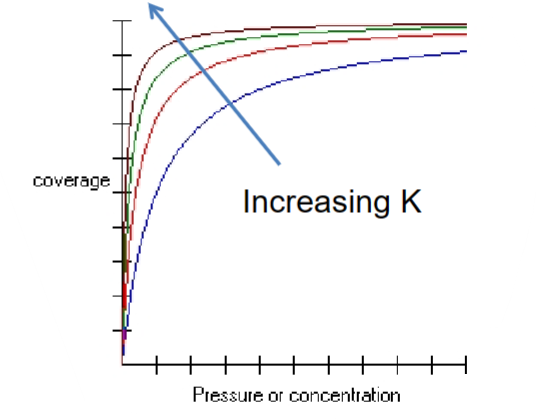
The Langmuir isotherm- Langmuir isotherm assumes:
– Reversible adsorption
– Equilibrium i.e. rate of adsorption=rate of desorption
– Homogenous surface
– Monolayer formation
• Conceptually attractive.
• Accommodates many situations even though the underlying assumptions do not strictly apply.
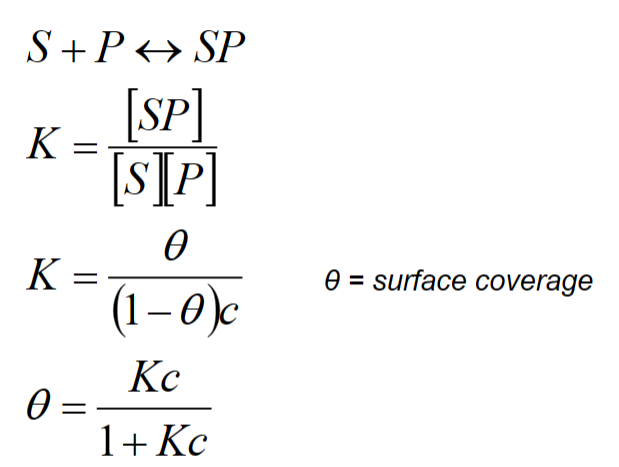
at low concentrations: θ → Kc
at high concentrations or high surfaces affinities: θ → 1
Properties of adsorbed macromolecules
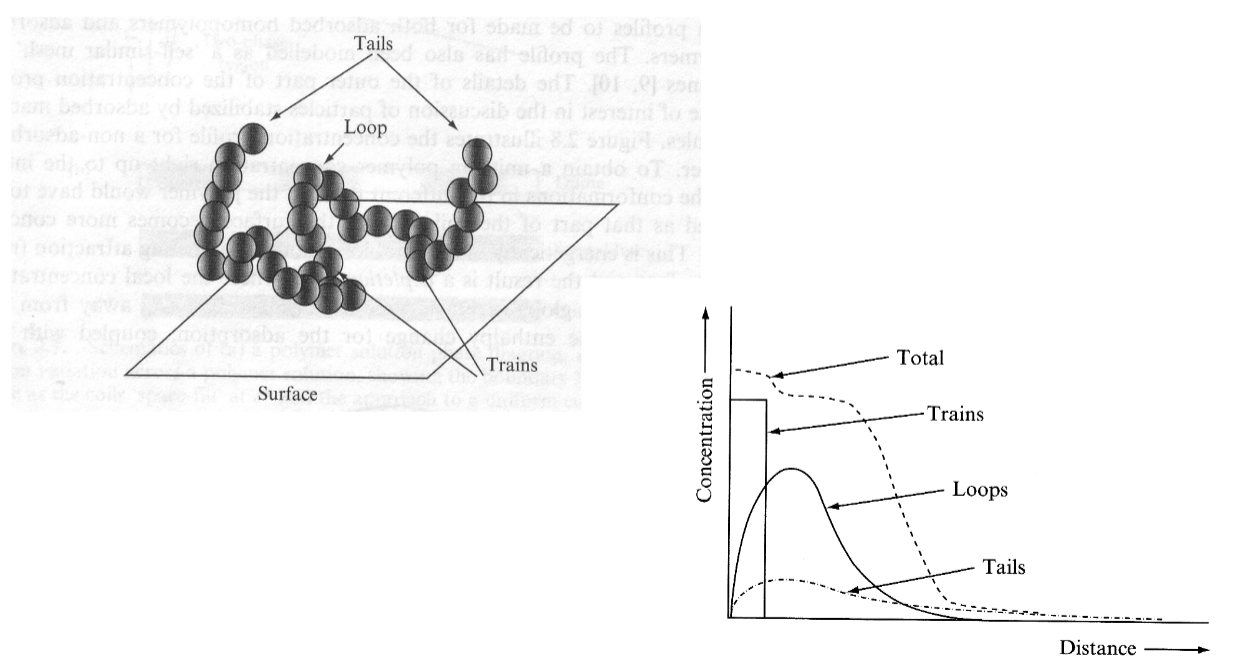
Trains are straight lines that lay flat on the surface.
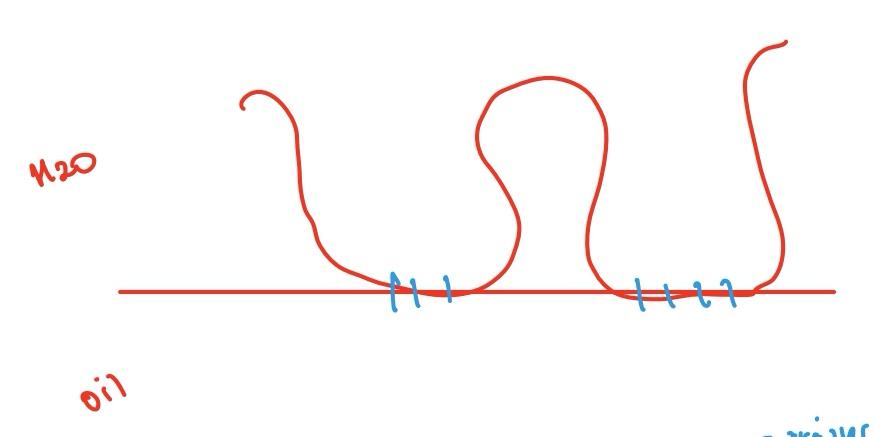
Contact point where we have monomers with affinity for interphase
Distance in the graph is the distance as it moves away from the interphase
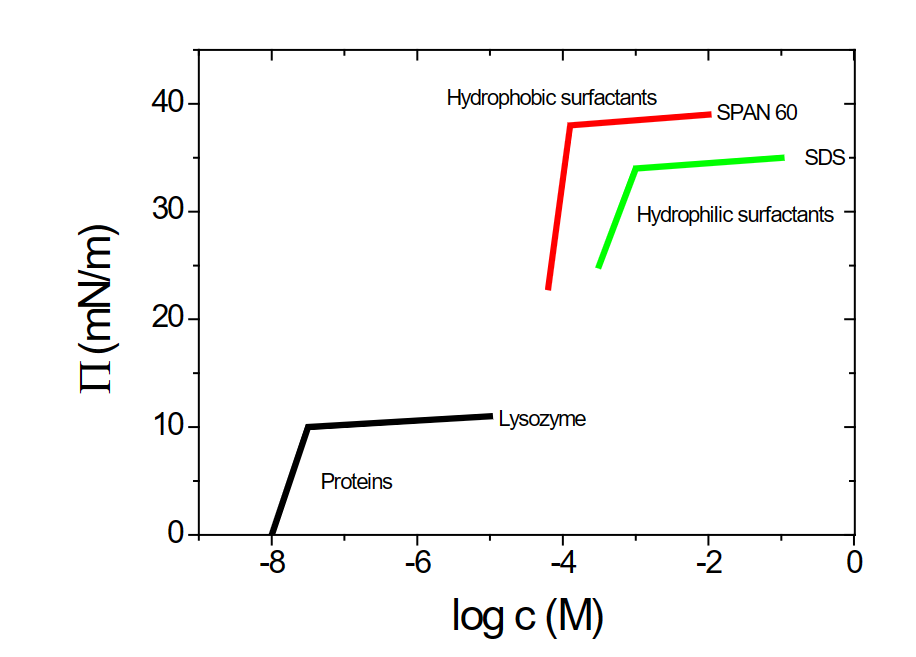
Surface pressure from different molecules at hydrophobic surfaces
The slope reflects affinity
SDS:
- packed less closely due to charge repulsion
SPAN 60:
- packed more closely due to its non-ionic nature
- plateau has a higher surface pressure
- has higher affinity → hydrophobic rather go to the interface
Proteins:
- Lower plateau → fewer molecules on interphase due to larger molecules
- Proteins are larger and consist of amino acids, have several hydrophobic parts in one molecule
Protein adsorption
• Practically all proteins are surface active.
– Hydrophobic/Hydrophilic amino acids.
• Adsorption can cause unfolding and denaturation at surfaces.
Kinetics often determines the outcome of macromolecular adsorption processes
• Example: albumin
• Surface pressure can change slowly
- unfolding at surface
• Adsorbed amount can depend on the rate of adsorption
- i.e. concentration of diffusion controlled adsorption
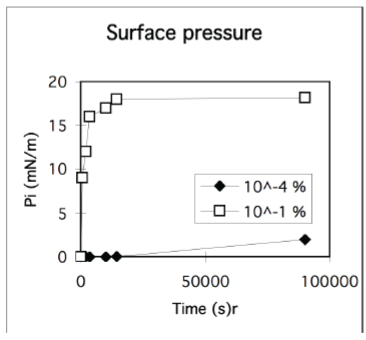
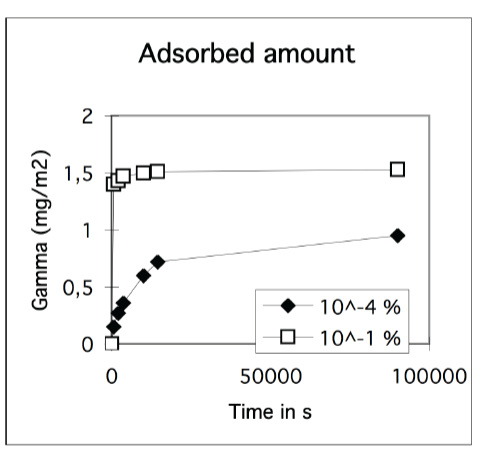
Rapid adsorption and jamming
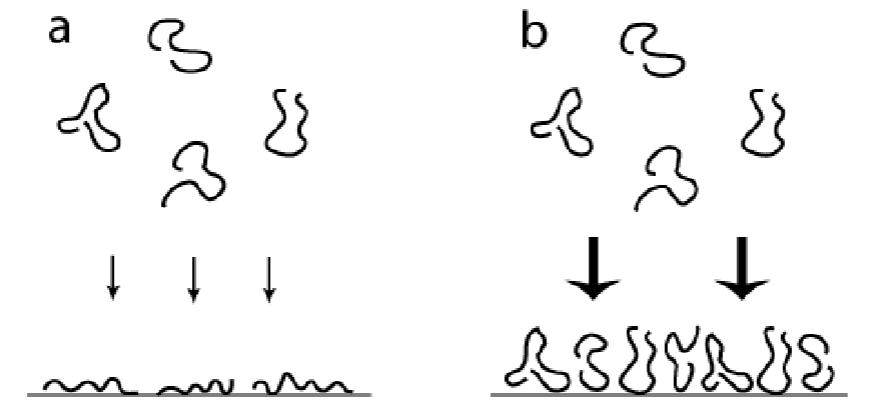
Insufficient time can be available for optimization of conformation of macromolecules at the surface.
Adsorption from mixtures
Competetive adsorption- One surface active species is displaced by another
Associative adsorption- Both species adsorb and form a mixed layer at the interface

Multi-layer adsorption- One species form a second layer on top of the first layer. Commonly seen with opposite charges.
Is adsorption reversible?
• Depends on:
– Adsorption energy.
– Entropy of mixing.
• Large molecules.
– High adsorption energies.
– Relatively low gain in entropy upon desorption.
– Can be irreversible.
• Protein adsorption at hydrophobic surfaces is practically irreversible, although displacement can occur.
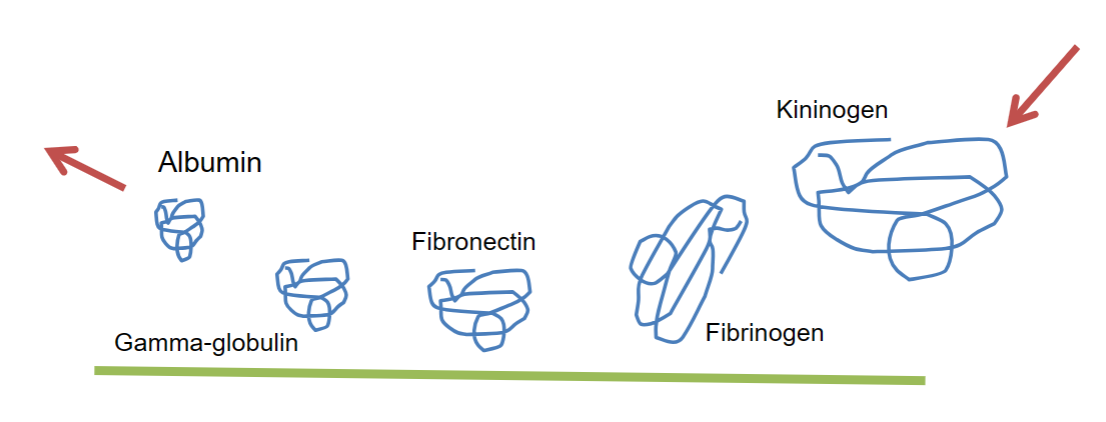
Vroman effect- describes the process of competitive protein adsorption to a surface by blood serum proteins
• Sequential adsorption and displacement of blood proteins at glass surfaces.
Albumin is smaller so diffusional transport is more rapid
Gamma-globulin diffuses slower, but it is larger and has a higher affinity
Fibrinogen and kininogen are present in much lower concentrations
