GEOM 2 (Jan 13th)
Typed
Spatial Data
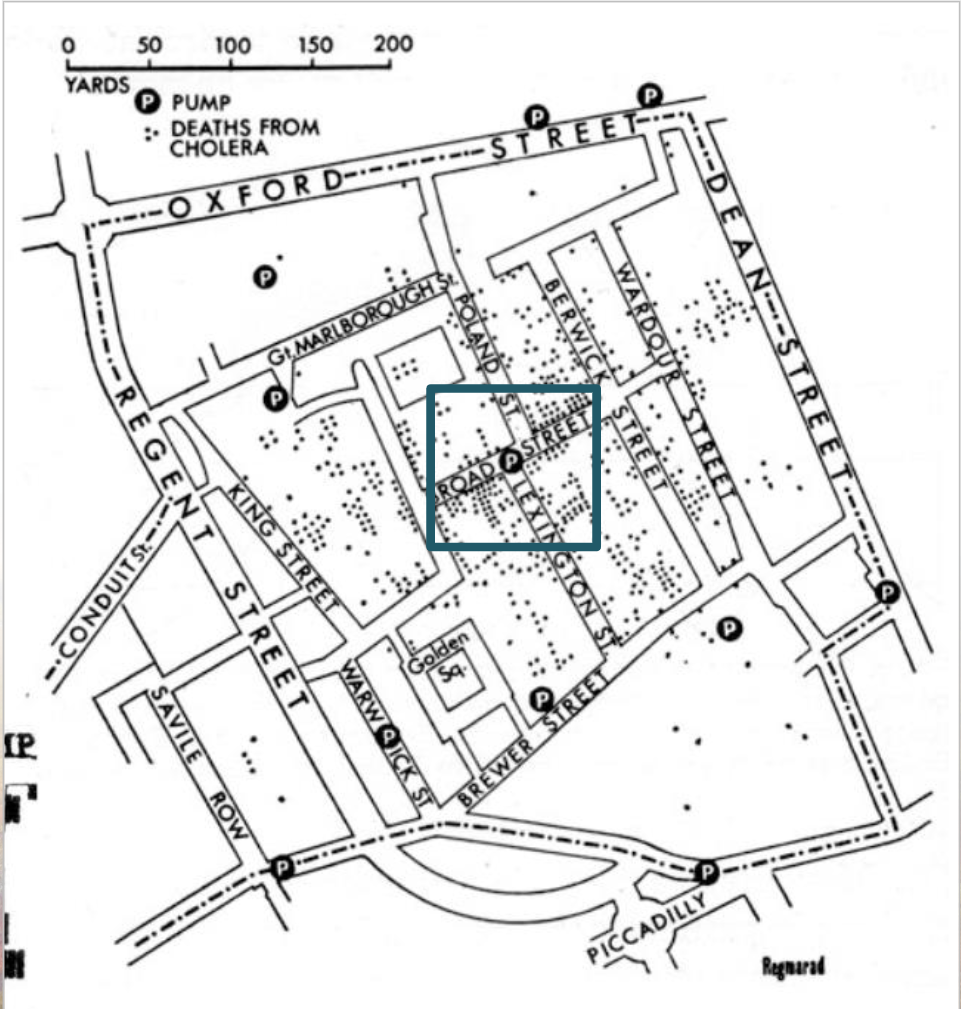
The P represents water pumps available in London
The Dots represent cholera deaths
This image represents early spatial data/spatial analysis
When
John Snow mapped the disease outbreak and the location of public water pumps, “he was able to show that cholera deaths had clustered around the Broad Street pump,supporting his earlier hypothesis that the organism (not yet detected) was transmitted by water” (Frerichs 2001, p. 3).Spatial analysis
The representation of cases on the map can be identified as clustering around the central well
Detention of Spatial Data:
“The process of examining the locations, attributes, and relationships of features in spatial data through overlay and other analytical techniques in order to address a question or gain useful knowledge.
Spatial analysis extracts or creates new information from spatial data”.
Frequently asked spatial questions:
What geographic features are connected?
What geographic features are adjactent or contiguous to each other
Key Concepts
Location and Distance
All of geomatics is related to location
It is a Communicating location
Nominal (Toponym name of a place or location)
The title of a location.
Relative (Half way between Regina and Saskatoon)
Expressing a location halfway between features.
Absolute (Coordinates of location)
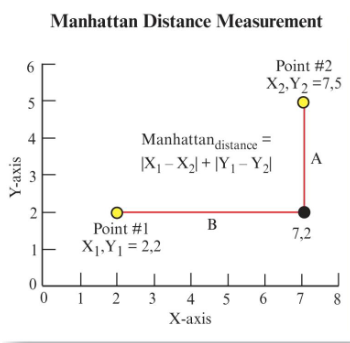
Distance: typicly an absolute measur as in strait line distance between two points
Euclidian Distance, uses the following formula: Distance = Square-root ((Y2-Y1)² X2-X1)²), which calculates the straight-line distance between two points in a Cartesian coordinate system.
Manhattan Distance
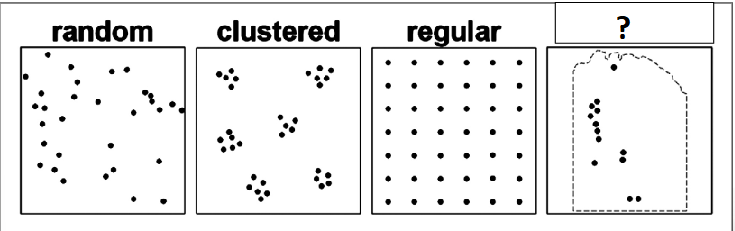
Spatial Distribution
Spatial Patterns COnsitst of:
Random
Clustered
Regular
Normal
Spatial Connectivity, what is connect to what and where, for example think of an air port and how the planes are connected via air ports and why? (Flights)
Scale
Nominal scales vs cartographic (or map) scale
Nominal scales of analysis:
Local (Ottawa)
Regional (Ontario)
National (Canada)
International (North America)
Global (Earth)
Universal (Milky Way)
Cartographic:
Map scale is the ratio of the distance on the map of distance to the earth
The larger the scale, the more detail is represented, while smaller scales provide a broader overview.
For example 1:50,000, this can be in CM which is 1 cm on the map is 50,000 cm in actuality or 0.5 km in real distance, illustrating how map scale affects spatial representation.
Spatial Data
Spatial data represents the geographic phenomena and have explicit locational information associated with them
There are 2 types of spatial data
Discrete
Continuous
Spatial Data typically also have attribute data associated with them
Discrete spatial data refers to data that can be counted and is often represented in distinct units, such as the number of trees in a forest or the locations of schools in a city. Which are often represent by Dots and lines (aka ARCs). Areas are represented with polygons, like buildings properties.
Changes overtime will be marked overtime throughout multiple maps and interpretations.
Continuous:
Represented by contour lines on a topographic map. These represent slope & Relief
As well they can represent non geographic area, Temperature and Precipitation data.
KAI
Introduction to DAPM
DAPM stands for Dynamic Adaptable Planetary Models, which are used to represent Earth in various contexts for further analysis and modeling.
Different types of DAPM have been developed, which will be explored further.
Course Overview and Organization
The course is divided into writing space, organized into several blocks over the term. Each block aligns with a specific week of the course.
Resources provided include office hours, textbooks, family assistance for labs, and access to necessary software (RK Pro).
Content for each week is released the Saturday prior to its start, providing a clear schedule for students to follow.
Current Week Content
Week 2 Overview: Students have lectures, a lab, and are expected to submit Lab 1 today.
Lab instructions are available, detailing the process required for mapping communities and population changes. Key guidelines and data necessary for completion are also provided in the course materials.
Emphasis on the importance of understanding how to produce a good map, supported by a checklist that outlines minimal requirements for map production.
Lab Expectations and Class Participation
The last session was intended to familiarize students with the participation app, for which instructions were provided.
Technical difficulties may arise; students should report any issues related to account setup or participation after class.
Class-related questions will impact participation marks starting from next week; today’s class serves primarily as a demonstration.
Introduction to Spatial Analysis
The concept of spatial analysis is introduced with examples, including historical maps such as the cholera outbreak in London.
Observations of spatial data are made through layering and displaying various data sets, such as cholera cases versus water pump locations.
The map by John Snow is highlighted as a significant example of how spatial analysis can inform public health decisions.
Key Concepts in Spatial Analysis
Definitions of Spatial Analysis: Includes examining geographical features, their relationships, and how they create specific patterns. Important terms include:
Overlay: Technique used to display multiple data layers on a map (e.g., streets overlaid with cholera cases).
Clustering: Understanding spatial patterns indicates high concentrations of events or features, which can lead to significant conclusions, as demonstrated with the cholera outbreak data.
Location and Distance
Various ways to express location include nominal, relative, and absolute terms. Examples:
Nominal: Referring to a city without precise coordinates.
Relative: Describing distances in relation to known landmarks.
Absolute: Using precise geo-coordinates for location representation.
Measuring Distance: Manhattan versus Euclidean
Manhattan Distance: Discussed in the context of navigating around obstacles in an urban setting. It involves movement along a grid, reflecting the real paths one might take amidst buildings.
Formula for calculating Manhattan distance emphasizes the importance of absolute values to ensure all distances are considered positively.
Understanding Spatial Patterns
Introduces the notion that spatial observations can yield three main patterns: random, clustered, and regular arrangements.
Practical example using Google search data illustrates how terms like "zombie" reveal clustered search behavior in English-speaking regions, raising questions about cultural associations and language.
Limitations in Data and Further Inquiry
Data limitations must be approached thoughtfully, considering its adequacy, collection methods, and potential biases in interpretation.
Reflect on the importance of context when interpreting spatial data, including demographic characteristics of the targeted subjects.
Conclusion of Session
The session wraps up by summarizing the significance of spatial analysis in interpreting data and making informed decisions.
Students are encouraged to critically evaluate the integrity and utility of data they engage with throughout the course.
Questions and Discussion
A Q&A session at the end allows students to clarify points related to spatial analysis, DAPM, and the course structure.
Break is provided before resuming further discussions.