11.14
Life tables summarize the probability that an individual will survive and reproduce over the course of its lifetime.
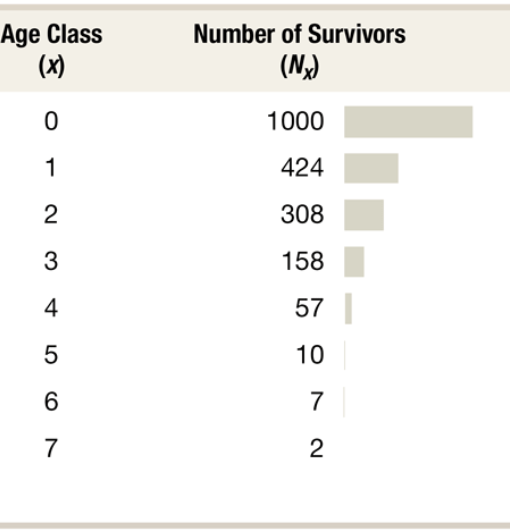
Survivorship: the proportion of offspring that survive, on average, to a particular age.
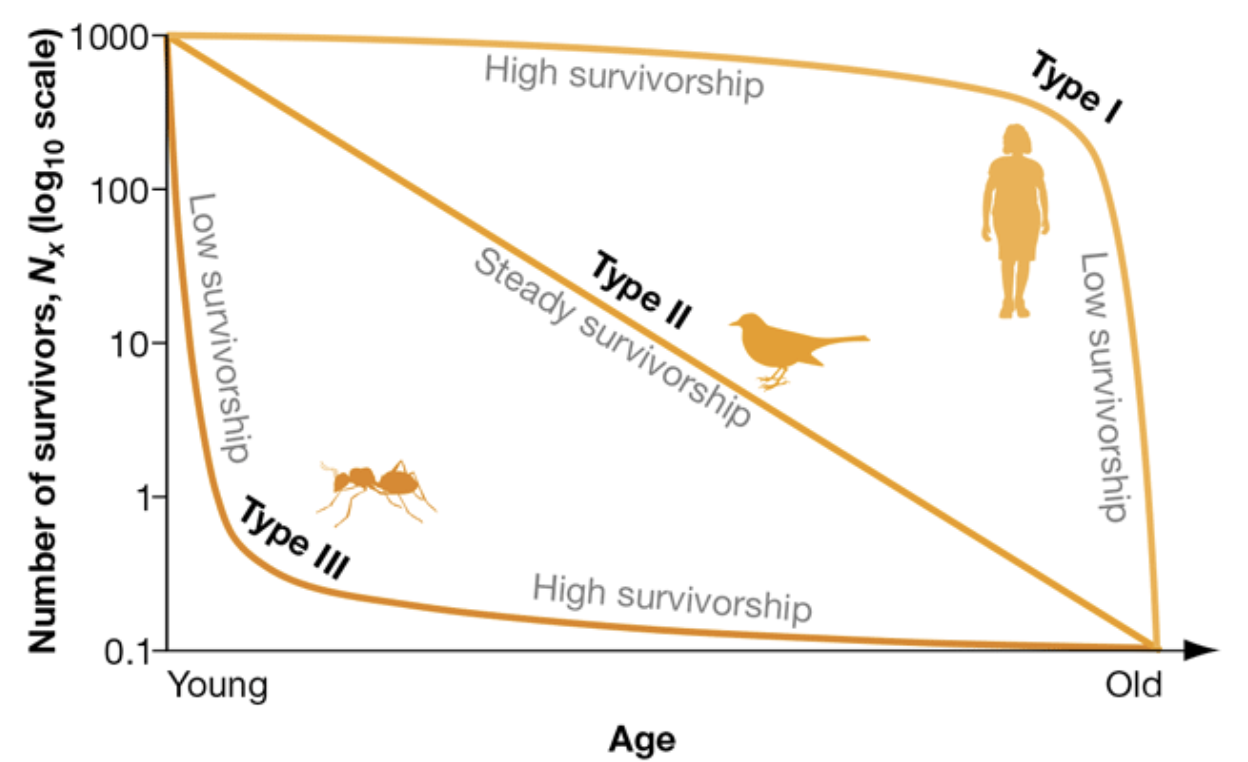
Type I: High survivorship as youngs and low survivorship as olds. Humans
Type II: Steady survivorship. Birts
Type III: Low survivorship as young, high survivorship as old. Ants
Fecundity: the number of female offspring produced by each female in the population
Net reproductive rate: RO. When it’s one, the population is not growing. Indicates whether the population is increasing or decreasing.
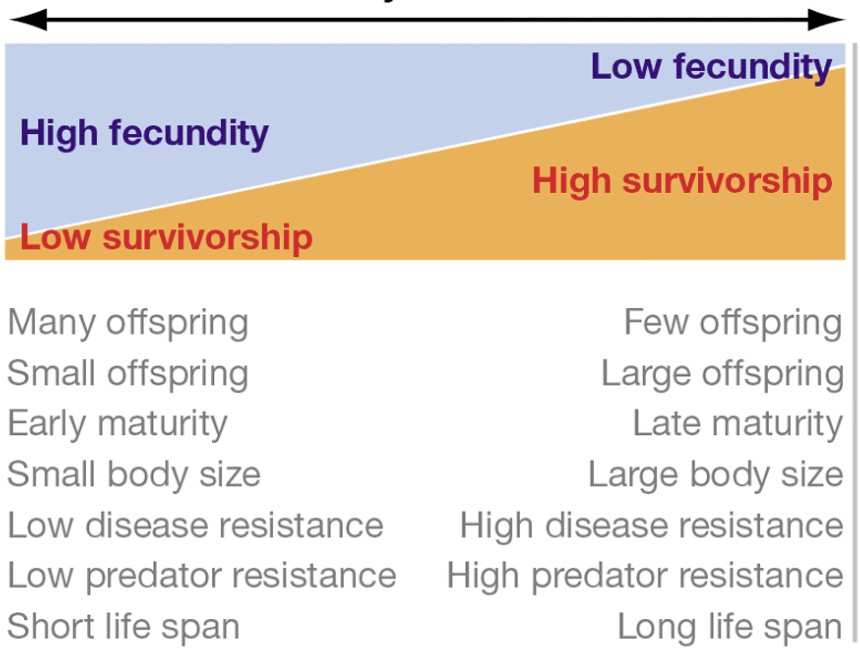
Fitness Trade-Offs
Austrian common lizards have low fecundity and high survivorship, French common lizards have high fecundity and low survivorship. Austria has fewer and larger offspring, France has more and smaller offspring.
You can’t be good at everything
The low fecundity and high survivorship (Austrian) animals have higher resistance to diseases and predators
Change in population size = Births + Immigrants - Deaths - Emigrants
change in population size / change in time = birth rate - death rate
The difference between the birth rate and the death rate is called the per capita rate of increase ( r ). If r is zero, the population isn’t changing.
r = b - d
Exponential population growth: if no immigration or emigration is occurring then:
Change in population size / change in time = dN / dt = rN
Exponential population growth is density independent
As the value of r increases, the exponential growth curve gets steeper (dN/dt = 1.0N > 0.5N)
Can be seen during colonization of a new habitat/recovery after a disaster
Ultimately, there is a limit to the number of individuals that can occupy a habitat.
Carrying capacity (K): maximum population size that a particular environment can sustain
Logistic population growth: adds K.
dN/dt = rN x (K-N) / K
K-N is the number of additional individuals the environment can support
The whole thing (K-N) / K is the fraction still available for population growth
Logistic population growth is density dependent
Graphs as an S shaped curve
Initially growth is exponential, as resources are abundant. At carrying capacity, growth is 0, and the graph is flat
What density dependent factors limit population size?
Competition for resources (food, water, territory, light, nesting sites, nutrients, oxygen)
Disease and parasitism
Predation
Toxic wastes (ammonia, uric acid, alcohol, carbon dioxide)
Social behavior (stress mediated behavior, dominance and mating behavior)