Week 12 - Financial Ratio
Understanding Financial Statements & Ratios
Monitoring company performance relies on information in financial statements.
Shareholders and stakeholders scrutinize financial statements by calculating key financial ratios.
Value is measured through:
Value added
Profitability
Efficiency
Value also depends on:
Financing (leverage)
Liquidity
Financial Ratios Organizational Chart
Financial ratios relate to shareholder value through:
Investment (profitability):
Economic Value Added (EVA)
Returns on capital, assets and equity
Financing
Sustainable growth rate
Debt ratios
Interest coverage ratios
Current, quick and cash ratios
Efficient Use of Assets
Turnover ratios for assets, inventory and receivables
Operating profit margin
Financial Statements: Balance Sheet & Income Statement
Balance Sheet
Shows assets and liabilities at the end of the reporting period.
Assets are listed in declining order of liquidity (cash & current assets first, long-term illiquid assets last).
Liabilities are listed according to when they are due (earliest first).
Income Statement
Shows total profitability of a company over a given year.
Broken down into components (e.g. revenue, COGS, depreciation, interest, taxation, etc.).
Balance Sheet Details
Assets are listed in declining order of liquidity.
Current assets include inventories of raw materials, work in process, and finished goods.
Current liabilities include debts due to be repaid and payables.
Net working capital (or net current assets) is the difference between current assets and liabilities.
Example: Net working capital = 10,890 - 14,243 = -$3,353
Income Statement Details
Example: EBIT = $122,286 - 117,386 - 2,649 + 333 = $2,584 million.
Kroger Co. paid out million as dividends.
reinvested into the business.
Accounting Metrics: Book vs. Market Values
Market Capitalization
Total market value of equity.
Calculated as share price times number of shares outstanding.
Example: Kroger's market capitalization = 788
ewline imes $27.55 = $21,709 million.
Book Value of Equity
Shareholders’ cumulative investment in the company.
Example: Kroger’s book value of equity was million at fiscal year-end 2019.
Market Value Added (MVA)
Difference between the market value of the firm’s shares (Market Capitalization) and the amount of money that shareholders have invested in the firm.
Measuring Performance: Market Value Added (MVA)
MVA = Market Capitalization - Book Value of Equity
Example: MVA = $21,709 - $8,573 = $13,136 million.
Market-to-Book-Ratio
How much value has been added for each dollar that shareholders have invested.
Example: Kroger’s market-to-book ratio =
Limitations of Market Value Performance Measures
Reflects investors’ expectations about future performance (noisy measures).
Cannot discern reasons for the performance (manager competence, extraneous events, investor sentiment).
Cannot look up the market value of privately owned companies or divisions of larger companies; need accounting measures of profitability.
Economic Value Added (EVA)
Measures whether a firm has earned a profit after deducting all costs, including its cost of capital.
Net income after deducting the dollar return required by investors is called residual income or economic value added (EVA).
after-tax interest + net income = company’s net operating profit after tax, or NOPAT
Kroger 2019 EVA Example
After-tax interest + net income = (1 - 0.21) \times 603 + 1,512 = $1,988 million.
Total capital = million.
Kroger’s WACC = 5.5% --> total cost of capital = 0.055 \times $19,907 = $1,095 million.
EVA = ($1,988 - $1,095) = $893 (million).
Accounting Rates of Return
EVA measures how many dollars a business is earning after deducting the cost of capital --> the more assets, the greater the opportunity to generate a large EVA.
Helpful when comparing managers’ performance to measure the firm’s return per dollar of investment.
Three common return measures:
Return on capital (ROC)
Return on assets (ROA)
Return on equity (ROE)
All are based on accounting information and are therefore known as book rates of return.
Accounting Rates of Return Details
Want ROC > After-tax WACC.
Return on Assets (ROA) = Income generated (for both Debt & Equity investors) per dollar of firm’s total assets
Return on Equity (ROE) = Income to shareholders per dollar invested (aim: ROE > rE)
Performance of any firm (listed OR unlisted), or of any division:
Total \ Assets > Total \ Capital as Total capital does not include current liabilities.
Accounting Rates of Return Example
Kroger’s cost of capital (WACC) was about . The company earned more than demanded.
Kroger’s cost of equity capital, rE, in 2019 was about , so its return on equity was well above its cost of equity.
ROC = \frac{after-tax \ interest + net \ income}{total \ capital} = \frac{(1 - 0.21) \times $603 + 1,512}{$19,907} = 0.100 \ or \ 10.0\%
ROA = \frac{after \ tax \ interest + net \ income}{total \ assets} = \frac{(1 - 0.21) \times $603 + 1,512}{$38,118} = 0.052 \ or \ 5.2\%
ROE = \frac{net \ income}{equity} = \frac{$1,512}{$7,835} = 0.193 \ or \ 19.3\%
Problems with EVA and Accounting Rates of Return
Advantages:
Show current performance and not affected by expectations about future events.
Can be calculated for private companies and for a particular plant or division.
Disadvantages:
Measures based on book (balance sheet) values for assets.
Certain assets such as intangibles (e.g. brand name, reputation) are not shown on the balance sheet.
Problems with EVA and Accounting Rates of Return (Cont.)
Disadvantages (cont.):
A good project (high NPV) may have cash flows that vary greatly over its duration.
EVA and ROI may be negative in the start-up years, even if the project had a strong positive NPV.
Balance sheet does not show the current market values of the firm’s assets.
Book equity is reduced with stock repurchases --> firms with active repurchases may have negative book equity.
Measuring Efficiency: DuPont Analysis
Explore reasons for why a company has earned a high or low return.
The return on a firm’s assets depends on the sales it generates and the profit earned from each dollar of sales.
Asset Turnover Ratio
Sales-to-assets ratio
Shows how much sales volume is generated by each dollar of total assets (measures how hard firm’s assets are working).
Example: Asset turnover ratio = \frac{$122,286}{$38,118} = 3.21
Measuring Efficiency: DuPont Analysis (Cont.)
Profit Margin
Measures the proportion of sales that finds its way into profits.
Operating Profit Margin
Adds back the after-tax debt interest to net income.
Example: Profit margin = \frac{$1,512}{$122,286} = 0.0124
Example: Operating profit margin = \frac{(1-0.21) \times $603 +$1,512}{$122,286} = 0.0163
Explaining the Return on Assets (ROA)
DuPont formula
ROA depends on 2 factors:
Sales company generates from its assets (asset turnover)
Profit earned on each dollar of sales (operating profit margin)
Du Pont Formula Example
Any improvement in a firm’s ROA must involve either an improvement in asset turnover or in the operating profit margin.
Example:
Measuring Efficiency: Lean Inventory
Inventory Turnover Ratio (ideally high)
Example: = \frac{$95,294}{$6,846} = 13.9
Inventory Period (ideally low)
Measures how many days of output are represented by inventories.
Example: = \frac{$6,846}{$95,294 / 365} = 26.2 \ days
Measuring Efficiency: How quickly Accounts Receivable are actually received
Receivables turnover (ideally high)
A measure of firm’s sales as a proportion of its receivables
Example: = \frac{$122,286}{$1,589} = 77.0
Accounts receivable period (ideally low)
Measures average length of time for customers to pay their bills.
The faster the firm turns over its receivables, the shorter the collection period.
Example: = \frac{$1,589}{$122,286 / 365} = 4.7 \ days
Measuring Leverage
Debt increases the returns to shareholders in good times and reduces them in bad times --> creates financial leverage.
Leverage ratios measure how much financial leverage the firm has taken on.
“long-term debt” should include not just bonds or other borrowing but also financing from long-term leases.
Long-term debt ratio
Example: 12,111/(12,111+8,573)=0.59\ or\ 59%
Long-term debt-equity ratio
Example: = \frac{$12,111}{$8,573} = 1.4 \ or \ 140\%
Measuring Leverage (Cont.)
Another measure of leverage widens the definition of debt to include all liabilities (including short-term debt) --> Total debt ratio:
Example: = \frac{$36,683}{$45,256} = 0.81 \ or \ 81\%
Another useful measure to consider is the firm’s net debt, or debt in excess of its cash reserves --> use the concept of net debt to compute the firm’s debt-to-enterprise value ratio
Measuring Leverage (Cont.2)
Another measure of financial leverage is the extent to which interest obligations are covered by earnings.
Interest coverage ratio (Times-Interest-Earned) is measured by the ratio of earnings before interest and taxes (EBIT) to interest payments.
Cash coverage ratio Uses EBITDA as a proxy for operating cash flow to assess capacity to repay debt
Example: = \frac{$2,584}{$603} = 4.3
Firm’s pretax/interest income ability to pay for debt.
Example: = \frac{$2,584 + 2,649}{$603} = 8.7
Firm’s operating cashflow ability to pay for debt.
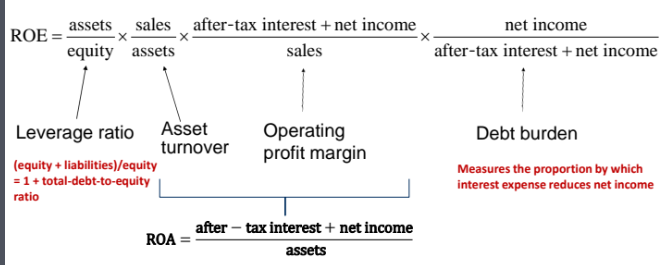
Leverage and the Return on Equity
An extended version of the DuPont breaks down the return on equity (ROE) into 4 parts:
Consists of: Leverage ratio, Asset turnover, Operating profit margin, Debt burden
Depends on the firm’s production & marketing skills and unaffected by the firm’s financing mix.
Measures the proportion by which interest expense reduces net income (equity + liabilities)/equity = 1 + total-debt-to-equity ratio
Understanding Liquidity
What proportion of firm’s assets are cash, or easily converted to cash?
Does the firm have enough cash (or quickly-to-sell assets) to easily repay its short-term liabilities?
Liquidity ratios measure firm capacity to repay immediate debts by comparing some version of current assets to firm’s current liabilities
For all liquidity ratios, the higher the ratio the more solvent is the firm.
Too much liquidity is a waste of resources though, as the cash could be invested elsewhere for higher returns.
Measuring Liquidity
Net Working Capital (NWC) to Total Assets Ratio
Ratio expresses a firm’s net working capital, NWC, ( = current assets – current liabilities) as a proportion of its total assets.
NWC roughly measures the company’s potential reservoir of cash.
NWC \ to \ total \ assets = \frac{$-3,353}{$42,256} = -0.0793
Current Ratio: Ratio of current assets to current liabilities
Current \ ratio = \frac{$10,890}{$14,243} = 0.76
Measuring Liquidity (Cont.)
Current Ratio
The current ratio is a good starting point for liquidity, and is quick to calculate from numbers on the Balance Sheet.
Net Working Capital (NWC) to Total Assets Ratio
This ratio expresses a firm’s net current assets as a proportion of its total assets.
Measuring Liquidity (Cont.2)
Quick (Acid-Test) Ratio: excludes inventories and other less liquid components of current assets
Cash Ratio Focus on company’s most liquid assets i.e. holdings of cash and marketable securities.
Quick ratio = \frac{$1,578 + 1,706}{$14,243} = 0.23
Cash ratio = \frac{$1,578}{$14,243} = 0.11
While all quick assets are current assets, not all current assets are quick assets.
Interpreting Financial Ratios
How do we judge whether calculated financial ratios are ‘high’ or ‘low’?
Against what benchmark do we compare financial ratios?
In some cases, there may be a natural benchmark e.g
Negative EVA
ROC < after-tax \ WACC
Against what benchmark do we compare other financial ratios the rest of the time, though?
Examine how financial ratios have changed over time.
Examine how firm’s ratios stack up in comparison against a selection of peer companies.