neuroscience; week 9; hormones and sex
Hormones and the brain
a hormone is a signalling molecule that is transported between organs of the body by vascular system
hormones are essential for the regulation of development, physiology and behaviour, means they tend to control the speed at which certain things occur
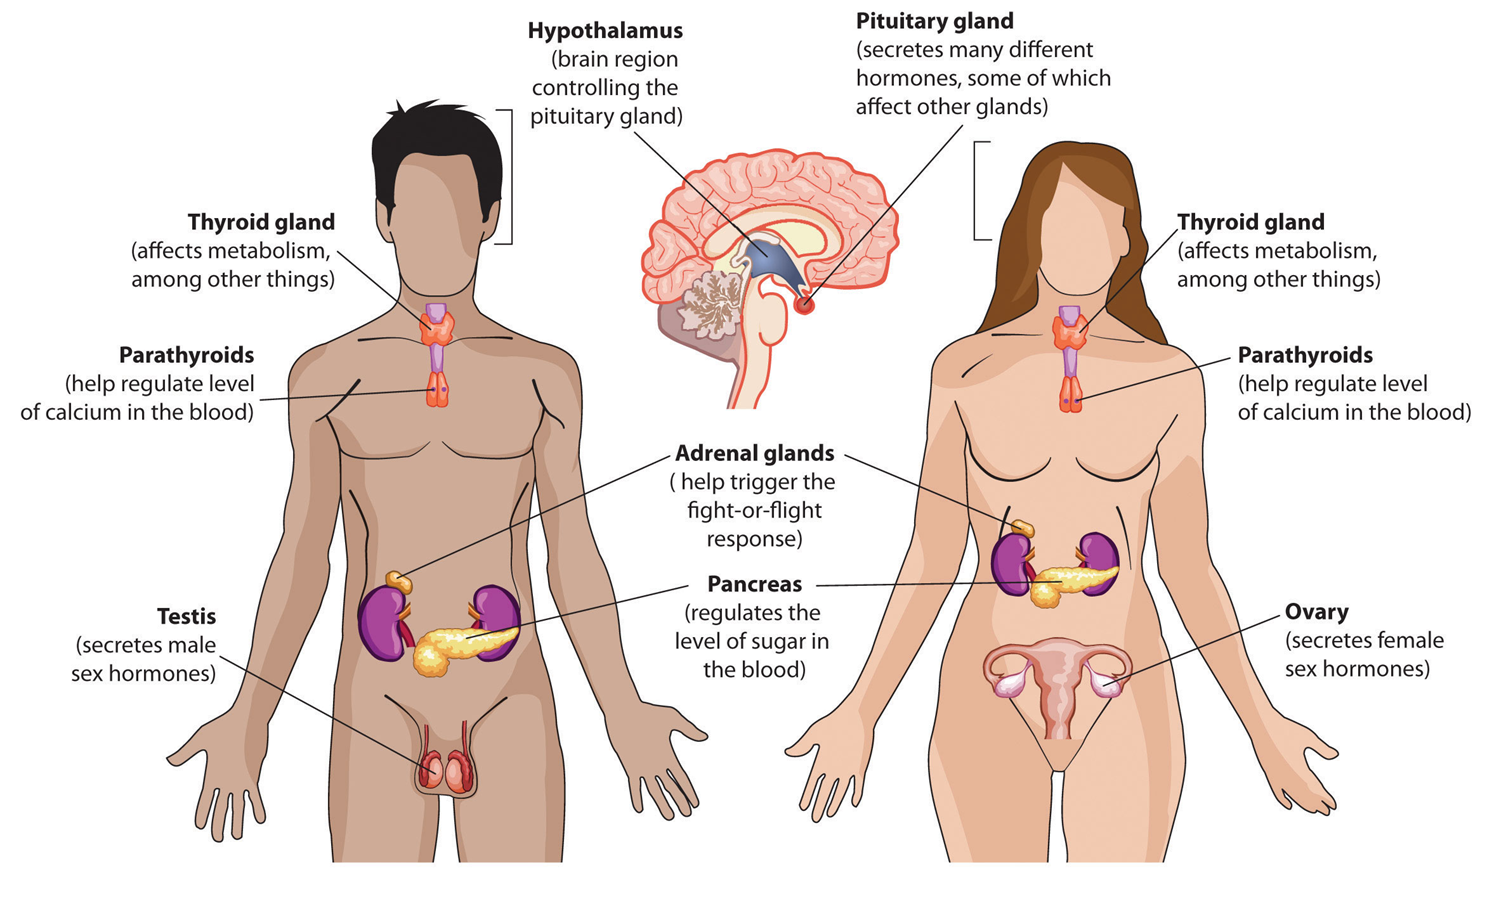
they are produced by many organs of the body (these are called endocrine glands) (the endocrine system), with receptors similarly located in many places
under some level of ‘master control’ by the brain, although this is itself set within a complex feedback architecture thus undermining a ‘simple’ concept of a control hierarchy,
what do hormones actually do? they regulate, thinking in a mechanistic way, kind of like how central heating in your house works
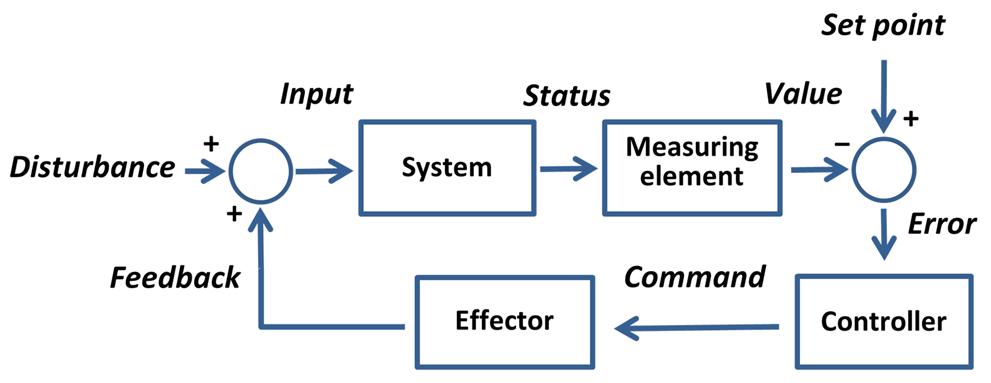
if something is wrong, then the controller can command things to correct this/ change things, if things are then back to where they want to be then the controller discards the command
The endocrine system
hormones, alongside neurotransmitters, underpin signaling within brain-body systems that act to maintain a desired ‘set-point’ in terms of behaviour of physiology
in fact, the term ‘set-point’ is better replaced with ‘desired state’ as it can be quite transient and itself dependent on input from other brain and body control systems
Hormones versus Neurotransmitters
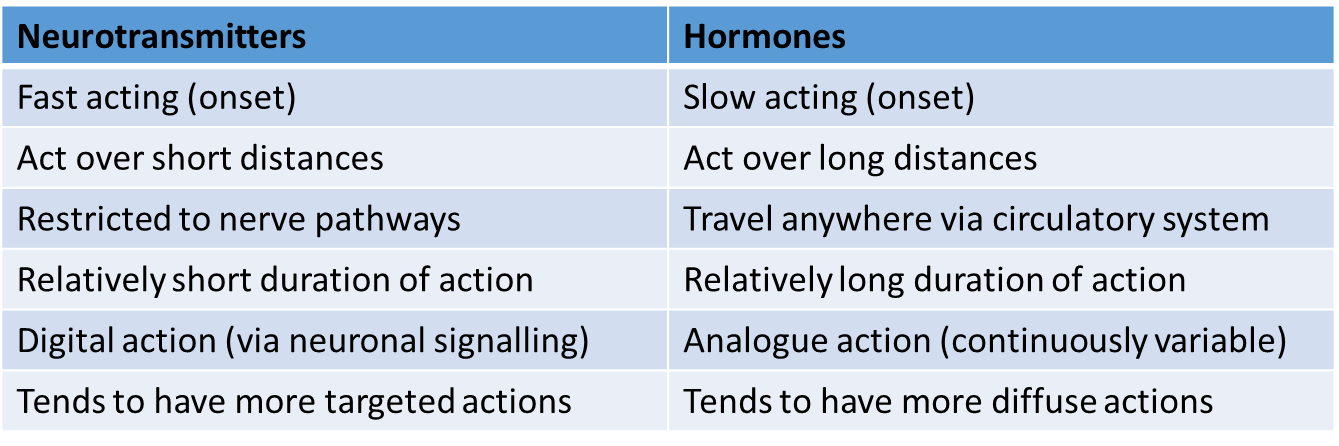
not necessarily a ‘versus’ all the time
hormones are thus able to not only access parts of us that neurotransmitters cannot reach, but are also able to offer a qualitatively different mechanism of signalling that may complement that orchestrated by the CNS/PNS
The vascular system: the hormone highway
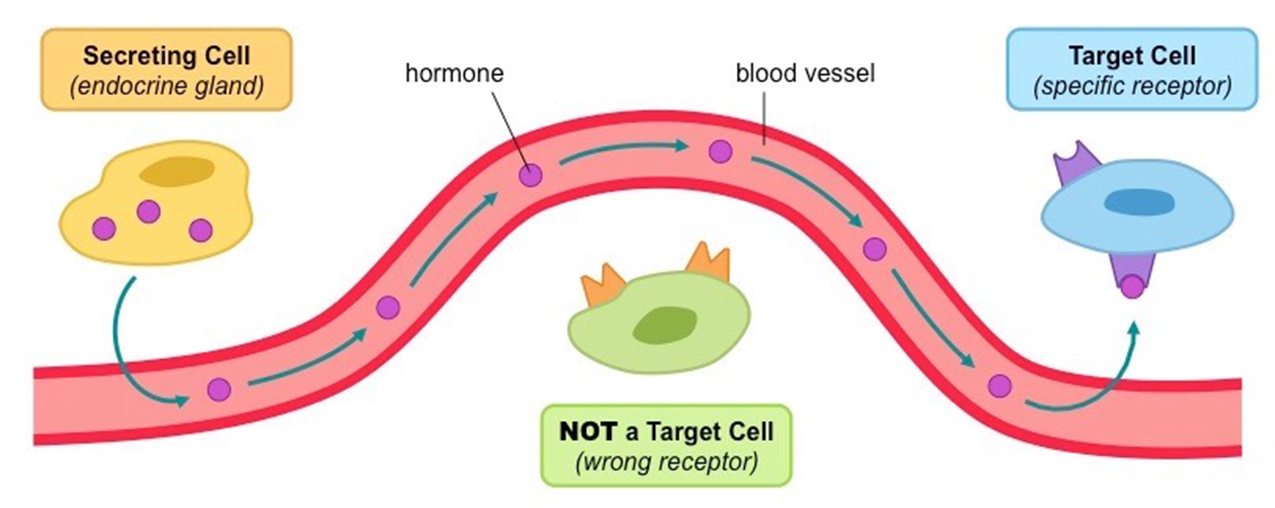
one thing that connects to this diagram, is cardiovascular health, so your blood supply with your body parts is important for health, issues with cardiovascular health can impact hormone control, as they can’t regulate as well as previously
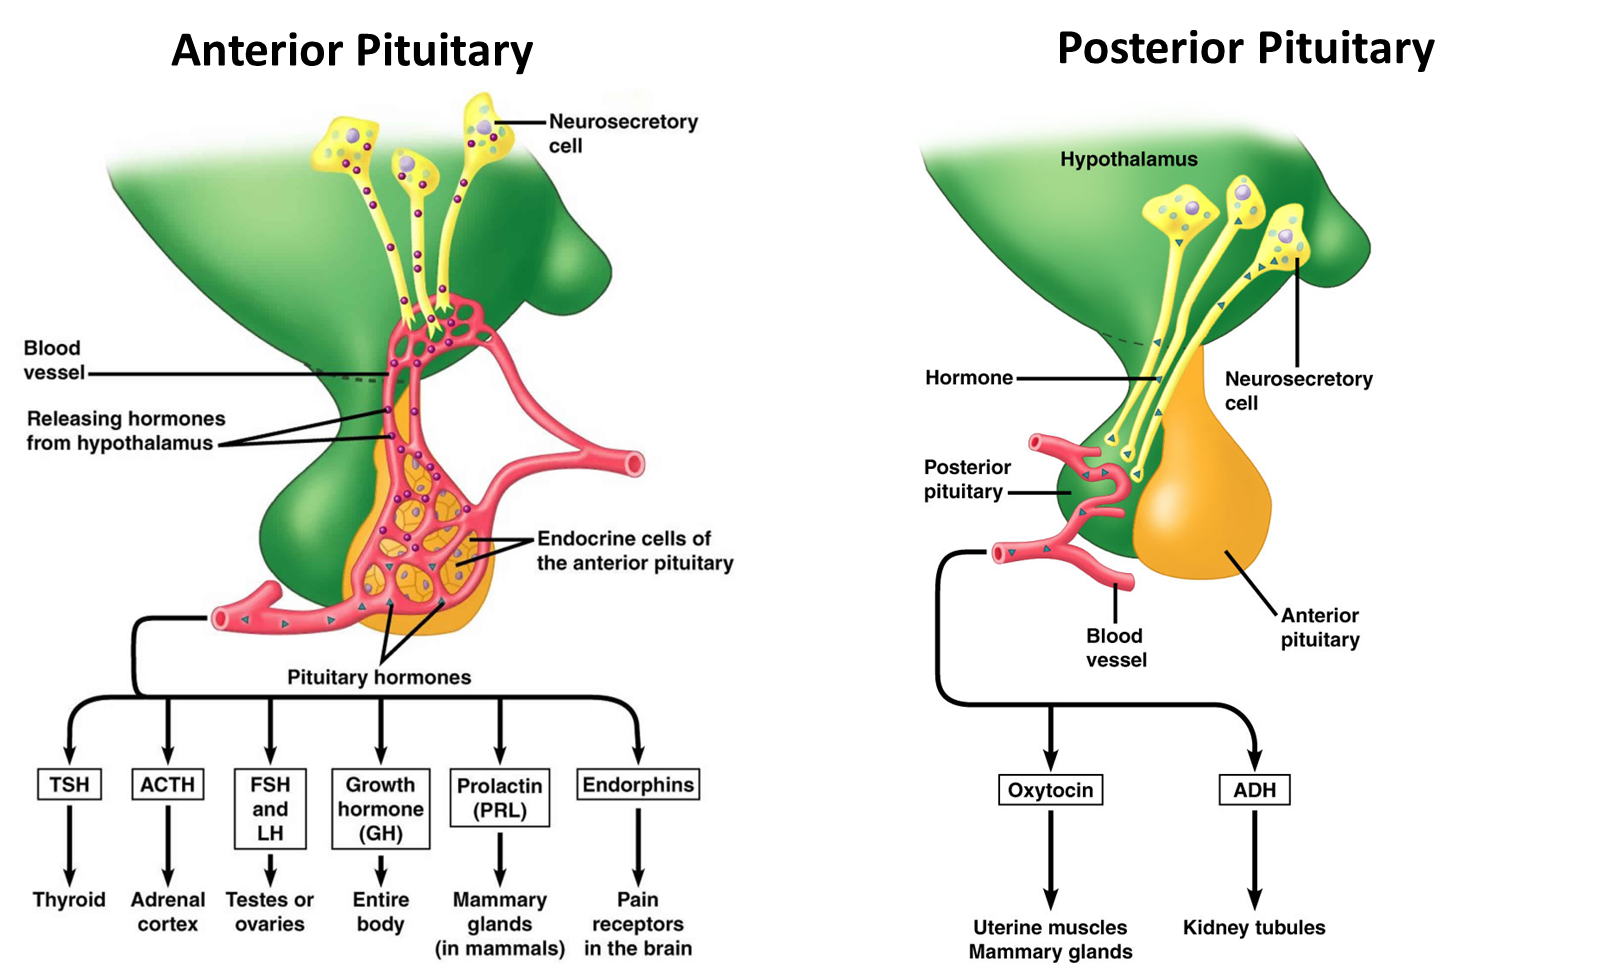
Hypothalamus- master controller?
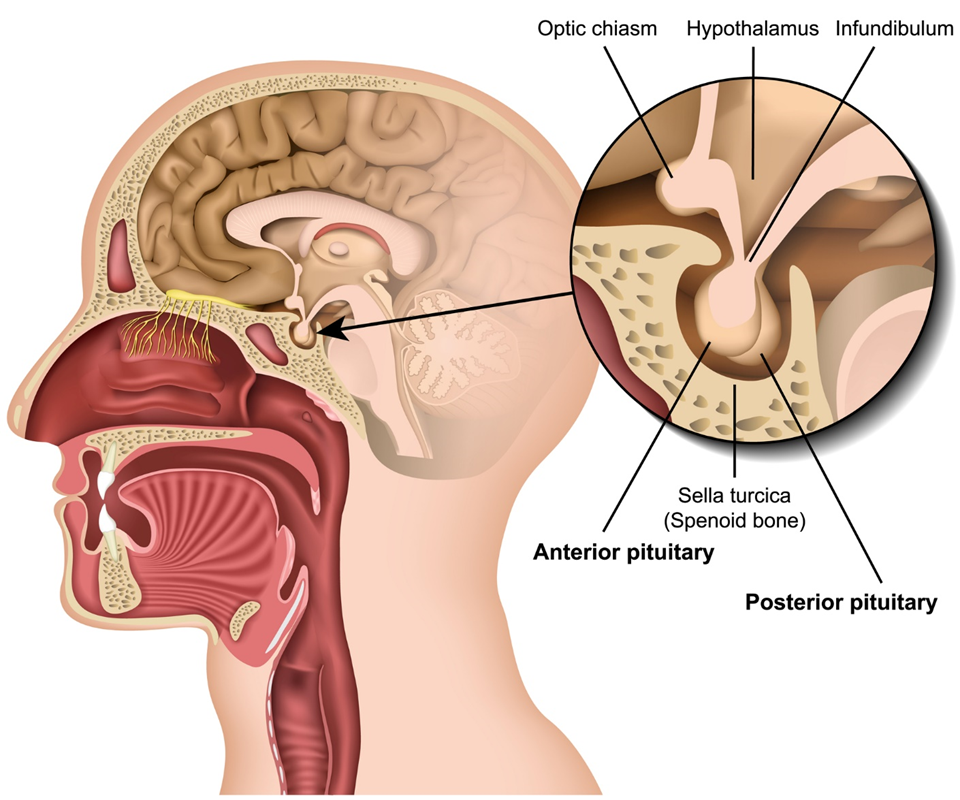
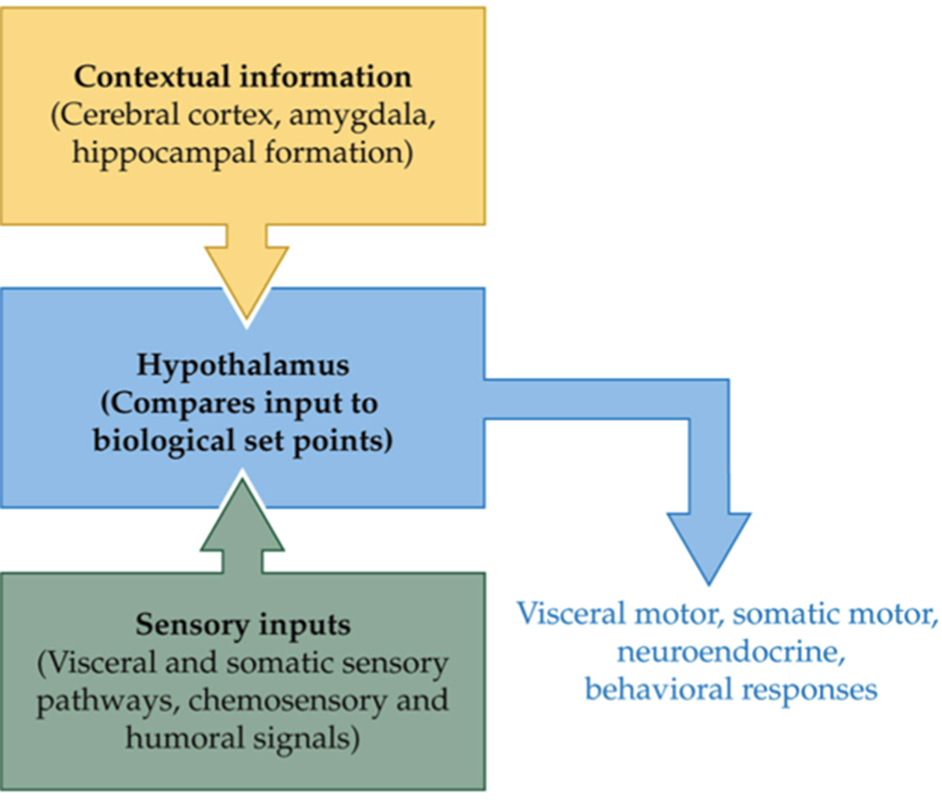
hypothalamus can see current state of body and current context of organism (which for humans may be cognitive in nature), and can make adjustments to physiology and behaviour via several routes (including hormones)
hypothalamus receives lots of sensory input, knows a lot about the interiors as well as external areas of the outside world and knows the context around you and can then regulate the function of nervous systems, these sensory inputs go into the hypothalamus, things like temperature, the hypothalamus knows the status of the situation now, the cortex figures out what to do now, and the amygdala potentially drives a fear response and drives an urge to do something about it
difficult to claim the hypothalamus is controlling all of this considering other brain areas come into influence, like amygdala or the cerebral cortex, although the hypothalamus has some level of control, it is also controlled by various things too
for example
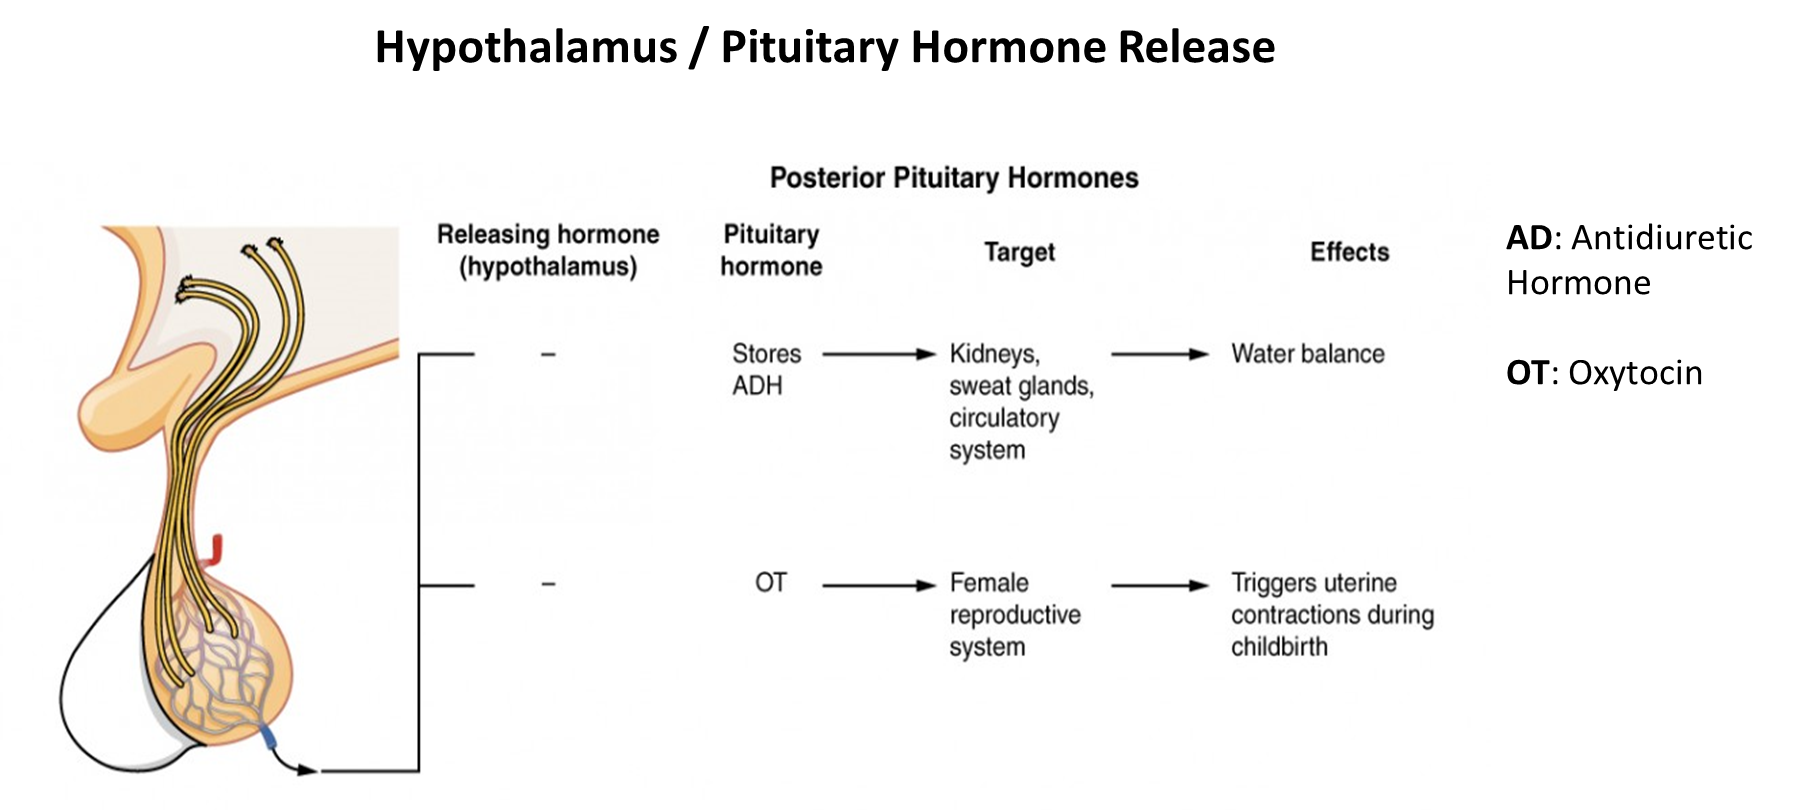
the hormone is important for the flow of fluid in the body
What do hormones do?
regulate physiology across the whole body in accordance with motivational states such as; arousal, aggression, hunger, fear and fatigue
regulate many processes, including: digestion, metabolism, respiration, tissue function, sensory perception, sleep, excretion, lactation, growth and development, movement, reproduction
common features: feedforward and feedback signaling, bidriectional influences between body and brain
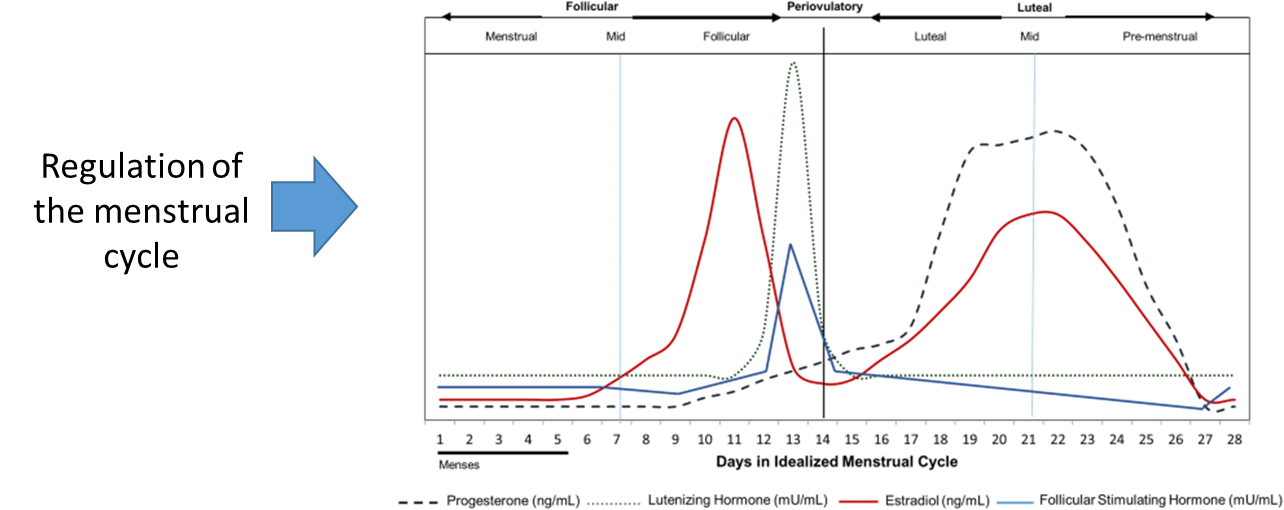
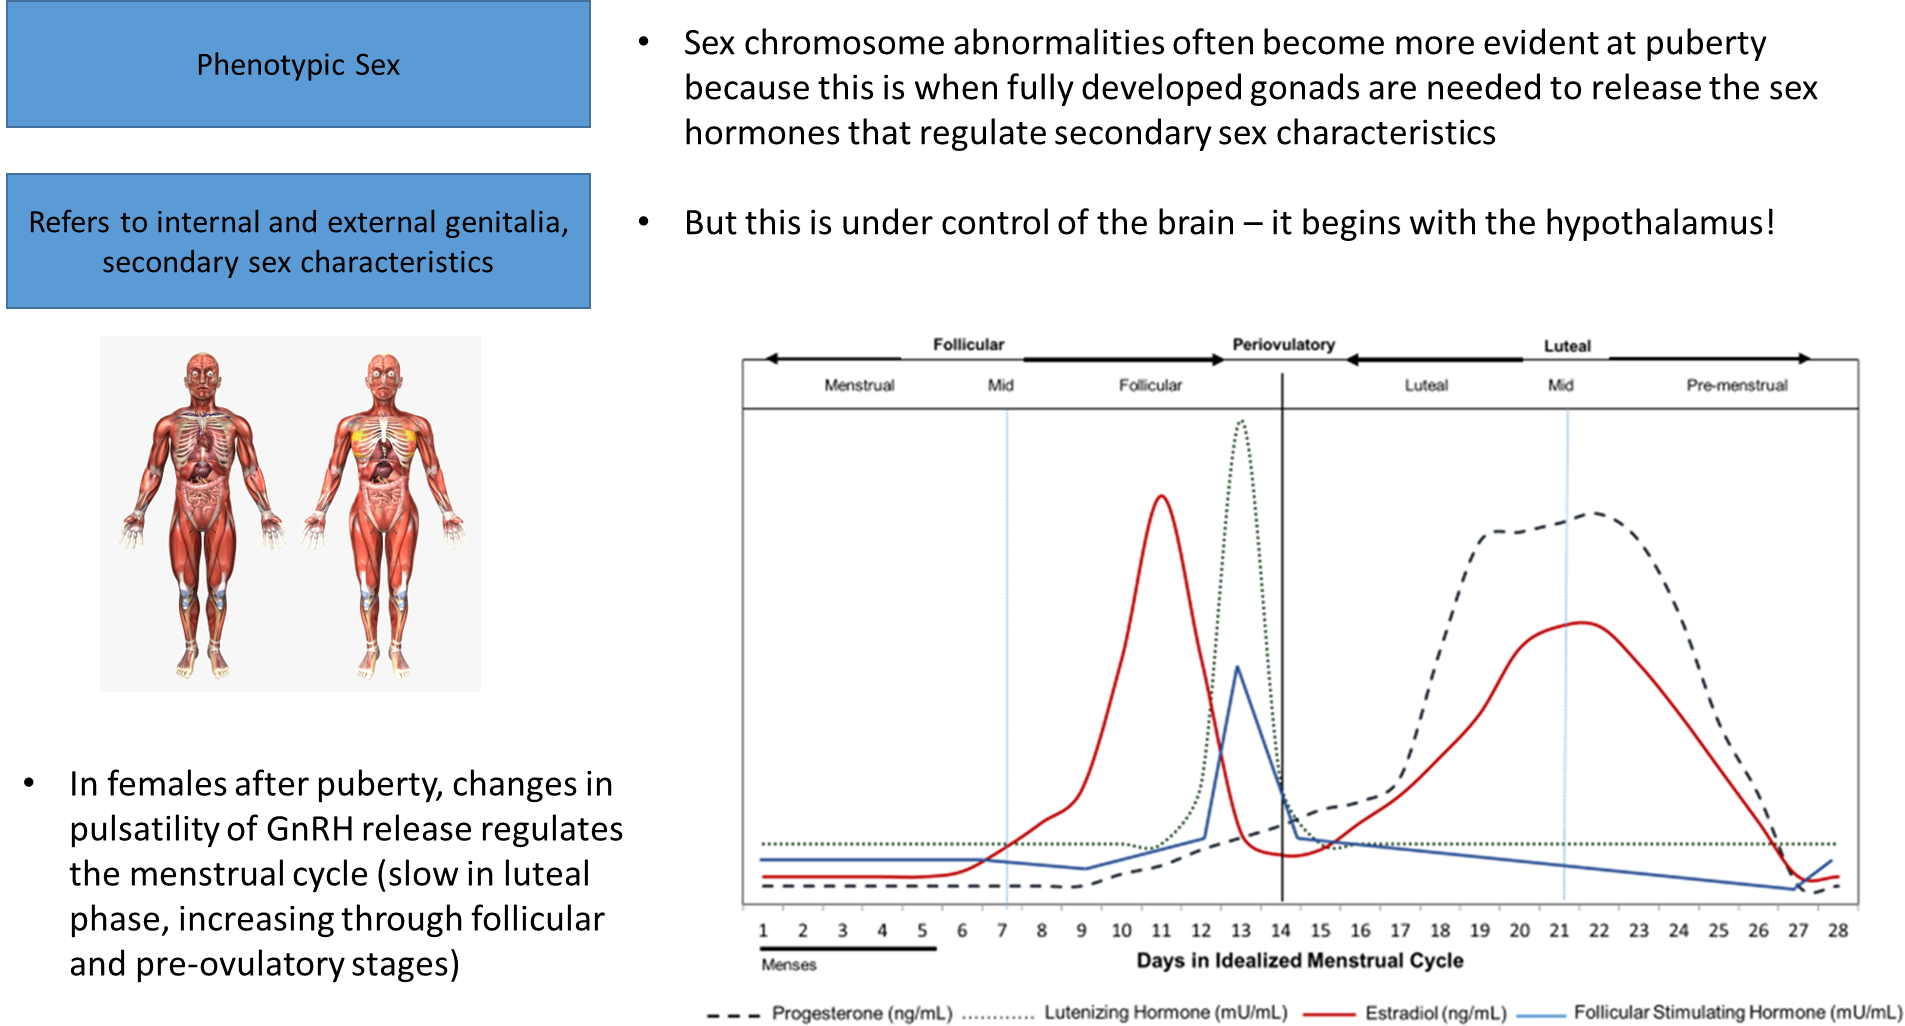
the menstrual cycle includes the coordination of four separate hormones; which would be hard to regulate every month, this shows that a lot of processes include the coordination of multiple hormones, not just one
Sex, sexuality and gender

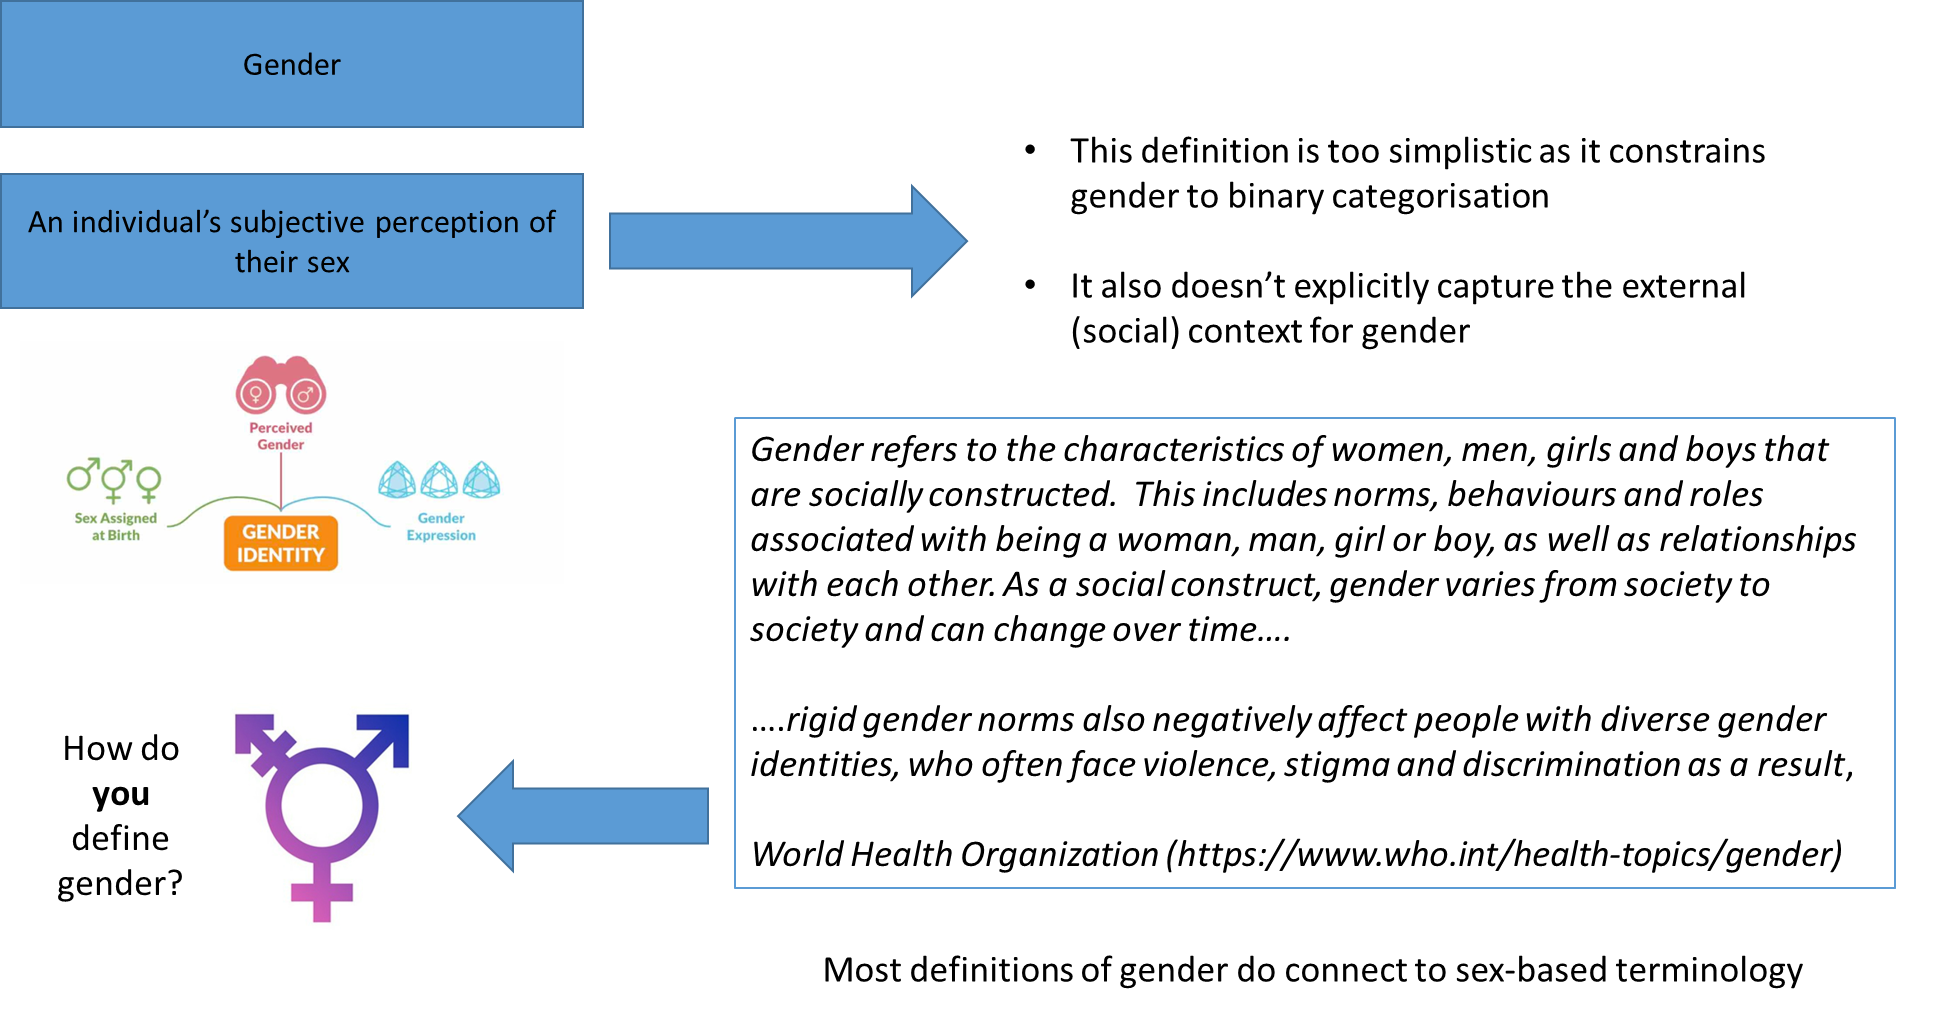
different ways to decipher gender:
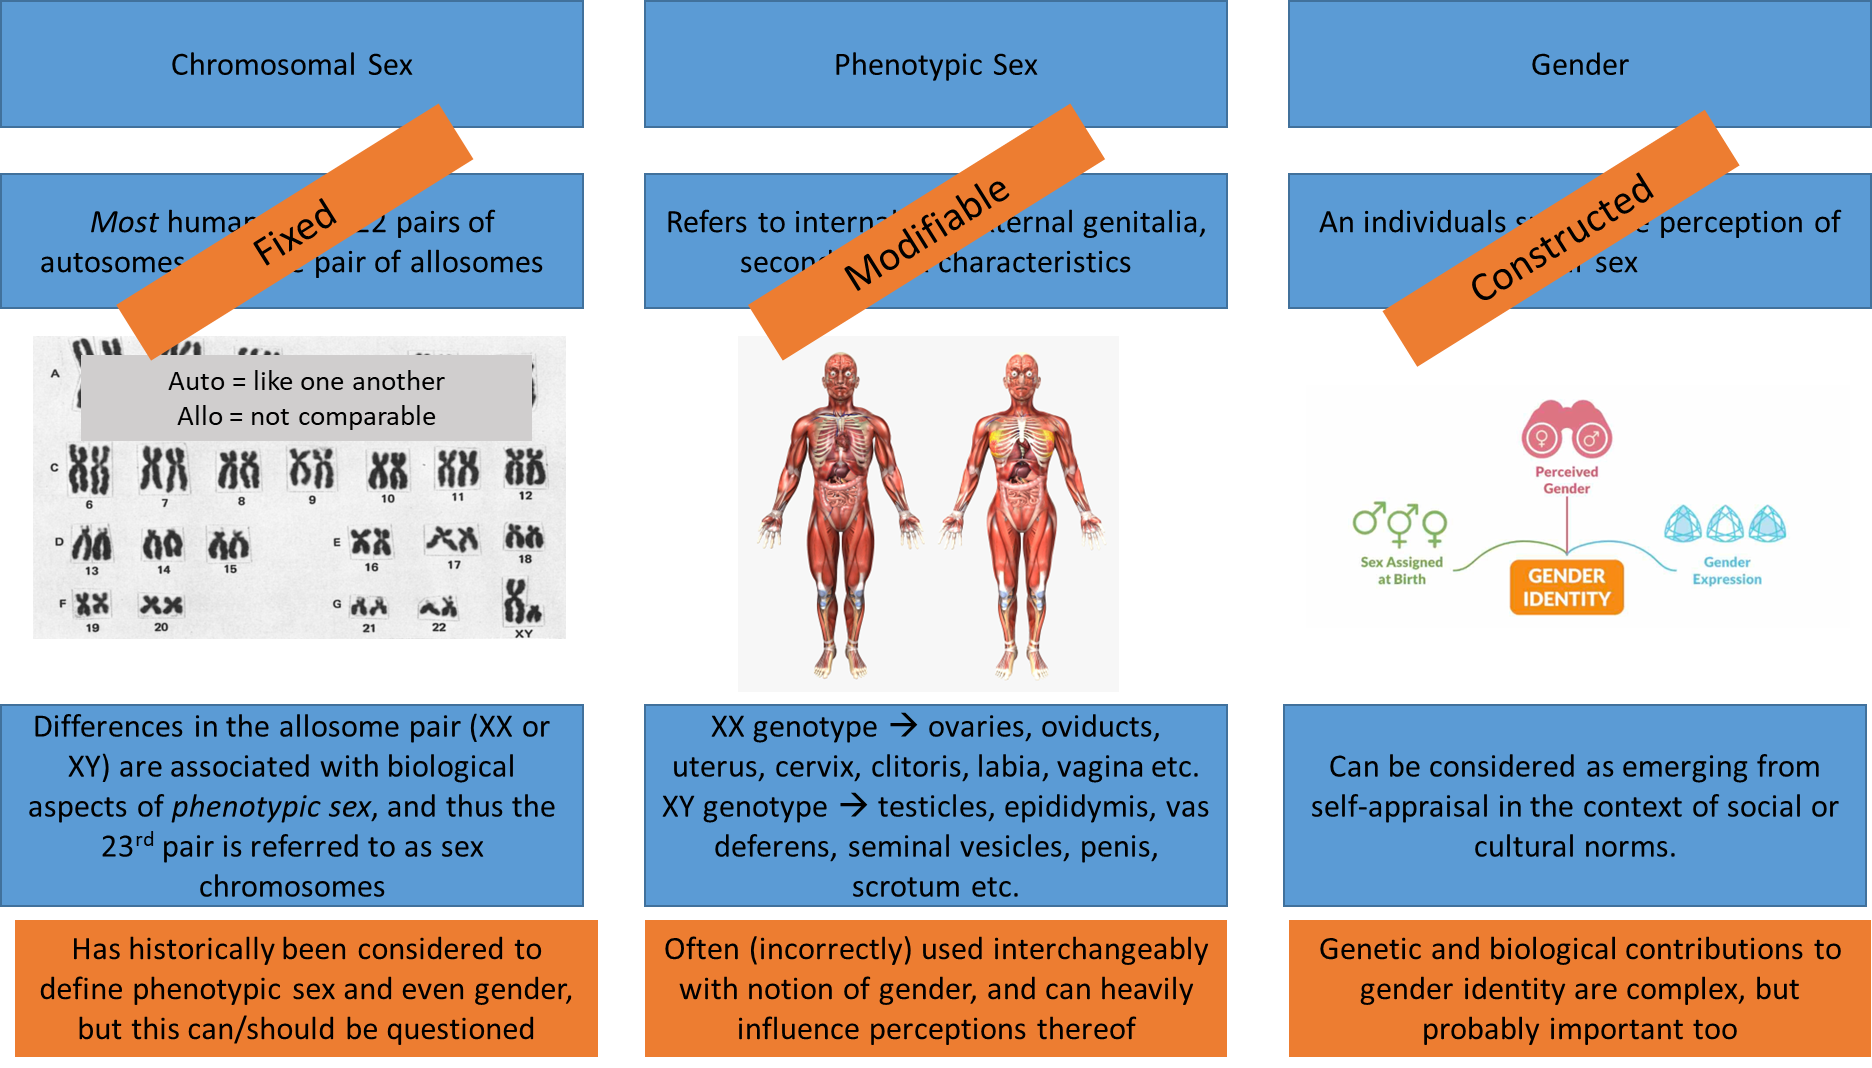
gender is defined in many ways and is a subjective way of expressing one’s perceived gender, but it is heavily influenced, for the most part, by sex assigned at birth
phenotypic sex is modifiable particularly during developmental stages
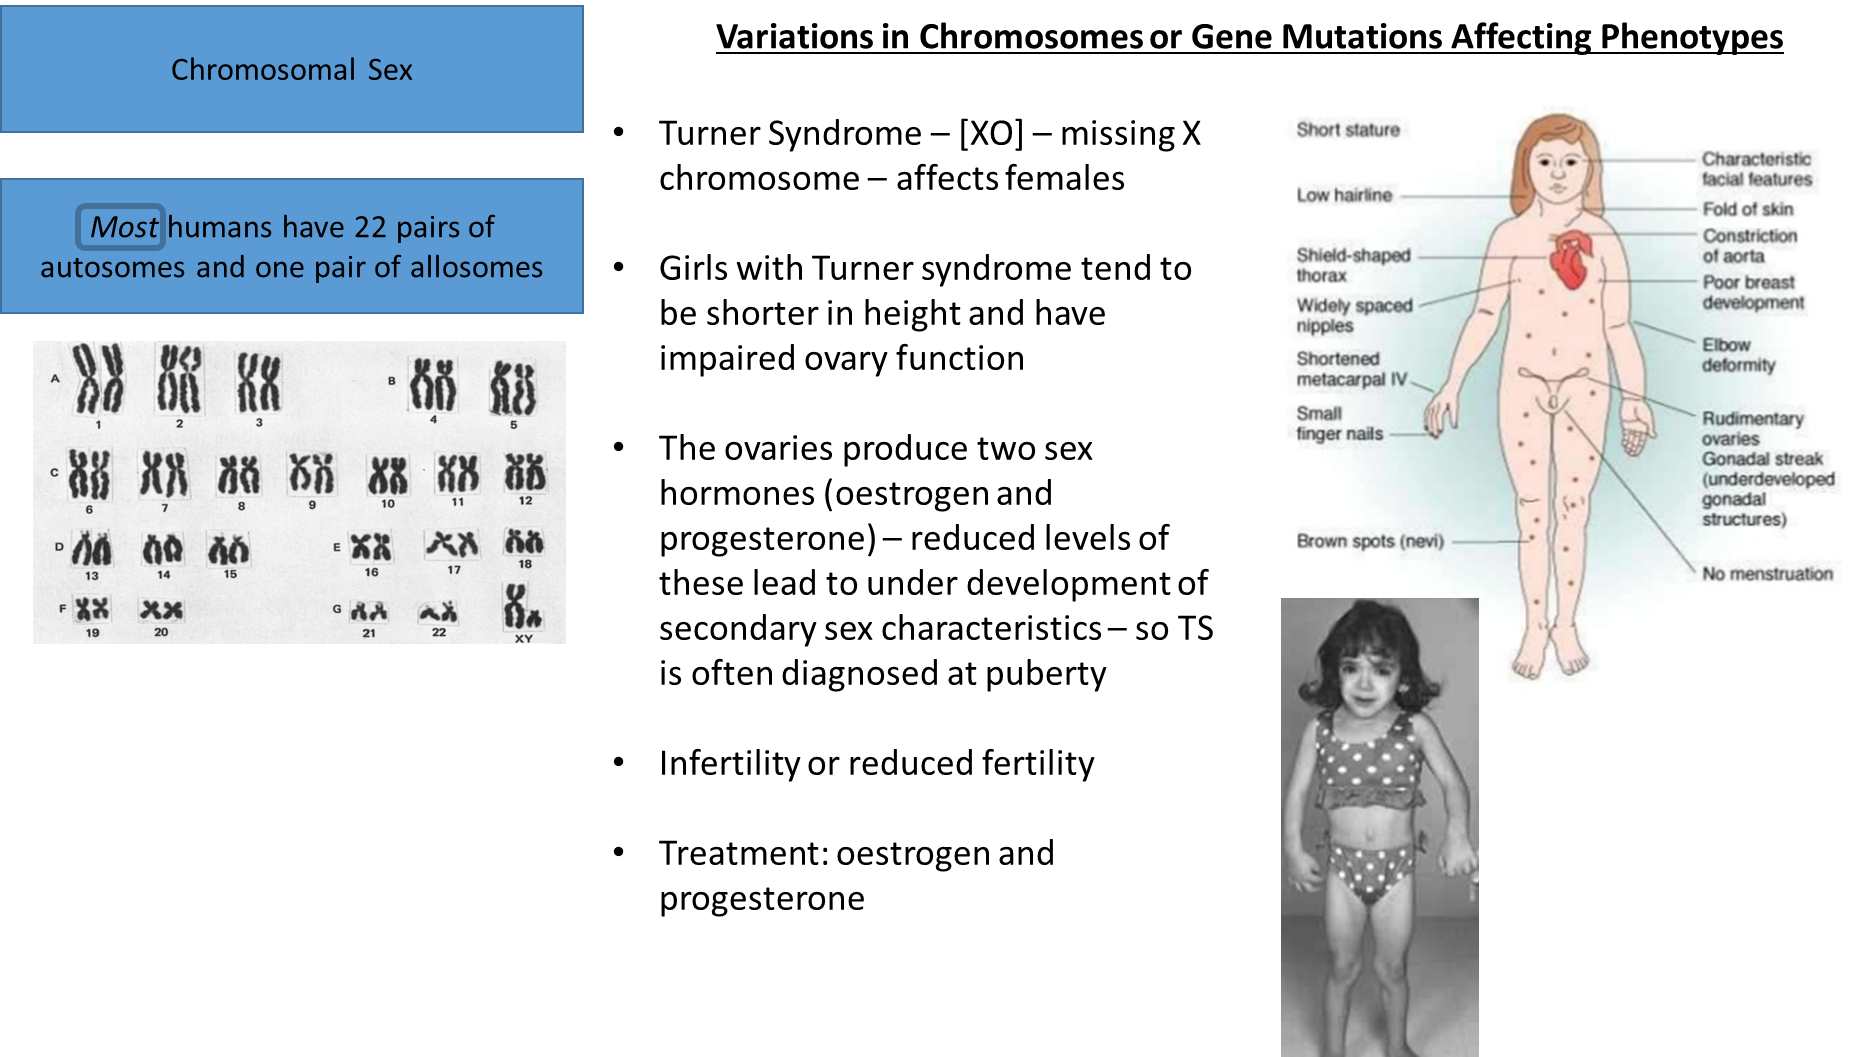
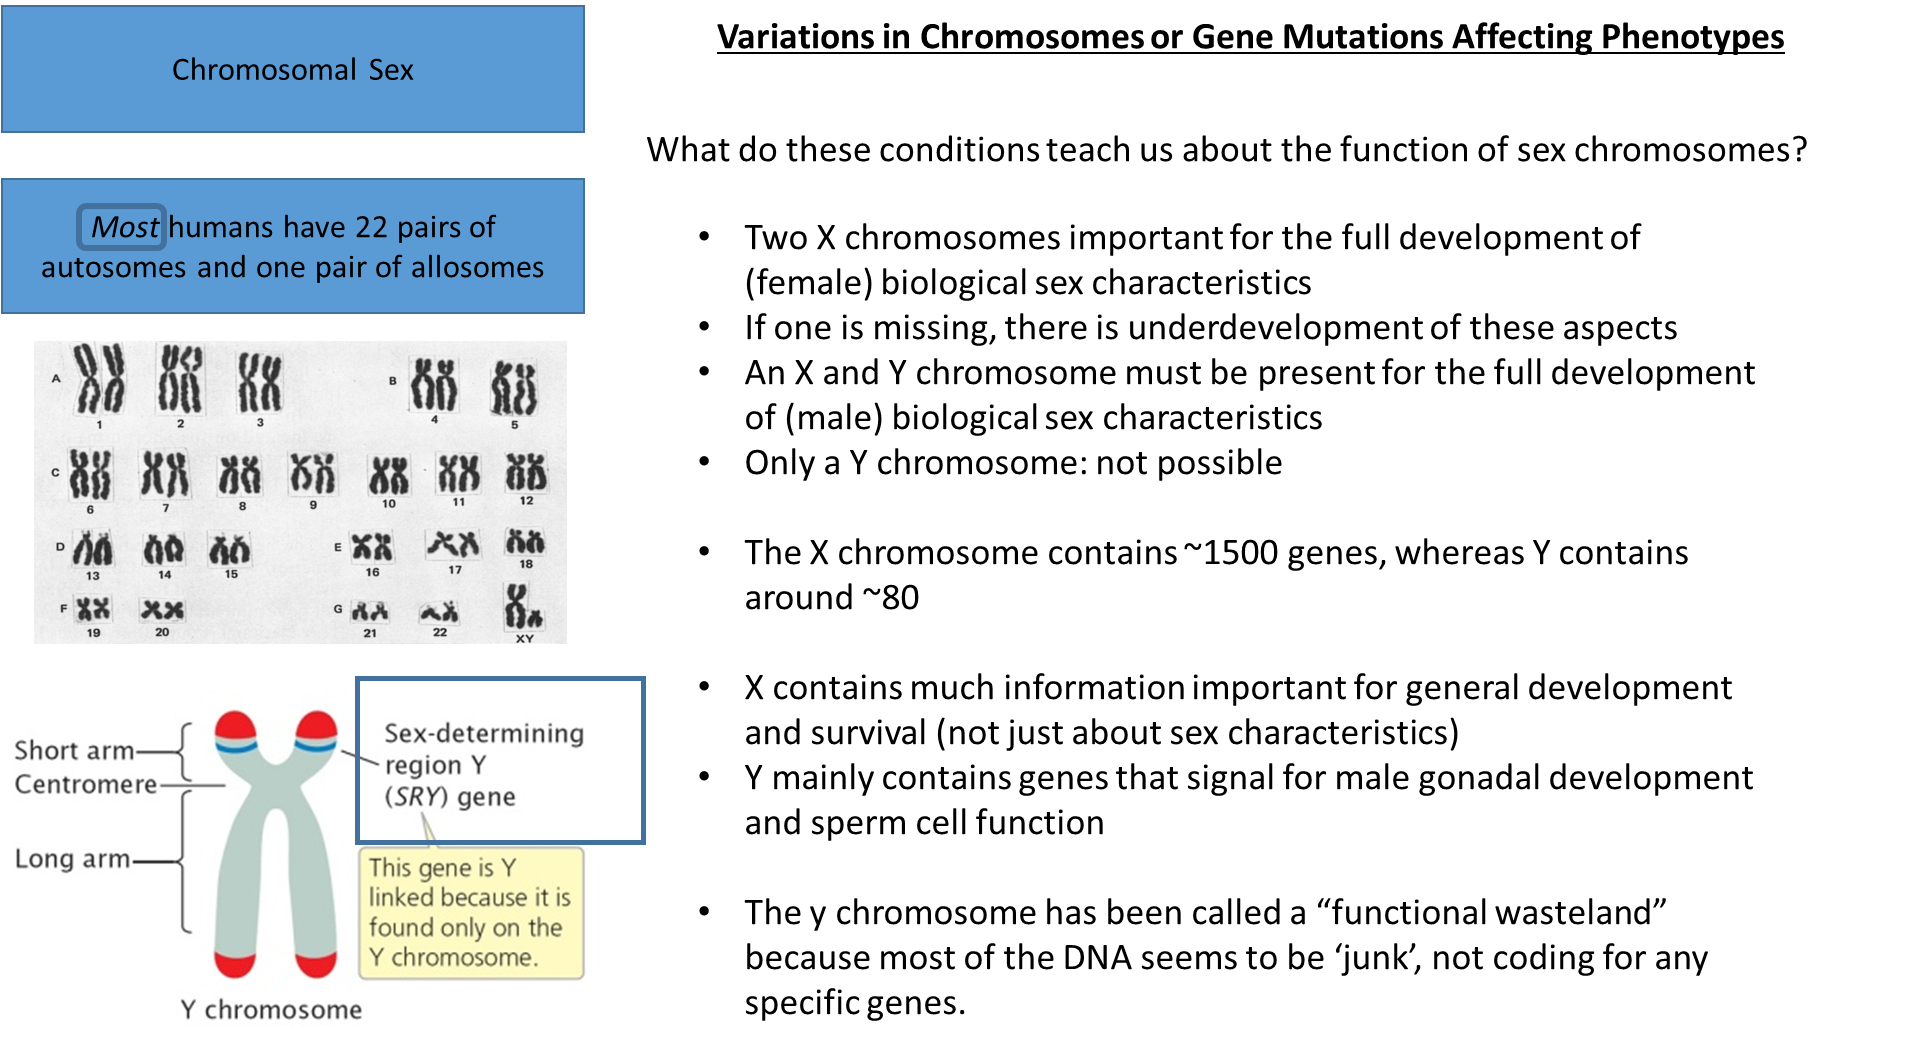
Turner syndrome: a missing x chromosome, this chromosome contains a large amount of biological information needed
may not be diagnosed until puberty because of the symptoms becoming more abundant during this time
treatment can address the issues of the syndrome
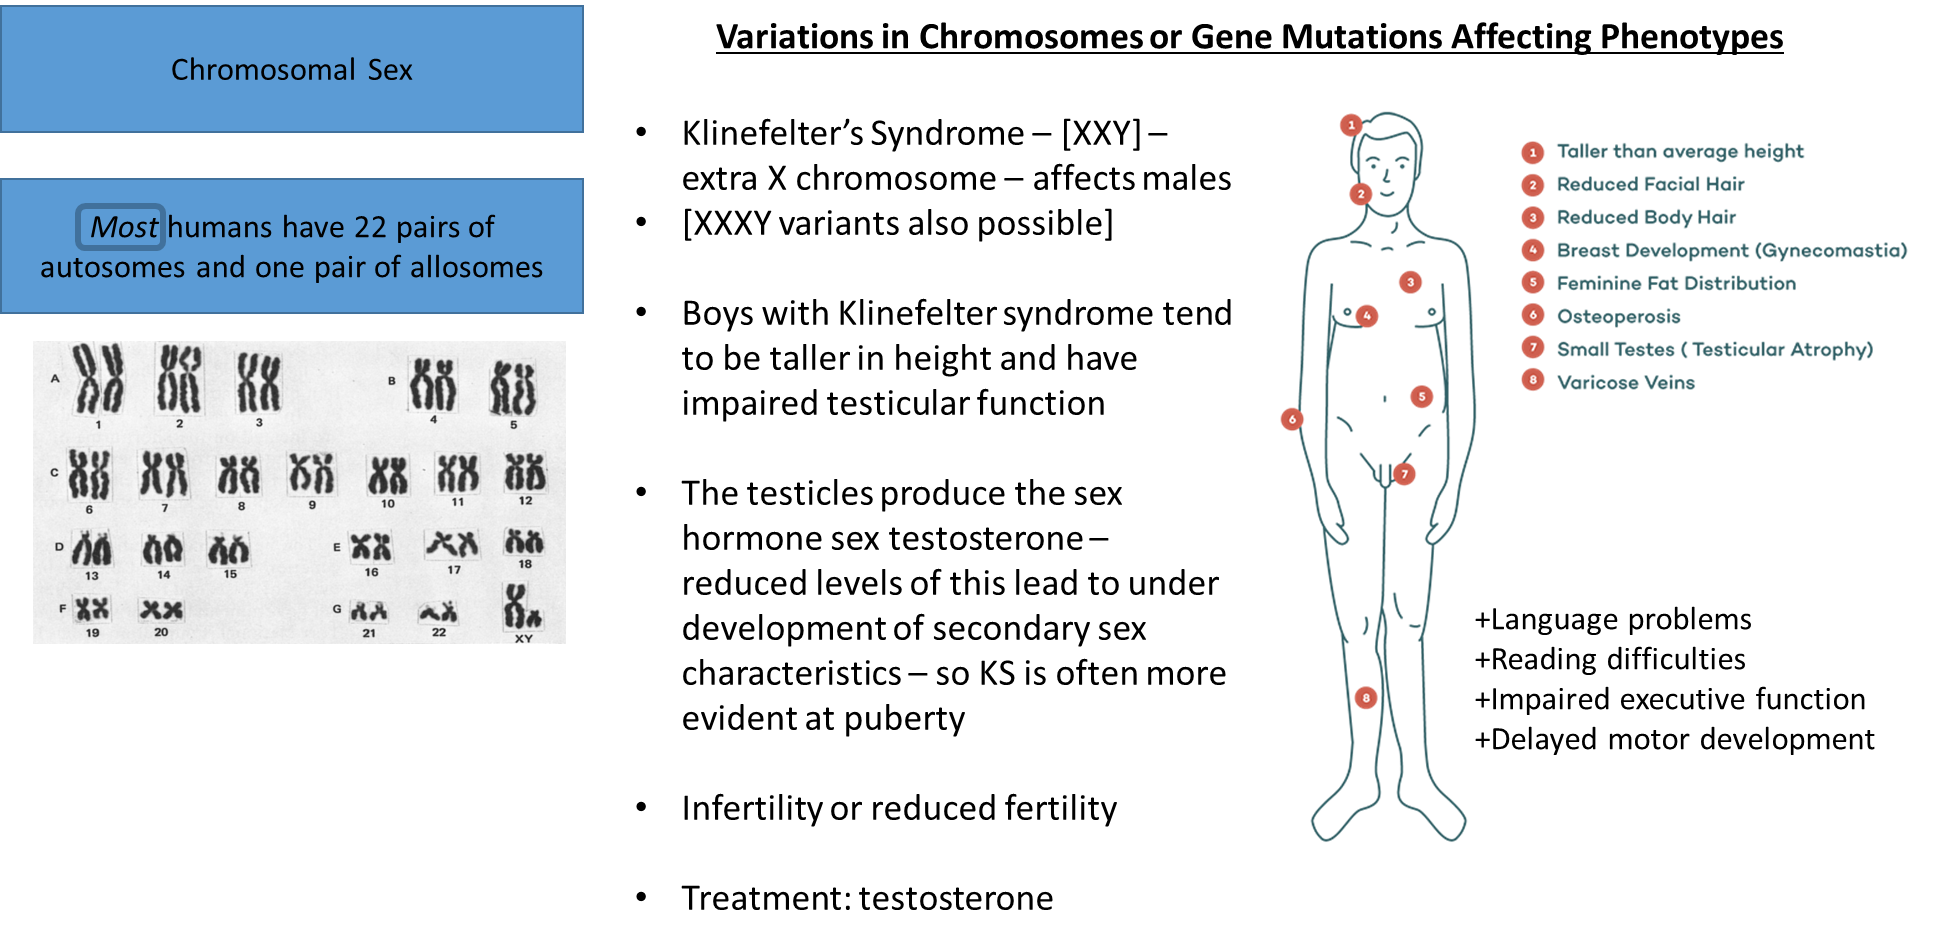
genetic issues in terms of the chromosomes that affect the secondary sex organs
treatment works for the secondary sex organs, nothing can change the chromosomal make up
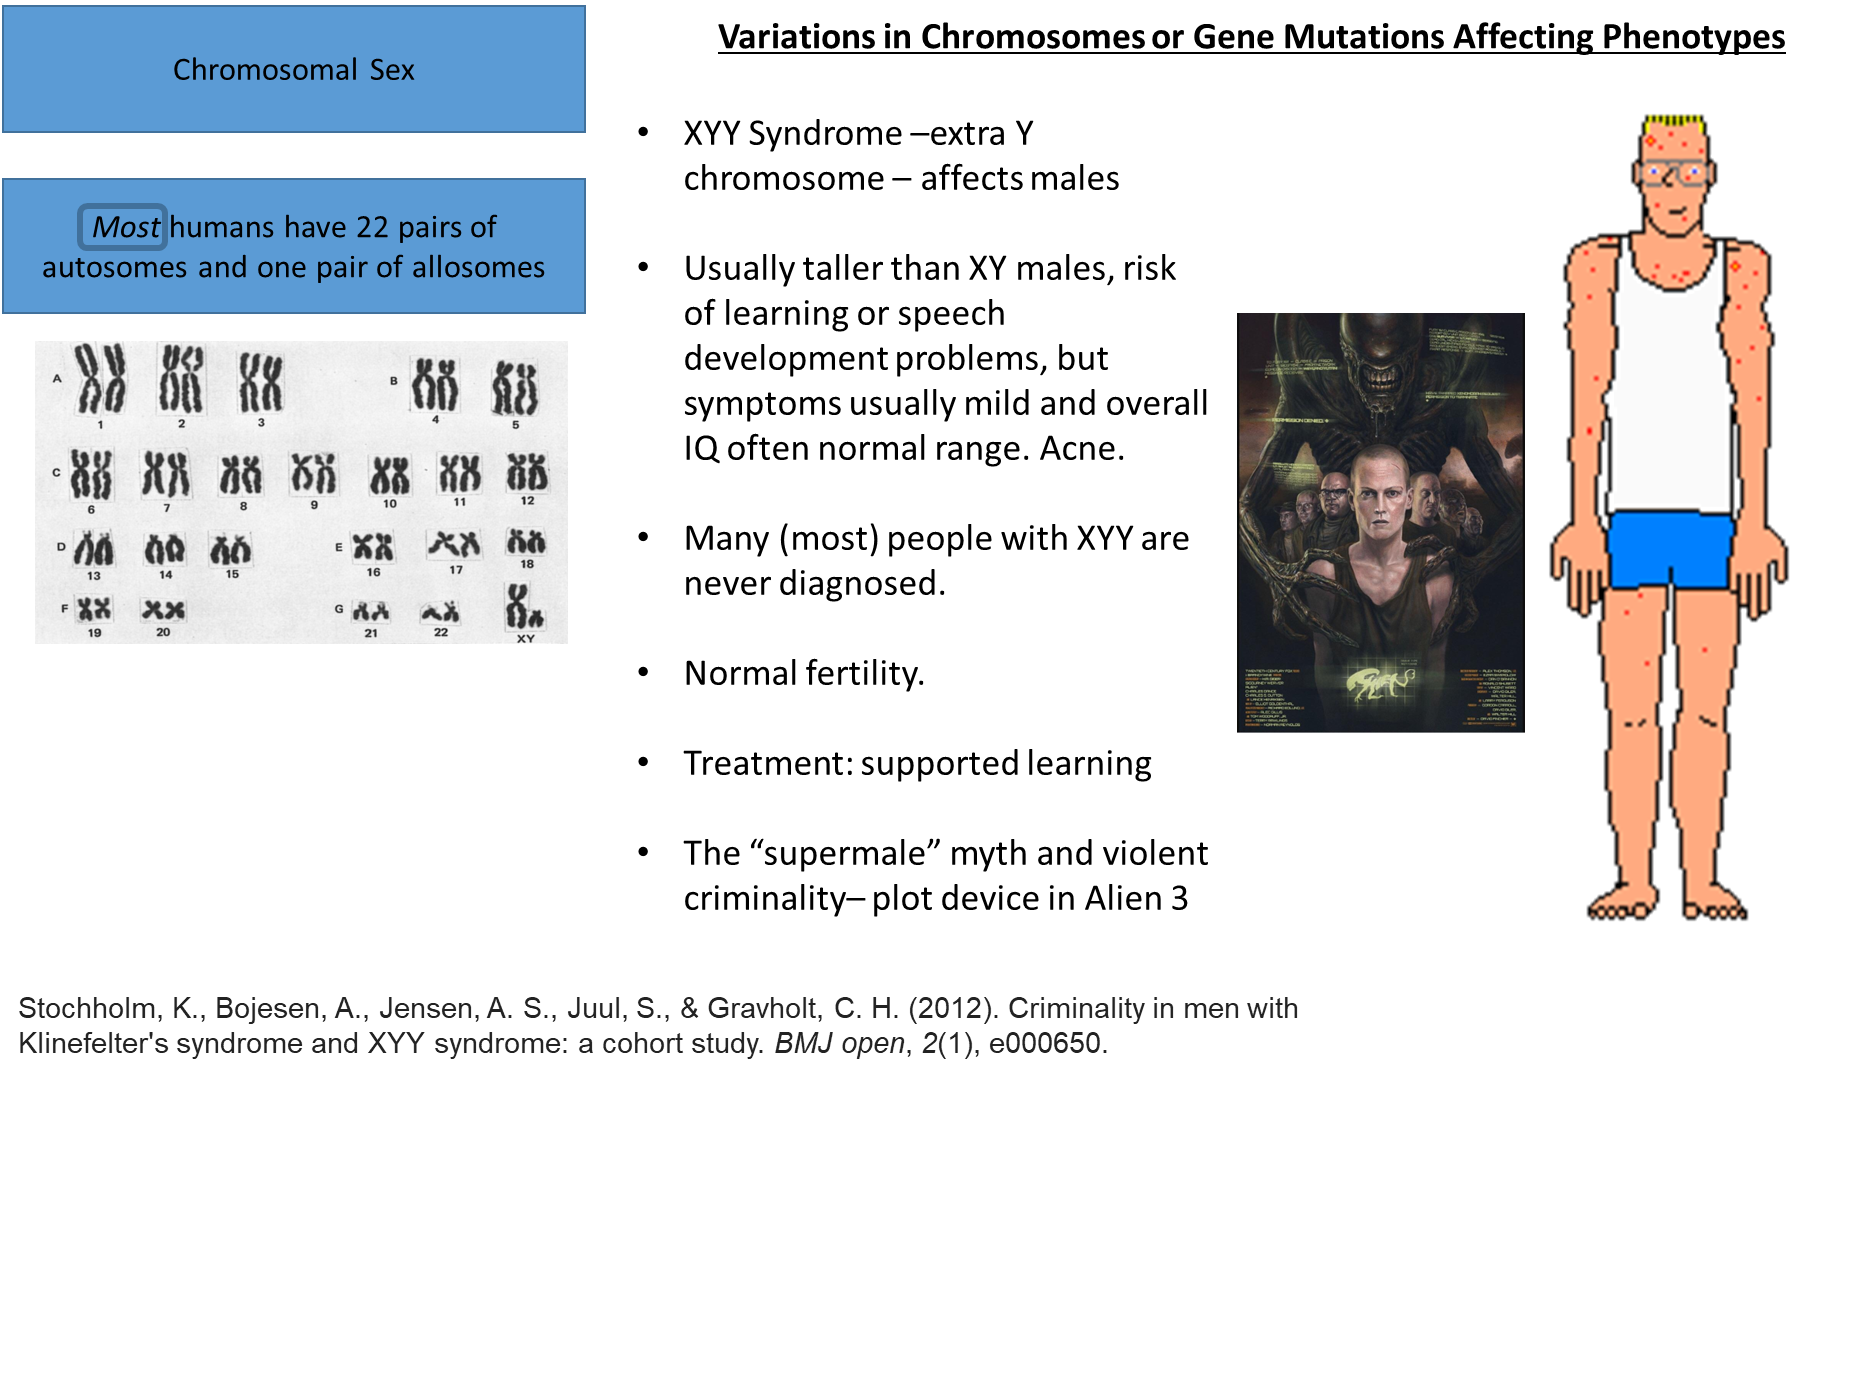
doesn’t have an overwhelming amount of issues arise during puberty so fertility is normal
they’re could have a higher risk of vulnerability to various social situations, including violence or crime because of a loose connection, but the direct assumption that there is a clear relationship between those with XYY and violent crime is false
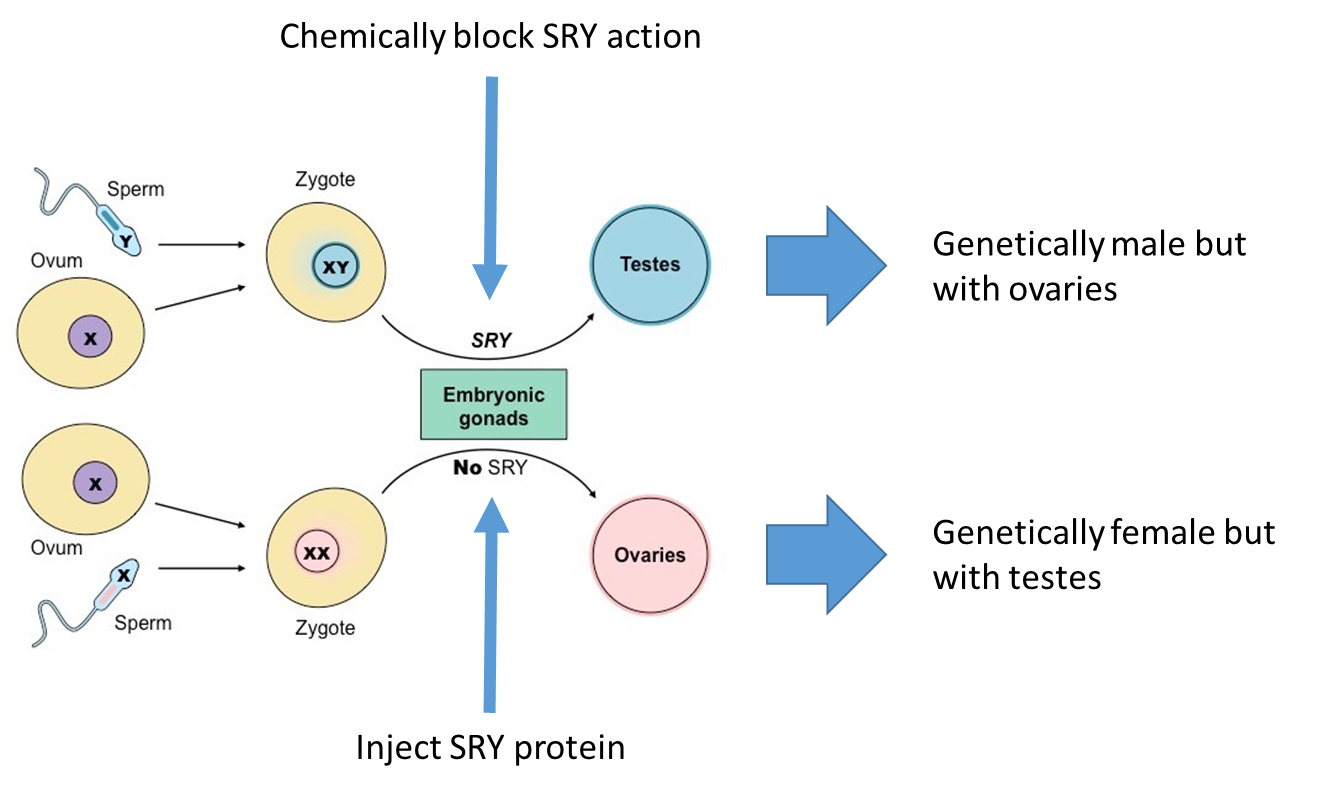
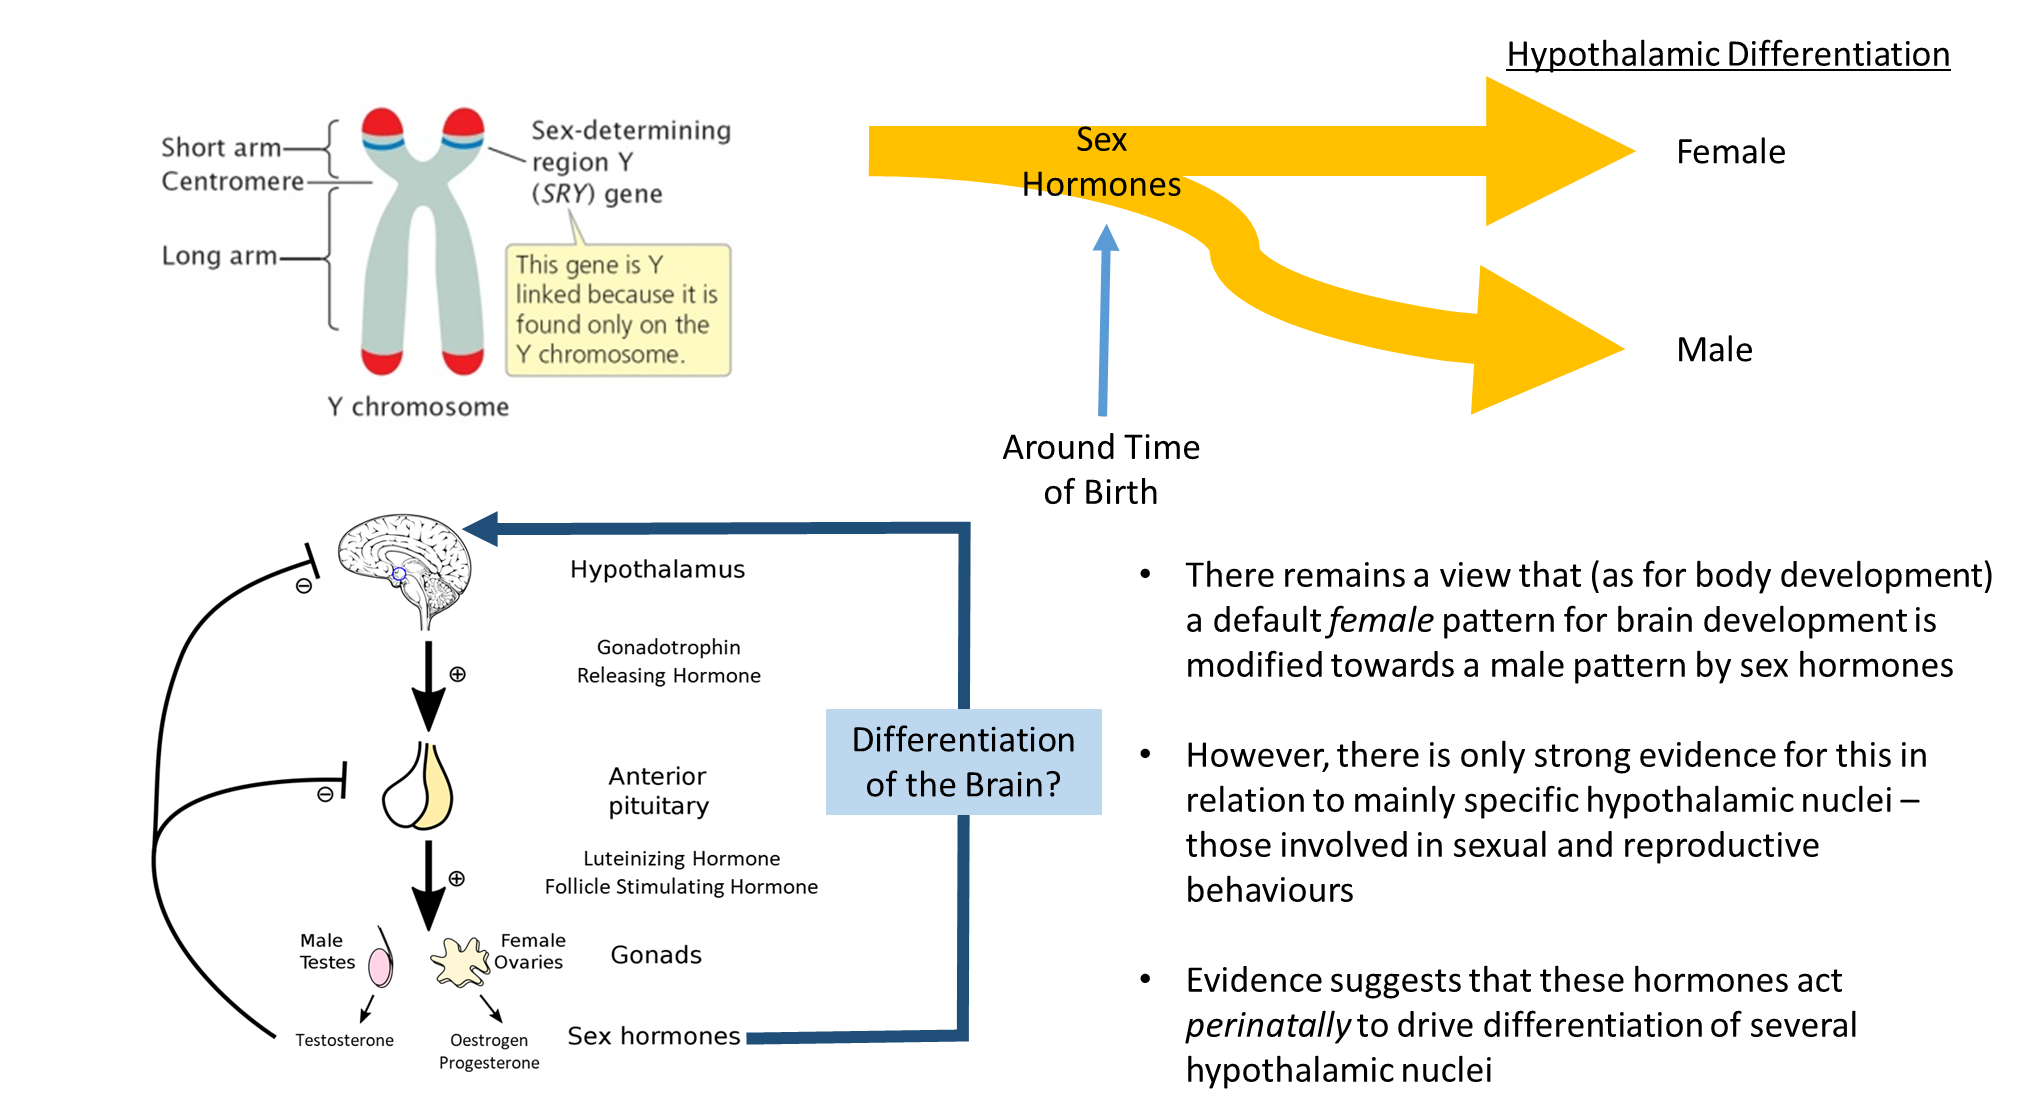
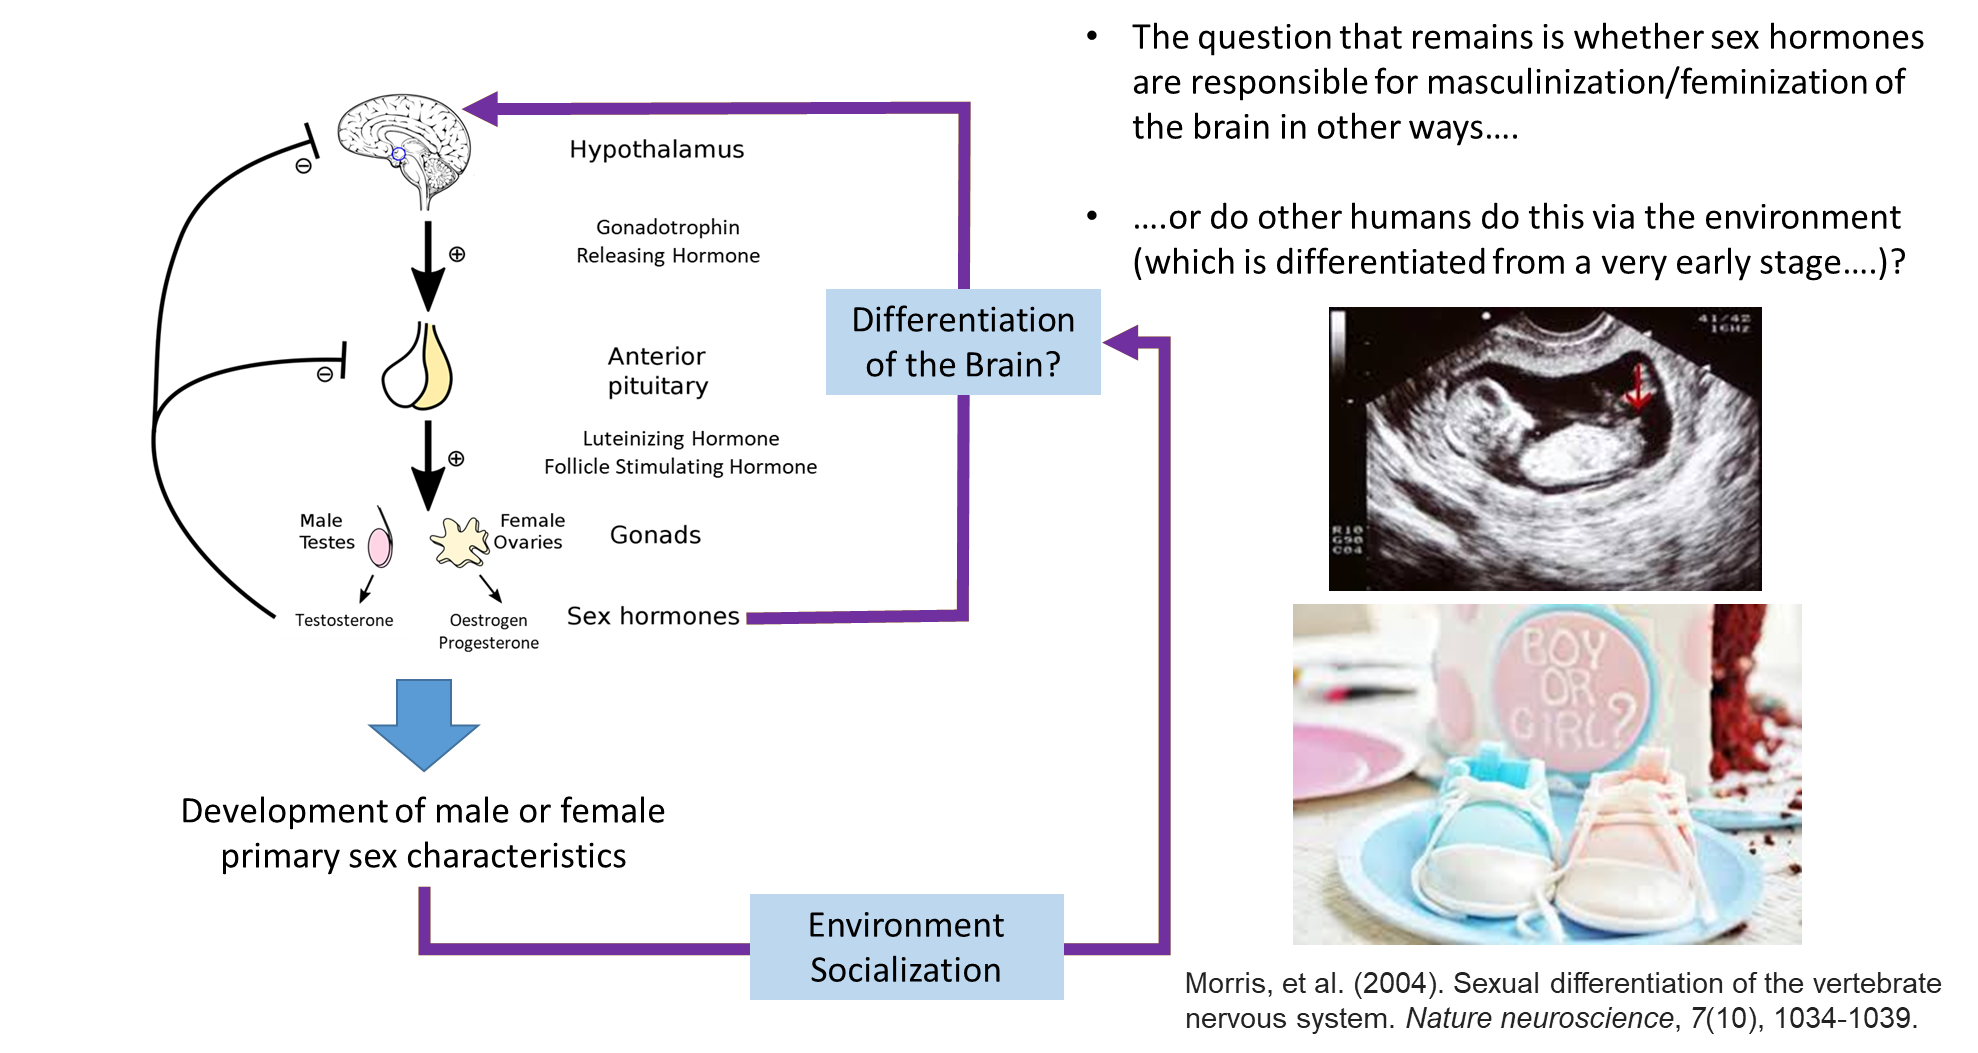
blocking the SRY action leads to genetic male but phonogenic female
injecting the SRY protein leads to the opposite

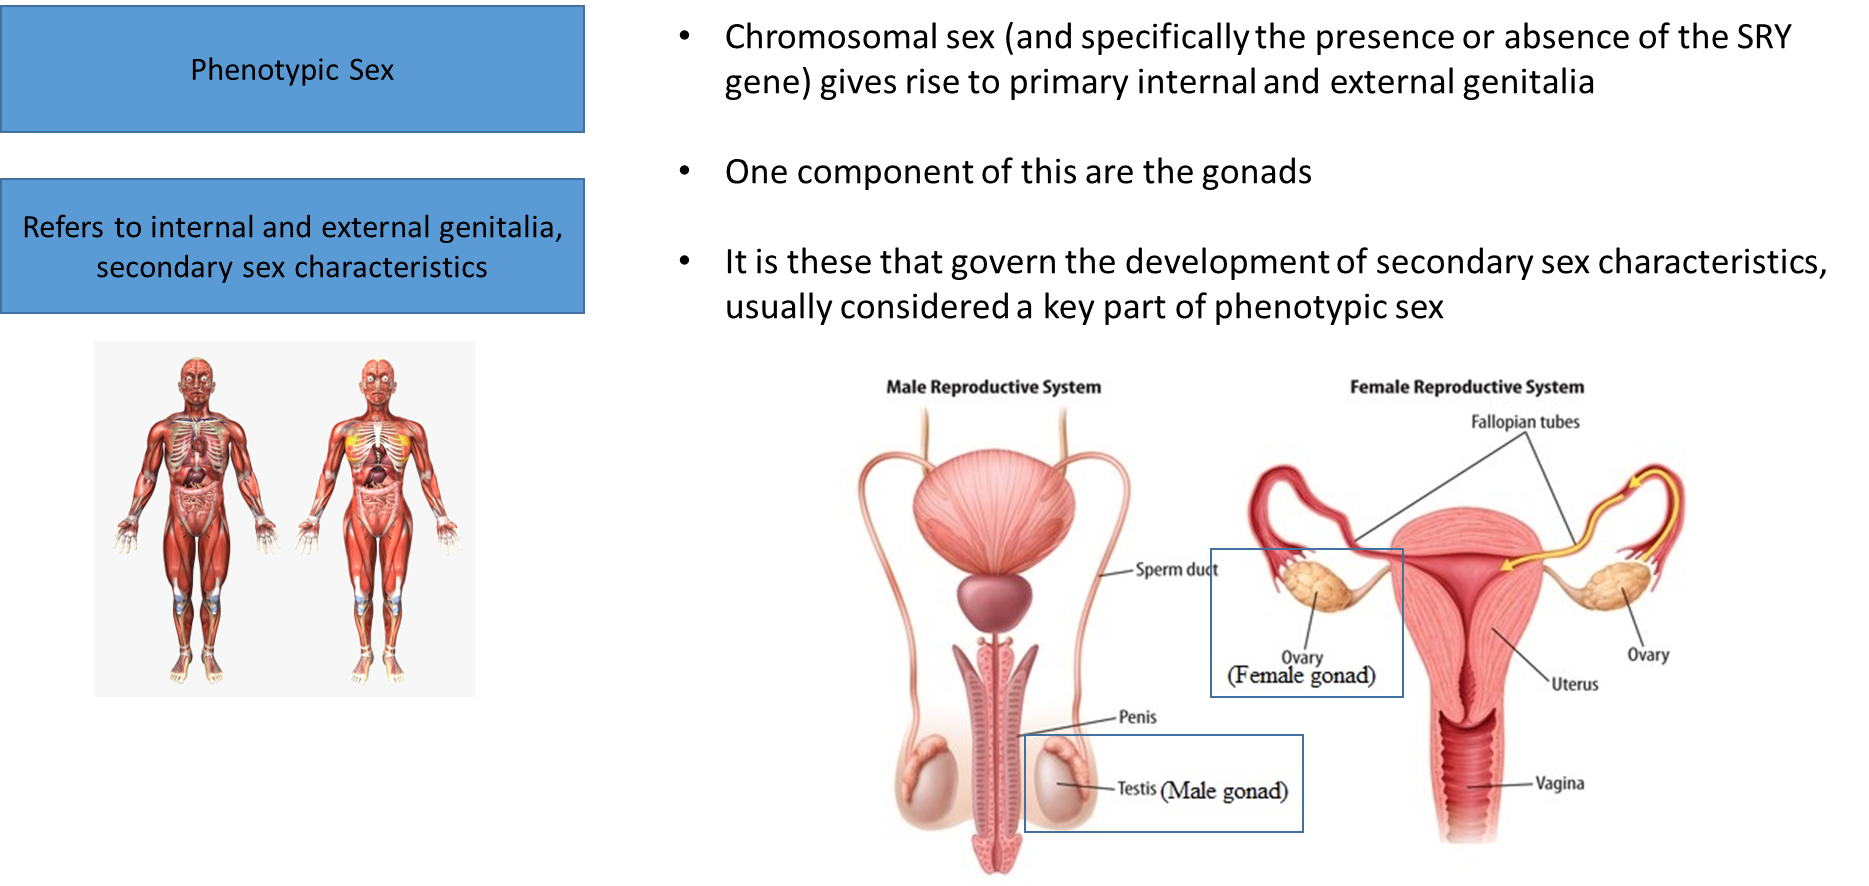
the SLY genes give way to the gonads
abnormalities in these areas become prominent in puberty, when that happens it is regulated by the brain
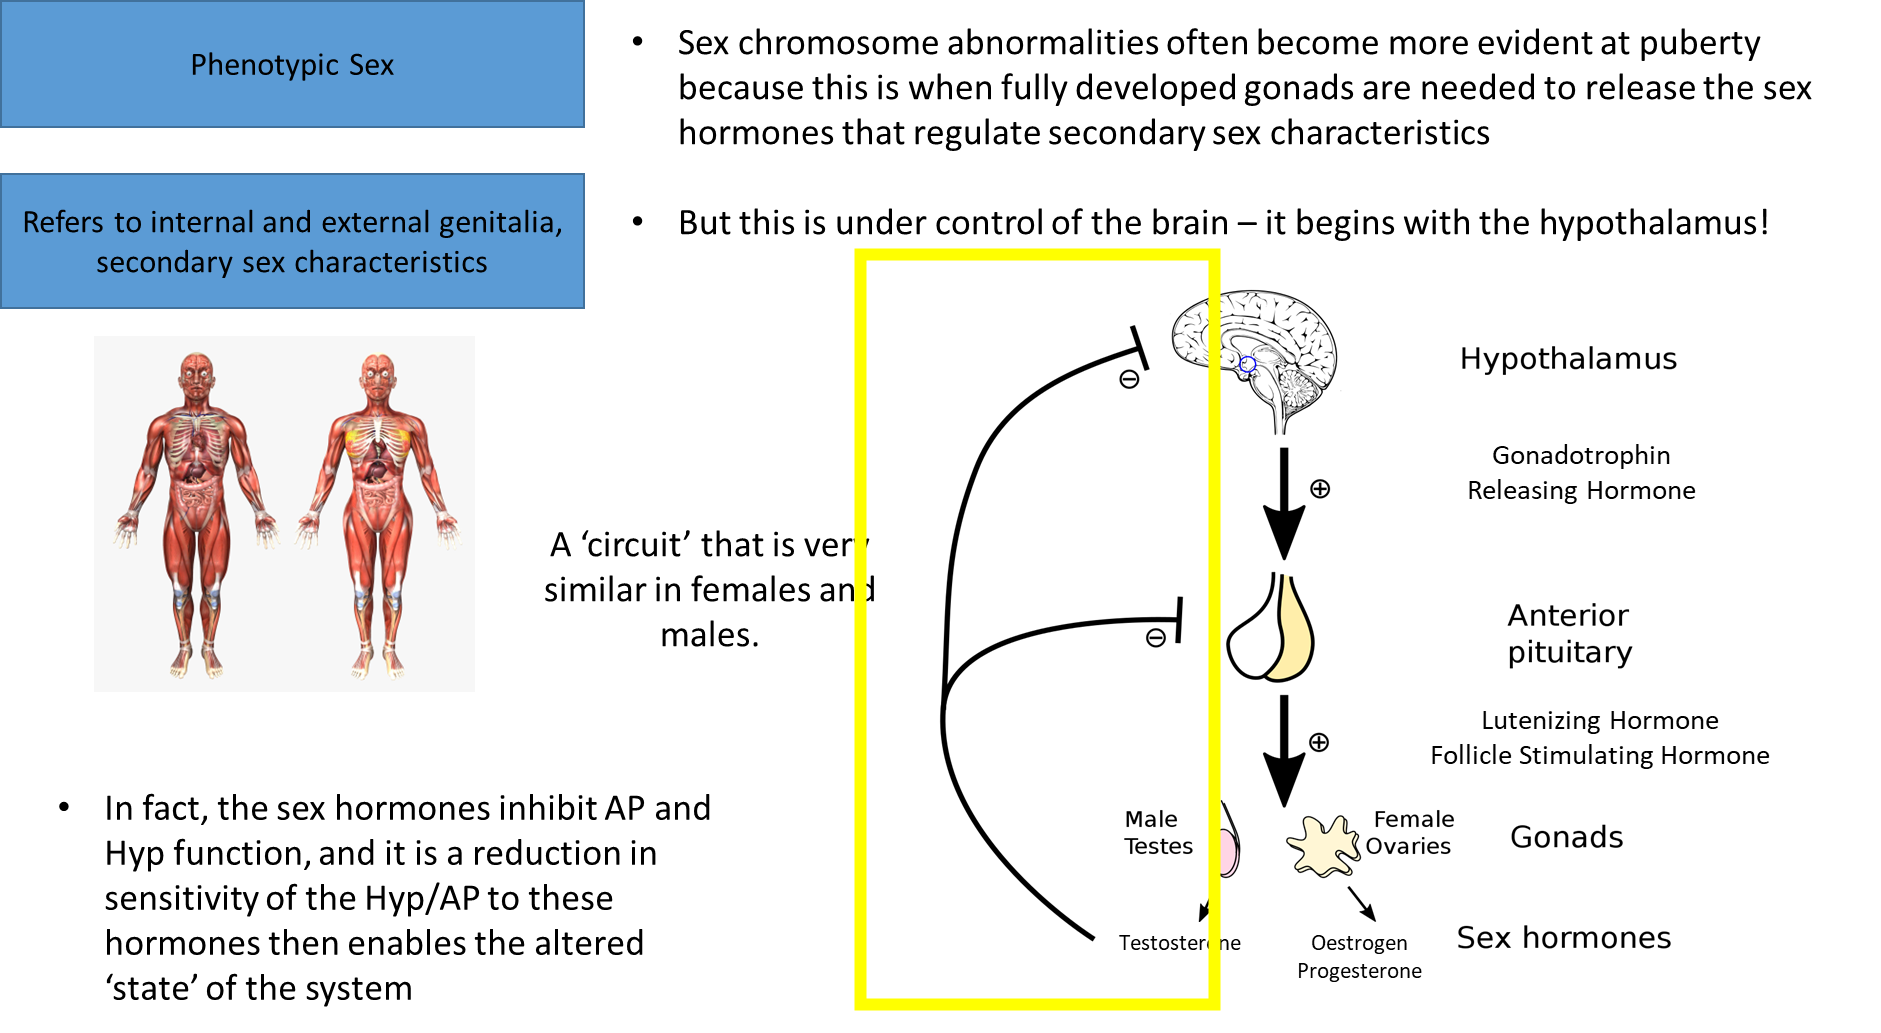
negative feedback cycle
won’t have the development of secondary sex characteristics until something changes
what changes once creeping closer to puberty is the hypothalamus starts disregarding this negative feedback loop, so there’s a decrease in sensitivity
it’s not a flood of this, it’s a pulsing release, there’s an increasing rate of release
this is similar to how the menstrual cycle works:
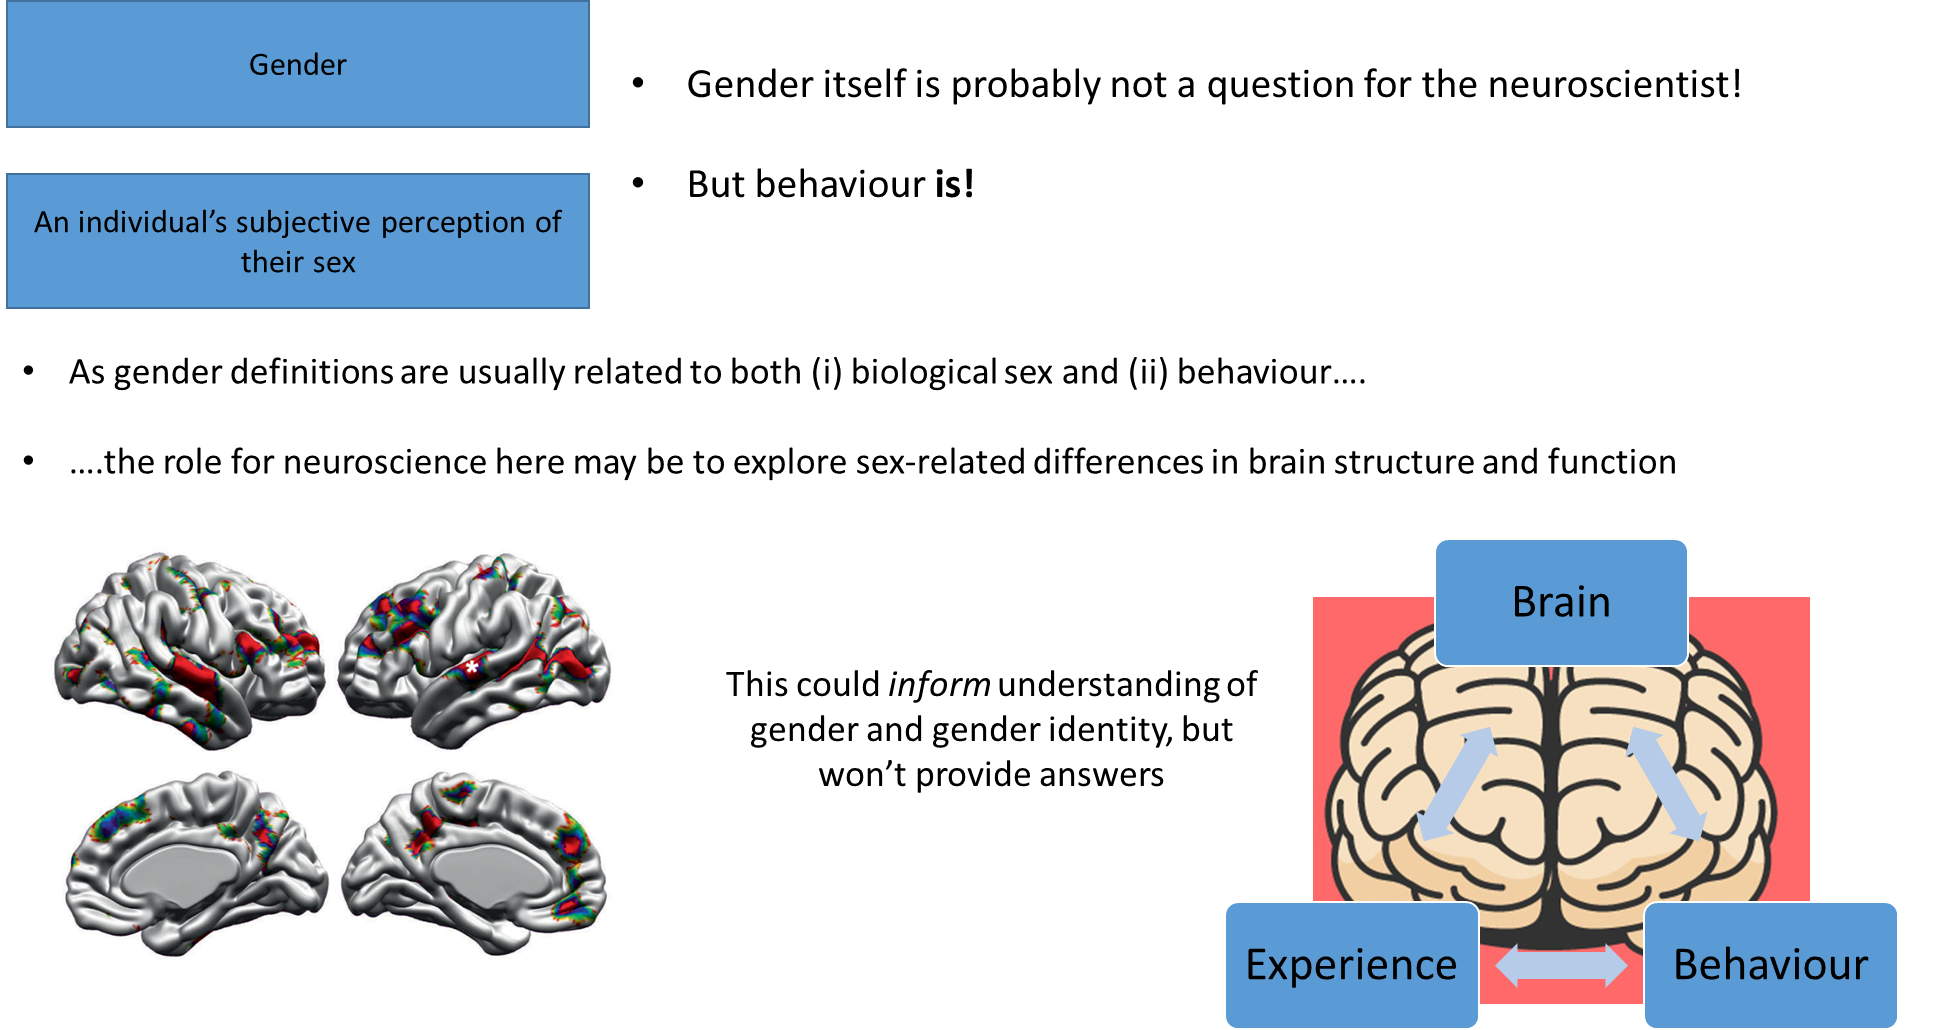
what about the brain?
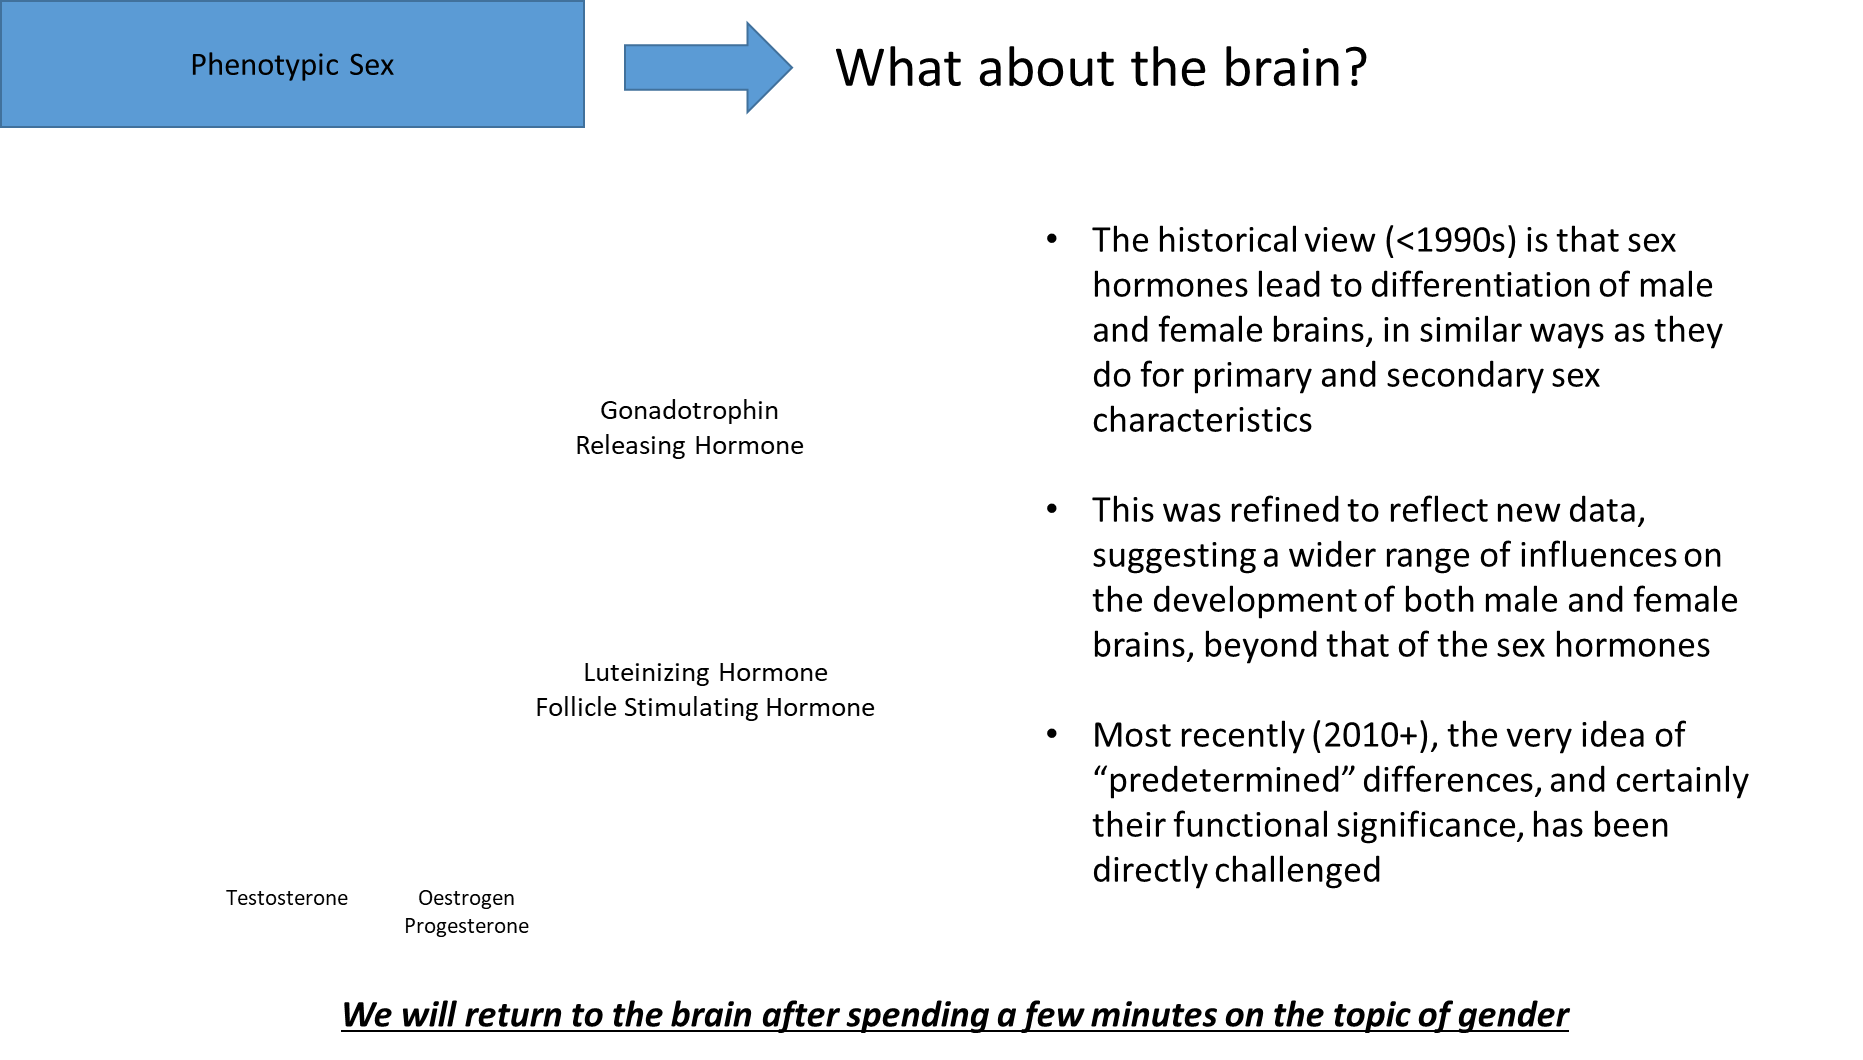
at the first stage it was refined
more recently, there’s more high quality evidence that shows difference within the brain based on separate sexes
there are lots of hormones that are not effected by sex

if stating it’s entirely socially constructed then no, however, like the slides shown, things like behaviour and relationships can be seen as emerging from the brain, which brings us back to the idea that psychologists and neuroscientists do have things to say about gender
however, neuroscientist are limited to just looking at behaviours really, particularly in animals, so they typically look at sexual behaviours, which does not directly encompass the concept of gender
Sex differences in the brain
male and female brains are different sizes on average, with male brains weighing about 10% more
most (approx 90%) of this difference is explained by differences in body mass (a relationship that exists across species)
are there other differences in brain structure or function?
yes, but what they are which are important and how they come about is very uncertain, despite decades of (sometimes too) enthusiastic research
sexually dymorphic nucleus in the brain, shows there are sex difference in brain areas
there’s a strong motivation to understand the difference, which has led to bad science as many scientists are effected by their own motives and opinions
Sex differences in the brain- bad science

motivations: charged with opinions, as humans are, scientists can begin their research with the wrong motivations either consciously or subconsciously attempting to support their preconceived opinions
bad designs: pea hacking? idk look it up, this sort of thing doesn’t tend to get published anymore
questionable comparisons: comparing animals with humans or sophisticated behaviours to gender or sexual attraction isn’t inherently wrong but needs a precise and particular way about it that justifies the statement
publication bias: papers get published if you find a significant result, now we’re paying more attention to the importance of publishing papers that find no significant effects, there are now ways to reduce publication bias through meta-analyses etc
Why should we care about sex differences in the brain?
there are many differences, like differences in diagnosis that have led to the underdiagnosis of females with autism for example
the only clear difference is the parts in the brain that cover the development of sexual behaviours

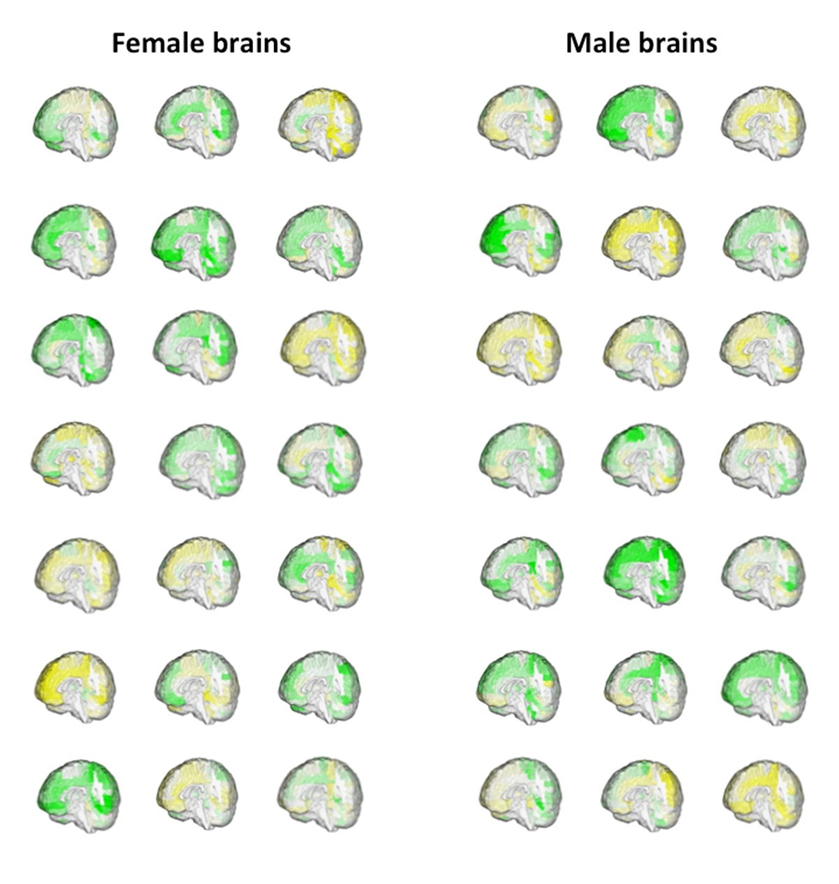
there are some brain structures that are typically separated by sex but people of another sex can have different brain structures, it’s not binary
Female- Male brain differences
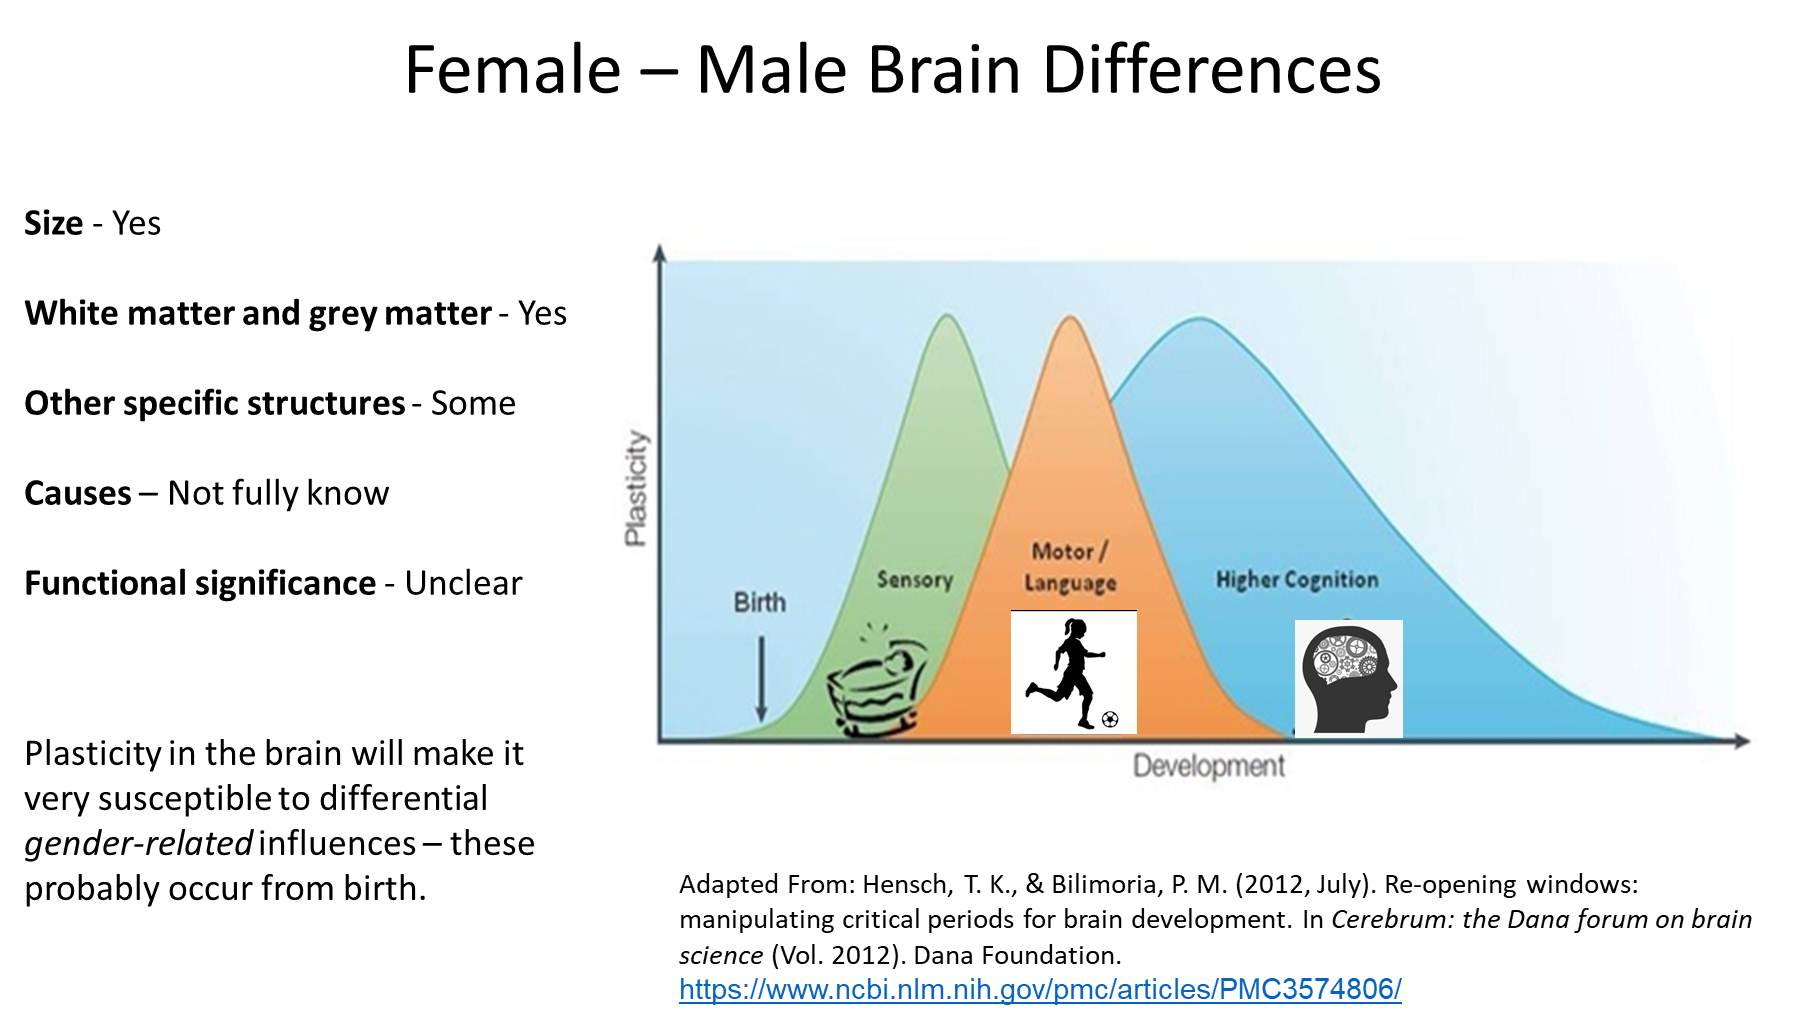
development before birth; there could be an effect here
afterwards, huge amounts of sensory development occurs, and there is so much developmental change beyond hormones
for example, if you’re teaching one 3 year old to teach a football from a young age, and not another, they will have a different neural connection regarding the sport and the movement to one another
Reading:
Bias in s/g-related brain findings
reporting bias
analyses that find a positive difference between the brains of men and women are likelier to be published than those that failed to find a significant difference.
This bias against publishing negative data, known as the “file drawer effect”, is coming under increasing scrutiny through systematic analysis and statistical proof of “excess significance” in the literature on brain abnormalities and cognitive science
Such analyses assume that multiple replications of the same study should produce a normal distribution of effect sizes around the pooled, meta-analytic mean. When the collection of pub lished effect sizes instead forms a skewed distribution, this provides evidence of excess publication of larger, statistically significant findings and conspicuous absence of smaller and non-significant findings. For comparisons of males and females, this bias leans toward the under-publication of similarity
and relative over-reporting of data that finds statistically significant s/g difference, perhaps reflecting the high public salience of s/g difference findings
publication bias
Direct evidence for publication bias comes from a recent meta- analysis of sex differences identified in 179 fMRI studies of brain activation. This analysis found no correlation between study size and the number of brain foci each study identified as showing statistically-significant s/g differences in activity.
This is contra the prediction that larger studies should detect a greater number of signif icant foci due to their greater statistical power. In addition, only 12 % of identified studies stated null s/g findings in their abstract, an “implausibly high” success rate given the overall distribution of findings.
s. David et al. (2018) concluded that the fMRI literature on brain sex difference is afflicted by reporting bias and excess significance, in part because post-hoc “subgroup analyses based on sex are always tempting to do and easy to perform.”
effect of reporting bias from other research generated through post-hoc comparison of male and female groups from large pre-existing dataset
an empirical assessment of 432 sex difference claims from 77 different gene-disease association studies found that the vast majority of such claims were “spurious” or inadequately documented, concluding that selective reporting has led to an excess of positive s/g effects in the published literature. Similar results emerged from a synthesis of randomized clinical trials by Wallach et al. (2016), which found that s/g treatment interactions were no more common than would be predicted by chance and were largely uncorroborated by meta-analysis. In other words, most appear to be false positives.
sex'/gender difference in global brain size
Research over many decades has found that global brain size is unambiguously larger in males.
This is usually reported as either total intracranial volume (ICV; often also abbreviated to TIV), or as total brain volume (TBV) which excludes the meninges and ventricles.
In a 2014 meta-analysis involving 77 studies and nearly 15,000 participants, Ruigrok et al. found that ICV is 12 % larger in males; A nearly identical difference in TBV (10.6 %) was reported in a large UK Biobank study (5,216 participants) published more recently
S/g difference in global brain volumes are present at all ages, although studies of infants and children are rarer and generally much smaller than studies of adults
w, Paus (2010) reported global brain vol ume as about 8% larger in male neonates, increasing to a peak of roughly 13 % during adolescence/early adulthood. More recently, Knickmeyer et al. (2017) imaged a large sample of neonates and found that ICV, total gray matter and total white matter are each about 5% larger in males, while Dean et al. (2018) reported a difference of 8% at one-month of age. Thus, the s/g difference in TBV is clearly present from birth and increases in magnitude during postnatal development.
Larger bodies require larger brains and the s/g difference in brain volume mostly parallels the divergence of male/female body size during development. Thus, newborn boys are about 4% heavier (Talge et al., 2014) than newborn girls, with the difference increasing to an average of 18 % greater weight and 9% greater height in adult males
With larger brains come larger raw volumes of each CNS compart ment in males: gray matter (GM), white matter (WM), and ventricular volumes
However, there are subtle differences in the way each compartment varies by s/g, with most studies reporting a higher ratio of GM-to-WM in females
The magnitude of this difference ranged from 4 to 7% across six studies
Thus, larger brains have a higher proportion of WM than smaller brains, regardless of sex or even species
Moreover, the GM/WM ratio is found to diverge the most after puberty, when sex differences in height and total brain size reach their peak. This non-linear scaling of WM to brain size is important when comparing the structural “connectome” between males and females
Are specific brain structures larger in men or women? origin of the term “sexual dimorphism” in the CNS
the search for human brain sexual dimorphisms has been based on the supposition that specific structures or circuits differ disproportionately between men and women in ways that will explain well-known behavioral s/g differences, such as empathy, spatial navigation, and gender identity itself
This paradigm has its roots in animal neurobiology, where certain brain areas are indeed dramatically larger in one sex, with clear links to behaviors such as courtship and mating. Thus, Nottebohm and Arnold (1976) first found that vocal control areas in the brain of canaries and zebra finches are as much as 6-fold larger in male birds, species in which only the males normally sing.
Another striking example is the spinal nucleus of the bulbocavernosus (SNB) in rodents, which innervates two muscles at the base of the penis and is clearly present in males’ lumbar spinal cord but barely visible in adult females (Breedlove and Arnold, 1980). Yet another structure is literally called the “sexually-dimorphic nucleus” (SDN) and is located in the anterior hypothalamus where it can measure up to 5-fold larger in male rats, compared to females
challenging notions regarding dimorphic structures
notions have challenged such dimorphic structures necessarily mediate sexually-differentiated behaviour
INAH-3
In the case of the SDN, the search for its human homologue took nearly 20 years to reach consensus, but was finally settled upon as the third interstitial nucleus of the anterior hypothalamus (INAH-3), a tiny (0.1 mm 3 ) subnucleus situated lateral to the much larger medial pre optic nucleus. Again, the magnitude of this difference is a fraction of the 5-fold rodent difference. Four different labs reported that the structure is larger in men, but the difference averages only 1.6-fold. Nor is there a clear relationship of INAH-3 volume to sexual behavior:
LeVay (1991) reported that the structure is smaller in homo sexual, compared to heterosexual men, whereas Byne et al. (2001) found no significant difference between such groups. With regard to gender identity, Garcia-Falgueras and Swaab (2008) reported reduced INAH-3 volume in a small sample of transgender women, but this has yet to be independently confirmed.
Small though it is, the reason INAH-3 has been so extensively studied is because this 60 % volume difference is by far the largest “sexual dimorphism” in the human brain. Nonetheless, the term is liberally applied to far more subtle male/female differences in human brain structure, neural activity, and even behavior.
Moreover, since the classic sexual dimorphisms in rodent and songbird brains were found to be influenced by early testosterone exposure (Arnold and Gorski, 1984), it is often assumed that any structural or functional differences between men and women’s brains are the product of gonadal hormones acting prenatally and/or post-puberty
“sexually dimorphic”
the common framing of human brains as “sexually dimorphic” is based on the model of X and Y chromosomes acting early in devel opment and largely by way of gonadal hormones to enhance or suppress the growth of specific structures, essentially bifurcating male and female brains into distinct forms
This binary classification has been widely extended to describe male-female neurophysiological or behavioral differences using the same adjective, “dimorphic”, even when the distribution of measures may be largely overlapping (Joel, 2011) and despite the caution urged by some in the field.
But as the remainder of this paper will demonstrate, such binary classification does not accord with actual measures of human brain s/g difference, which are generally small, unreliable, and insignificant once individual body size is accounted for
Scaling issue in the comparison of female and male brains
Recognizing that brain size is related to body size and that human bodies are indeed sexually dimorphic, neuroscientists have struggled to find ways of comparing brain structures between men and women that don’t merely reflect bodily size differences.
Thus, every major study confirms that it is not only global measures like ICV, TBV, total GM, total WM and CSF volume that are larger in males, but every zone of the cerebral cortex and every subcortical structure, when reported as “raw,” “native,” or “uncorrected” volume
effect of brain segmentation method on male-female comparisons
Due to the inherent variability be tween individual brains, every automated fitting produces some distortion, which may affect male or female brains differently depending on the degree of registration and idiosyncrasies of the template used. Not only are such templates unique to each analysis package, they are themselves constructed from a finite population of “normal” brains, often based on unequal numbers of males and females. The magnitude of this problem is further illustrated by the substantial differences between brain templates constructed from different ethnic populations
Such distortions have been demonstrated in various studies that have compared automated segmentation to manual tracing, still considered the “gold standard” for brain morphometry. Thus, Morey et al. (2009) found that two surface-based methods, FreeSurfer and FIRST/FSL, both inflate subcortical volumes by 4–9 %, with Freesurfer producing greater inflation of the amygdala and FIRST inflating the hippocampus to a greater degree
Grimm et al. (2015) compared VBM and Freesurfer to manual measurement of the same two structures and found that both programs deviated from manual tracing, with the accuracy of each method varying by structure. (VBM was more accurate for the amygdala, Freesurfer for the hippocampus.) More recently, Makowski et al. (2018) extended this comparison to the striatum, pallidum, and thalamus and found again that FSL and Freesurfer overestimate these volumes, with the error greater for smaller (e.g., pallidum) compared to larger structures
By contrast, comparison of Freesurfer and manual volumetry on cortical structures (frontal gyri) found that Freesurfer produced systematically smaller volumes, with much smaller variance than manual methods, perhaps reflecting registration to a template that inadequately reflects the diversity of human frontal cortex
It is not known whether these distortions differentially affect the measurement of male versus female brain structures, but the fact that automated errors are greater for smaller structures suggests that they may. Indeed, in their meta-analyses of amygdala volume sex difference, Marwha et al. (2017) found smaller male-female differences among studies using manual, as opposed to automated segmentation, whether the data were reported as raw volumes or as volumes normalized to ICV or TBV. Kennedy et al. (2009) similarly found discrepancies between VBM and manual measurements of cortical structures such that “sex differences all but disappeared” when manually-determined ICV was used as a covariate.
survey of structural brain sex/ gender differences
no studies compare the ACTUAL shape of brain structures between males and females, but hundreds have compared structure size, so we the survey uses studies that report on volume, thickness or cross sectional area of specific brain structures.
Negligible differences in subcortical structural volumes
33 studies compared the volume of subcortical structures between females and males after normalising individual ICV or TBV. No subcortical structure has been found larger in females or males across all studies
the next structures to be declared sexually-dimorphic were the hippocampus and amygdala
Cahill (2006) depicted a mid-sagittal brain with many structures shown in pink (larger in women) and others shown in blue (larger in men). Although widely-reproduced, this figure was based on just one small study in which most s/g differences were not statistically significant
Claims about hippocampal and amygdala volume differences have also penetrated popular reporting, where they have been invoked to explain male-female differences in learning and emotion
However, these assertions ignore larger and more recent studies that have failed to confirm male/female differences in either hippocampal or amygdala volume
The largest single study (Ritchie et al., 2018) found no difference in TBV-corrected hippocampal volume, whereas a meta-analysis of 29 studies found a mere 0.6 %, non-significant difference in hippocampal volume between males and females
Thus, although often portrayed as settled science, s/g difference in amygdala volume is very modest, and its significance is highly sensitive to brain size correction method.
The caudate nucleus is another structure long described as sexually- dimorphic: proportionally larger in females and speculated to contribute to their lower risk for ADHD
this claim is still referenced to a few early and very small studies, whereas larger and more recent studies have failed to confirm it. It is possible the effect is confined to childhood and early adolescence, since three studies report a larger ICV-corrected caudate volume in girls averaging 15 years of age.
Given the substantial data indicating an absence of caudate volume difference between adult men and women, any dif ference in adolescence could be a fleeting effect of girls’ earlier entry into puberty.
the findings on other subcortical structures—including the pallidum, thalamus, cerebellum and nucleus accum bens—also fail to demonstrate consistent s/g differences in volume.
small effects and poor consensus for regional cortical volumes
25 large or highly-cited studies that have reported on regional volume s/g differences since the year 2000. The average age of participants ranged from birth to late middle-age and the image analysis and brain size correction methods are also diverse. All of these factors could contribute to the wide range of results reported. Nonetheless, the simplest conclusion from this sizeable collection is that no particular gyri are reliably larger in males or females. In most studies, the majority of cortical volumes do not differ significantly (after correcting for overall brain size), and the differences reported in individual studies have been reproduced only sporadically in other studies.
The majority of studies used either covariance or atlas-based methods to normalize for overall brain size, but findings within these subgroups are not well aligned, as discussed below. Finally, four studies compared cortical volumes between male and female brains that were pre-matched for TBV or ICV (e.g., larger female compared to smaller male brains). This procedure eliminates the brain size normalization step entirely and is considered the gold standard for removing the influence of body size on brain s/g comparisons
3/5 most recent studies in Table 3 each included more than 2,700 participants. Of these, there is reasonable agreement be tween the two that used Freesurfer to perform cortical segmentation: studying 5,216 men and women and correcting for TBV covariance, Ritchie et al. (2018) found no s/g volume difference in 65 % of cortical regions, whereas 20 % of regions were larger in males and 15 % of regions were larger in females.
These two studies agree in finding slightly larger volumes in males’ fusiform, entorhinal, medial orbito frontal, and lateral occipital gyri, together with the cingulate isthmus. Both studies also agree in finding larger volumes in females’ superior parietal lobules and caudal medial frontal gyri.
The two largest such studies, a meta-analysis by Ruigrok et al. (2014) and an empirical study by Lotze et al. (2019), found some similarities: greater male volumes of the anterior parahippocampal gyrus; greater female volumes in select pre frontal, inferior parietal, superior temporal and cingulate cortices, overlooking several laterality discrepancies. But these studies diverged regarding many other structures: frontal pole, superior parietal lobule, precuneus, insula, fusiform and several occipital gyri.
Thus, even among some impressively large studies, the specific findings about cortical regions expanded in men or women do not replicate between them and especially, across studies using different MRI processing pipelines
In sum, MRI studies over the past two decades have failed to find evidence of universal s/g difference in the volumes of specific cortical regions. Even when we restrict our view to the largest and most recent studies, s/g differences are very small and markedly discrepant across populations and image analysis methods. They are not, in other words, species-wide s/g differences, nor do most findings align with predicted areas of cortical s/g difference based on well-described behavioural differences between men and women
Cortical thickness: conflict between MRI and post mortem measures
often said to vary s/g, with most stating it is greater in females
M/F difference in grey matter thickness has been proposed to contribute to gender differences in behaviour and cognition, including gender identity
focal changes in cortical thickness have been identified after brain training regimens such as motor learning (Sale et al., 2017), so it is reasonable to expect that differences in life experience between men and women will be reflected in this measure, at least in certain brain areas.
However, a synthesis of current findings does not show reproducible differences in cortical thickness between males and females, either globally or in specific cortical zones. The earliest measures of cortical thickness were taken in postmortem histological studies, none of which detected significant male/female differences. Due to the pains taking nature of such measurement, such studies tend to be small.
even the largest one found only a 4% average difference thicker in men
Now with the use of MRI measurement, more explicit claims of s/g difference in cortical thickness have emerged
21 highly-cited or recent MRI studies that have addressed the question, about evenly divided between finding no difference or greater thickness in females. Only four MRI studies report significantly greater cortical thickness in males, though not at all ages. Raznahan et al. (2010) reported thicker grey matter in most cortical areas in adolescent boys
however, other studies of adolescents report no difference or greater thickness in girls.
The only study to address the issue in infants (0–2 years) found no difference in cortical thickness or in the structural and functional networks that correlate with it
Finally, a recent study reported greater thickness in male adults within two different populations (Chinese and American), but the precise regions differing between men and women showed no agreement across populations
10 independent studies, including those based on the largest samples, report predominantly thicker cerebral cortex in females (Table 4), albeit the difference is small
Unlike measures of regional brain volumes or surface area, cortical thickness is largely insensitive to TBV or ICV. According to Im et al. (2008), one consequence of this lack of scaling is that studies that do normalize cortical thickness by ICV or TBV end up over-correcting s/g difference, leading to an exaggeration of female advantage.
existing data do not demonstrate a reliable s/g difference in cortical thickness. Although several large studies found it is greater in females, all were performed using Freesurfer, whereas other large MRI studies that used different segmentation methods found either no difference or greater thickness in males
Freesurfer accuracy is further questioned by Govindarajan et al. (2014), who found significant s/g differences in scattered cortical regions measured in a 1.5 T scanner, but no difference in a separate cohort scanned with the higher resolution afforded by a 3 T magnet.
the fact that MRI analyses lean toward greater thickness in females whereas post-mortem histology finds slightly greater thickness in males should give us pause, since the latter has higher resolution and is arguably the gold standard for assessing tissue thickness.
Interhemispheric connections: corpus callosum, anterior commissure, interthalamic adhesion
before the focus on cortical structure, it was often claimed that women have larger corpus callosum than men. With the use of anterior commis sure and interthalamic adhesion, corpus callosum morphology, it is argued that women have stronger interhemispheric connections and thus less lateralised cerebral function than men
The original claim that women have a larger corpus callosum was based on a mere 14 brains, however, the actual findings were controversial from the start
The researchers did not actually find a difference in total corpus callosum cross-sectional area, but only a marginal difference in the splenium (p = 0.08). Although the same authors did extend their finding to total callosal area, other neuroanatomists reported null or opposite effects
According to one influential hypothesis, prenatal testosterone enhances pruning of callosal axons, such that males end up with fewer interhemispheric connections and greater structural and functional lateralization.
The fact that corpus callosum area and volume are sensitive to overall brain size led several groups to formally assess this relationship across sexes. J¨ancke et al. (1997) were the first to show that larger brains have proportionally smaller corpus callosa irrespective of s/g, a result replicated by Leonard et al. (2008) and hypothesized to be due to the relative inefficiency of callosal transfer in bigger brains
This was confirmed by Luders et al. (2014) who found that the s/g difference in corpus callosum thickness disappeared when male and female brains were selected to match in intracranial volume
However, two other analyses of males and females matched for ICV came to diametrically opposite conclusions: Sullivan et al. (2001) reported larger corpus callosum area in males, whereas Ardekani et al. (2013) and Shiino et al. (2017), studying the same sample, reported larger callosal area in females.
Focusing on the six largest studies (Table 5C), five have found no sex difference in corpus callosum area or volume
Most recently, Potvin et al. (2016, 2018b) published normative MRI results from a very large sample (2,790 participants) which detected a significant, but only slightly larger corpus callosum volume in females, with sex accounting for less than 1% of the variance in that population
Diffusion tensor imaging (DTI) is now permitting a more refined analysis of the corpus callosum and other white matter tracts. In a recent study of 433 young adults, Bj¨ ornholm et al. (2017) found no significant difference in mean diffusivity (MD; a measure of white matter integrity) of the corpus callosum and small, spotty differences in fractional anisotropy (FA; a measure that integrates fiber density and myelination) but a significantly higher magnetization transfer ratio (MTR) in males.
Is the s/g difference in the corpus callosum present in early life?
This would address the hypothesis that prenatal testosterone triggers pruning of interhemispheric fibers
Over the past three decades many studies have assessed mal e/female difference in the corpus callosum during fetal and childhood development, most using sample sizes too small to detect the modest effect sizes cited above. Nonetheless, the fact that 9 out of 13 studies of fetuses and children find no significant male/female difference, and the two largest of these studies reported opposite findings, does not support this claim
As direct evidence against the pruning hypothesis, one study actually measured fetal amniotic testosterone levels and found no cor relation with corpus callosum area in boys at ages 8–11
The anterior commissure (AC)
next largest connection between left and right cerebral hemisphere
has been long claimed to differ between males and females; that females have stronger inter-hemispheric connectivity
however, the first study of AC cross-sectional area actually found it was larger in males
This was followed by two studies reporting larger AC area in females. Then came two studies finding no s/g difference.
In 2011, Choi et al. published the first MRI analysis of AC volume found no s/g difference in young adults but a larger AC volume in middle-aged women than men (after ICV covariance). Taken together, these six studies provide weak support, at best, for the claim of s/g difference in AC area or volume.
Massa intermedia
also known as the interthalamic adhesion
is a small bridge of glia connecting the left and right thalamus that is entirely absent in 2–22% of healthy brains
does differ reliably between males and females
In their first analysis of the AC, Allen and Gorski (1991) also found that the ITA is larger and more often present in the brains of women than men, noting similar findings dating back to the 1940s
This has been confirmed by more recent studies, most of which have found that the ITA is more often present and/or is larger in women. However, in the largest and most recent report, Damle et al. (2017) used 3 T MRI and found no difference in ITA absence (both were only 4%) between males and females, albeit a 14 % larger ITA area in women
this finding thus appears reliable, although little research has addressed the possibility that ITA presence and size are affected by overall brain size. That is, if larger brains are less able to mechanically support this small bridge across the third ventricle, the size and presence of ITA may be a function of brain geometry, not s/g per se.
Only one study has examined this issue (Nopoulos et al., 2001) and found no relationship between ITA presence and TBV, but further examination is warranted. Of note, ITA absence has been associated with a greater incidence of schizophrenic disorders in both men and women, perhaps reflecting global brain atrophy
sex/gender difference in brain lateralisation and asymmetry
the most prominent “sexual dimorphism” claimed for the human brain: that men’s brains operate in a meaningfully more lateralized or asymmetric manner than women’s.
The idea that cerebral lateralization differs between men and women was propelled by two seminal papers in the early 1980s. The first was a survey of sex findings on lateralization by McGlone (1980) and the second was a wide-ranging theory of cerebral lateralization introduced by Geschwind and Behan (1982). McGlone (1980) relied heavily on clinical reports to argue that women are less lateralized for language and (to a lesser extent) spatial tasks than men; according to her review, left hemisphere lesions were more likely to result in aphasia when they occurred in males, compared to females. Geschwind and colleagues were focused on the mechanism of lateralization itself, which they hypothesized to involve prenatal testosterone and to be less pro nounced in males. Both theories have been highly cited over the past 40 years.
BUT neither theory has held up to critical analysis.
Clinical research—based on large studies of the incidence, type, and recovery from aphasia following left hemisphere damage—has not supported the claim that women are less left-dominant for language than men. Nor do fMRI studies of language lateralization demonstrate a reliable s/g difference.
A subsequent meta-analysis of 26 studies found no s/g difference in the degree of lateralized activation during language processing
On the other hand, a more recent study of 2,337 young adults did detect significantly lower (d=-0.22) planum temporale asymmetry in women, as would be predicted if language were modestly less lateralized in females.
Hiscock and colleagues concluded that the s/g effect is a weak, population-level difference, accounting for just 1–2 % of the total variance in laterality.
Voyer (1996) came to a similar conclusion based on meta-analysis of 396 comparisons in 266 studies, which calculated a pooled s/g difference in laterality of about d = 0.08, accounting for just 0.1 % of the population variance.
A comparably small effect size (d = 0.09) was reported for the sex difference in dichotic listening according to meta-analysis by Sommer et al. (2008).
Voyer also looked at publication bias and concluded that even the tiny 0.08 effect size is likely on over-estimate based on the under-publication of null effects
how is left-handedness a challenge for the theory of greater male lateralisation
it’s generally more common in males and is regarded as a sign of reduced cerebral dominance
Sommer et al (2008): based on nearly a quarter-million participants, non-right handedness is 25 % more prevalent in males.
this inspired Geschwind and Galburda to propose a model that males are less likely to develop the species-typical, left-hemisphere dominance, leading to a greater pro pensity for both left-handedness and various language-related disorders (e.g., dyslexia, stuttering, and autism). Specifically, they proposed that prenatal testosterone slows the growth of the left hemisphere such that males are relatively more right-hemisphere dominant than females, leading to more left-handedness, poorer language skill, and stronger spatial skill
in-depth reviews and meta-analyses found a lack of solid evidence for this theory
How is using resting FMRI connectivity an issue of s/g difference in lateralisation?
One of the first such studies, by Liu et al. (2009), found a greater degree of laterality among 131 male, compared to 169 female participants, although both groups exhibited the same left dominant activity in language and midline structures versus right-dominant activity in visual, parietal and insular cortices.
Using a different, voxel-based activity measure on a sample of 913 young adults, Tomasi and Volkow (2012b) also found hemispheric dominance patterns to be largely similar between males and females even though their paper emphasized small islands of laterality differences within occipital, temporal, and frontal cortices.
In a study of 603 participants, Agcaoglu et al. (2015) analyzed the lateralization patterns of different resting state networks and found they were largely similar between males and females, except for two minor differences that did not survive correction for false discovery.
Finally, in the largest analysis of this type, Nielsen et al. (2013) used resting state functional connectivity to examine left- versus right-brain dominance in a sample of 1011 young adults; here again, distinct networks show different patterns of lateralization, but there was no difference be tween males and females in these patterns.
It is notable that two of these studies of resting network lateralization used data from the same, 1000 Functional Connectomes Project, demonstrating how different methods of connectivity analysis can create or eliminate small s/g difference depending on the processing pipeline. Thus, the s/g findings of connection laterality are not robust across analysis methods, even using nearly identical participant samples.
Taken together, these various measures of cerebral later alization—including clinical, behavioral, anatomical, and resting ac tivity measures—demonstrate slight, if any, difference between men and women in the degree of functional hemispheric asymmetry
Sex/ gender difference in neural connectivity
sex/ gender effects on the structural connectome
Altogether we identified 31 large or highly-cited studies that assessed sex /gender difference in the human connectome, 11 of which analyzed the structural connectome in adults. 6 of these 11 reported either no male/female differences or minor local differences in the face of global similarity in modularity and “small-world” topology, meaning an organization dominated by local nodes with high levels of nearby connections. In addition, three of the studies reported higher average efficiency of networks in female brains, as emphasized in a review by Gong et al. (2011) but notably not replicated in two later studies
One structural connectome analysis received broad coverage and has been widely accepted as the definitive s/g difference in brain connectivity. The study, by Ingalhali kar et al. (2014), did not report on network efficiency but instead focused on the contrast between intra-hemispheric connectivity, which was greater in males, versus interhemispheric connectivity, which was greater in females.
In summary, estimates of brain connectivity based on structural MRI and DTI measures have not converged on a reliable pattern of s/g difference. Several studies report greater local efficiency in females’ brain networks, but the specific locales of such connections do not agree across studies. Larger brains appear to exhibit relatively more intra- than inter-hemispheric connectivity, but this is not a function of s/ g itself.
Even the rawer DTI measure of white matter integrity, functional anisotropy (FA), has been reported as globally greater in males in some studies but females in others. Notably, sex differences in FA are largely eliminated after controlling for ICV. Thus, it is un surprising that the structural connectome, which in most cases is derived from DTI measures, fails to exhibit reliable s/g differences, especially when controlling for brain size.
Sex/ gender effects on the functional connectome
15 large or highly-cited studies reporting male-female comparisons. All of these originate with measures of resting state or “intrinsic” fMRI—that is, blood-oxygen level detection (BOLD) in awake subjects who are lying still in the scanner, without a specific mental task to complete. However, their wide variety of analytic approaches and lack of standardized dependent measures has resulted in a disparate collection of findings with little consensus on s/g difference in the functional connectome.
two of the earliest and smallest (N < 50) studies reported no or very small male-female differences in resting connectivity based on independent component analysis (ICA) of fMRI data.
Where small differences were found by Bluhm et al. (2008) they were confined to the default mode network (DMN), a collection of largely midline structures thought to underlie the brain’s “idling” state.
DMN connectivity was higher in fe males in Bluhm et al. (2008), however, the specific circuits varied ac cording to analysis method: ICA resulted in s/g differences in the bilateral superior frontal gyri whereas seed-based connectivity found differences in the medial prefrontal cortex.
Biswal et al. (2010) published a massive analysis of the functional connectome in a study of 1,414 adults collected from 35 different international research centers. Using three distinct statistical methods (seed-based, ICA, and frequency-domain analyses), they found small s/g differences in the connectome, with some brain areas showing stronger connectivity in males and others stronger in females. For any given brain region, Gaussian plots showed more than 80 % overlap in connectivity between male and female groups.
Taken together, clinical, behavioral, anatomical, and resting activity measures demonstrate slight, if any, difference between men and women in the degree of functional hemispheric asymmetry. Although s/g effects on lateralized brain function have been extensively analyzed over many decades, the collective data do not support the widespread belief that males’ brains are meaningfully more lateralized than females’
sex/ gender differences in neural connectivity
sex/ gender effects on the structural connectome
one structural connectome analysis received broad coverage and has been widely accepted as the definitive s/g difference in brain connectivity. Ingalhali kar et al. (2014), did not report on network efficiency but instead focused on the contrast between intra-hemispheric connectivity, which was greater in males, Vs interhemispheric connectivity, which was greater in females.
most of the s/g effect sizes in Ingalhalikar et al. (2014) were small, suggesting a very large sample was needed to detect them.
However, subsequent analysis by H¨ anggi et al. (2014) was able to reproduce the intra- versus inter-hemispheric s/g contrast with just 138 participants. The caveat is that H¨anggi et al. (2014) demonstrated that this contrast is a function of brain size, not s/g per se. Thus, they showed that larger brains have relatively lower inter-hemispheric connectivity and proportionally higher intra-hemispheric connectivity than smaller brains, regardless of s/g.
In summary, estimates of brain connectivity based on structural MRI and DTI measures have not converged on a reliable pattern of s/g difference. Several studies report greater local (but not global) efficiency in females’ brain networks, but the specific locales of such connections do not agree across studies. Larger brains appear to exhibit relatively more intra- than inter-hemispheric connectivity, but this is not a function of s/ g itself. Even the rawer DTI measure of white matter integrity, functional anisotropy (FA), has been reported as globally greater in males in some studies but females in others. Notably, sex differences in FA are largely eliminated after controlling for ICV. Thus, it is unsurprising that the structural connectome, which in most cases is derived from DTI measures, fails to exhibit reliable s/g differences, especially when controlling for brain size.
sex/ gender effects on the functional connectome
two of the earliest and smallest (N < 50) studies reported no (Weissman-Fogel et al., 2010) or very small (Bluhm et al., 2008) male-female differences in resting connectivity based on independent component analysis (ICA) of fMRI data. Where small differences were found by Bluhm et al. (2008) they were confined to the default mode network (DMN), a collection of largely midline structures thought to underlie the brain’s “idling” state. DMN connectivity was higher in females in Bluhm et al. (2008), however, the specific circuits varied ac cording to analysis method: ICA resulted in s/g differences in the bilateral superior frontal gyri whereas seed-based connectivity found differences in the medial prefrontal cortex.
Biswal et al. (2010) published a massive analysis of the functional connectome in a study of 1,414 adults collected from 35 different international research centers. Using three distinct statistical methods, they found small s/g differences in the connectome, with some brain areas showing stronger connectivity in males and others stronger in females.
For any given brain region, Gaussian plots showed more than 80 % overlap in connectivity between male and female groups. Importantly, supplemental data showed that correspondence between the three statistical analyses depends on exactly which of the six seed areas or 20 principal components are analyzed.
Among the nine largest studies, consensus can be found among six that report stronger DMN connectivity in females. However, there are many discrepancies, even between studies that use the same 1000 Functional Connectome database.
For example, Tomasi and Volkow (2012a) found higher connectivity densities across many regions in fe males, but no regions of higher connectivity in males. This contrasts starkly with Biswal et al. (2010) and Zuo et al. (2012), who used the same database but found some nodes of higher connectivity in females and other nodes in males.
Thus, several large studies find evidence for greater within-network connectivity in female brains and between-network connectivity in male brains, indicating greater overall integration in males and segregation in females. However, a more recent analysis involving 494 participants reports the opposite result, greater segregation or, local clustering, in male brains. Moreover, the finding by Satterthwaite et al. (2015) is directly opposite that of Ingalhalikar et al. (2014) from the same laboratory, who used the same dataset but a structural analysis to find greater modularity or network segregation in males.
In summary, the current body of data on s/g difference in the human connectome is conflicted and inconclusive. Although several large studies agree in identifying a pattern of higher DMN connectivity in females (but see Tunç et al., 2016), there is poor agreement about which components of the diffuse DMN network this includes. Female brain networks appear to be more efficient, but it is debated whether this results in more or less integration across networks. Much of the discrepancy in s/g findings is likely due to the wide range of structural and functional methods used to define and measure the connectome
sex/ gender prediction using multivariate statistical learning algorithms
12 independent studies of this type, nearly all reporting s/g prediction accuracy in the 80–90 % range. While impressive, most of this discrimination appears to be based on brain size, which as we’ve seen, correlates strongly with regional volumes, surface area, DTI, and other connectivity measures. Although one of the earliest studies claimed to retain 91 % accuracy in a sub sample of 35 male and 35 female brains matched for TBV, this and another small study failed to divide their sample into training and testing cohorts, a minimal requirement for measuring classification accuracy.
The remaining 10 studies all used suitably large samples (N >673) and divided them into training and testing groups, but only three of them compared prediction accuracy after controlling for total brain size. The importance of this control was first shown by Chekroud et al. (2016) who obtained 93 % s/g prediction accuracy based on a multivariate morphometric dataset, but this declined to 70 % when head size was regressed out. More recently, Sanchis-Segura et al. (2020) dissected the contribution of brain size to s/g prediction accuracy. Using 12 different algorithms and matched numbers of males and females, they showed that an average 82 % accuracy declined to 60 % when regional volumes were properly corrected using either residual or power-proportions methods
Task-based fMRI
a more fruitful approach for detecting meaningful s/g brain differences is to focus on specific mental tasks, especially those that differ most reliably between men and women at the group behavioural level. In fact, task-based fMRI studies of s/g difference pre-date con nectome studies by more than two decades. Given that s/g differences in behaviour and personality have been thoroughly documented, the chance of detecting reliable male/female brain differences would be seemingly much greater by focusing on specific tasks. A wide array of behaviours has been assessed for fMRI s/g differences, ranging from sexual arousal to mathematical processing and humour appreciation
language processing
Shaywitz et al (1995) found that males exhibited more left-lateralized activity of the inferior frontal gyrus (i.e., Broca’s area) than females during performance of one out of three verbal tasks
this was not found in subsequent studies or two meta-analyses
According to the meta-analysis by Hyde and Linn (1988), women out-perform men in verbal fluency with a d-value of 0.33. Of the six fMRI studies we identified that explicitly addressed s/g difference during verbal fluency tasks, three reported no difference in brain activation. Three others found some evidence of male/female divergence, however, the brain locations and direction of difference were entirely different among them. So even though verbal fluency is the most reliable of the linguistic dif ferences between males and females, there is no consensus about a neural basis for this difference and more evidence for similar activation in men and women in at least one structure, the left inferior frontal gyrus.
Another task frequently used to look for s/g difference is verb generation—asking subjects to silently think of a single verb that goes with a particular noun, such as “eat” when they see an image or the written word “cookie.” Here again, there is virtually no consensus among the six fMRI studies that analyzed their activation data for male/female difference, with three finding areas of greater activation in males, two finding areas of greater activation in females, and no overlap between studies in specific foci.
Among these, four found areas of greater activation in females, two found areas of greater activation in males , and one found no s/g differences in fMRI activity (Schmidt et al., 2009). Once again, none of the sex-specific regions were replicated between studies.
The lack of reproducibility in these findings strongly implicates false discovery. David et al. (2018) concluded that the fMRI literature on brain s/g difference demonstrates “excess significance”—that is, more statistically significant results than would be predicted from the summary effect size. This indicates the presence of publication bias and likely, false positive findings in some subset of published studies. This is especially likely considering the small size of most of these studies, well below the number of participants needed to adequately power the detection of small-to-moderate sized differences
But even when we look at the two largest studies in this collection—both analyses of verb generation in similarly-aged children from the same laboratory—one reported greater female activation in the precuneus and middle frontal gyrus, whereas the other found no s/g difference in fMRI activation
The possibility that fMRI sex difference research is vulnerable to false discovery was tested explicitly by Ihnen et al. (Table 8D). Although this study identified 17 specific brain regions that differed in activity be tween males and females, only one of the 17 foci generalized between two closely-related language tasks. Moreover, they found a comparable number of group-level activation differences when the same subjects were divided into random groups, not separated by s/g. In other words, Ihnen et al. (2009) were able to generate group-level differences by creating fake groups, a control that few other studies have employed. Based on these findings, along with the “grab bag” of results they review from prior investigators, Ihnen et al. (2009) concluded: “our results do not support a particular model of sex differences in language processing, and they overwhelmingly do not specifically corroborate previous fMRI studies of sex differences in language.”
In summary, and in spite of the quarter-century of research in this area, there is no reliable evidence that male and female brains process language differently. A similar conclusion was reached by other reviewers who surmised that this literature is highly subject to publication bias; studies or post-hoc ana lyses that find significant s/g effects are likelier to find their way into print than analyses that failed to find a male/female difference. And even among the published positive findings, the foci identified as differentially active between males and females rarely replicate between studies. Given that many of these are now appreciated to be statistically under-powered, it is safe to conclude that fMRI research has failed to uncover meaningful differences in the cir cuits males and females use to perceive, process, or generate language.
Spatial processing
Early meta-analyses by Linn and Peterson (1985) and Voyer et al. (1995) found that males out-perform females in all of these do mains, although the difference in spatial visualization is very small (d = 0.13 to 0.19) and not significant before 18 years of age. S/g differences in the other domains are moderate-sized
Recently, Nazareth et al. (2019) conducted a meta-analysis of male/female difference in spatial navigation, an important real-world application of this form of cognition and found a pooled effect size averaging d = 0.36, favoring males. For all domains, the magnitude of the s/g difference in spatial cognition was smaller in children, and the preponderance of evidence indicates it is not present in infancy and early childhood
In an initial study, Roberts and Bell (2000) found greater activation in left parietal and posterior temporal areas for men, compared to women, during a 2-dimensional mental rotation task (MRT), but no neural dif ference between 8-year-old boys and girls. However, the same authors found no s/g difference in EEG activity at either age using a more challenging, 3-dimensional MRT, a paradoxical finding considering that this 3D task incurred the usual male performance advantage
structural brain correlates of male-female spatial skill differences
Taking the four structural studies,:
Koscik et al. (2009) focused on the parietal lobe and reported that better MRT performance was correlated with parietal lobe surface area in men; in females, however, it was the proportion of parietal GM/WM that correlated with MRT performance, in this case predicting poorer per formance.
H¨ anggi et al. (2010) conducted a similar study using a block design task, but obtained nearly opposite results: performance was correlated with parietal WM volume in males and parietal GM volume in females.
The third and largest of the structural studies was by Wei et al. (2016) who reported no differences in the parietal lobe but a significant correlation between right anterior hippocampal GM and MRT score, with males exhibiting a larger anterior hippocampus than females (after controlling for brain size). These authors concluded that right anterior hippocampal GM is the “neurobiological substrate for the sex difference in 3D mental rotation.”
The fourth and most recent study to assess a structural correlate of spatial skill performance found no s/g differences. Martinez et al. (2017) compared DTI connectivity measures in men and women to their per formance on a battery of spatial skills and observed that spatial skill performance correlated with the ratio of inter- to intra-hemispheric connectivity across all individuals, male or female.
How ever, Martinez et al. (2017) also found that controlling for either ICV or TBV eliminated the s/g difference in this ratio. Thus, a greater degree of inter-hemispheric communication ap pears to help both males and females with spatial skills and, according to Martinez et al. (2017), verbal skills as well.
In summary, extant structural MRI studies of spatial processing cir cuitry have produced highly conflicting results regarding the neural correlates of s/g difference, and no replications.
fMRI correlated of male-female spatial skill differences
Of the 34 such studies we identified, the majority (19) used a MRT to search for sex difference in brain activation (Table 9B). According to two meta- analyses, neither of which assessed s/g effects, mental rotation acti vates two primary brain areas bilaterally: one centered on the intra parietal sulcus and the other on the medial superior premotor cortex
Among the 19 studies in Table 9B, nearly all report some type of parietal activation, mostly bilateral, in both males and females. Many also report some frontal lobe activation. But the studies range enormously in their findings of s/g difference.
Most of these MRT studies were quite small and only six replicated males’ performance advantage when subjects were in the scanner. These limitations may explain the wide diversity of results, varying from no s/g difference to greater male activation in the left cerebellum, left middle temporal gyrus. frontal gyri, ventral anterior cingulate gyrus and lingual gyrus.
Conversely, 12 of the studies reported areas of activation that were significantly stronger in females, spread across various frontal, temporal, and parietal sites. Nonetheless, some agreement is suggested in four studies that found greater parietal activation in males versus greater frontal activation in females
Perhaps with larger samples a clearer distinction between male-biased activity in the parietal lobe versus female-biased activity in the frontal lobe may become apparent. For now, however, the overarching result is a lack of consistent s/g differences, likely due to low statistical power and false positives
The same conclusion applies to the remainder of fMRI studies that used other spatial cognition tasks. After MRT, the next most common spatial task for assessing male-female difference is virtual navigation. At the behavioral level, males outperform females on navigation and wayfinding tasks
We found four studies that compared fMRI activation between males and females during vir tual navigation, which involves finding one’s way through a featureless 3-dimensional computer maze. The first and most highly-cited study found that males exhibited stronger activation of the left hippocampus, whereas females exhibited stronger right prefrontal and left parietal activation during virtual maze exploration
However, a larger study by Ohnishi et al. (2006) found no s/g difference in hip pocampal activation, but did detect stronger activation of the parietal cortex by poor navigators, both male and female. Another study re ported greater activity in the right hippocampus of males relative to females
Taken together, these studies reveal no consistent s/g differences in regional brain activation during spatial navigation, but rather, consid erable similarity in activation of visual and parahippocampal structures between males and females. Such similarity is further supported by a more recent assessment of the spatial navigation network derived from rsfMRI connection analysis. In this much larger study, no s/g differences were identified in the connections between three key areas known to participate in spatial navigation: hippocampus, parahippocampal place area, and retrosplenial areas of the parietal lobe.
In summary, existing research has not elucidated a neural basis for the male/female difference in spatial navigation, much like collective fMRI studies of MRT.
research addressing mental rotation ability in men and women with similar technical experience—that is, trained military pilots—found no s/g difference in either mental rotation or navigational abilities, consistent with a lack of inborn “sexual dimorphism” in spatial cognitive circuitry
Emotion processing
effect size tends to be small or moderate
Much of this research has focused on empathy, or the ability to detect the emotional experience of another person. Empathy can be assessed subjectively, based on par ticipants’ self-report of caring or feeling in response to various social scenarios. Such subjective self-assessment tends to produce a large fe male advantage (d ≈ 1.0). By contrast, objective measures of empathy, such as participants’ accuracy at identifying the emotion expressed in photos or video clips of others’ faces are more modest
According to a meta-analysis of 215 independent samples, females outperform males at identifying emotion in non-verbal displays by an effect size of only d = 0.19. Again, the effect is smaller in children (d = 0.13)
Such small behavioral effects may explain why fMRI researchers have had difficulty finding consistent brain s/g differences during objective emotion tasks. Three early studies claimed that a lateralization difference underlies a s/g difference in emotional memory
These were summarized in a review by Hamann (2005) that stated emotional memories are predominantly encoded by the right amygdala in males but the left amygdala in fe males. However, these lateralization differences have not held up in the several meta-analyses of brain emotion processing.
the most recent meta-analysis by Filkowski et al. (2017) included 56 studies and found results inconsistent with all six prior meta-analyses. Thus, they reported greater bilateral amygdala and hippocampal activity in females in response to visual emotional stimuli of any valence. This is opposite the result in Sacher et al. (2013) and Sergerie et al. (2008). Filkowski et al. (2017) did, however, replicate the f inding of Wager et al. (2003) that women showed stronger brainstem activation in response to emotional stimuli. Males, by contrast, showed stronger activation in several frontal areas, a result that agrees better with Sacher et al. (2013) and Stevens and Hamann (2012), albeit the latter found this only for negative emotional stimuli.
In summary, fMRI has been extensively utilized over the past quarter century to compare the neural basis of emotion processing between males and females, with surprisingly little consensus. Hypotheses con cerning lateralization differences or valence-specific s/g activity pat terns have not held up across meta-analyses, much less many individual studies
Technical factors likely contribute to the lack of reproducibility in s/g effects (Botvinik-Nezer et al., 2020): differences in MRI hardware, image processing pipeline, spatial data analysis (Hong et al., 2019), stimulus type, age and nationality of subjects, educational background, and especially, sample size
Another limitation is the variability in behavioral performance during scanning, which was not addressed in any of the meta-analyses in Table 10. We did track this for verbal and spatial fMRI studies and found only a minority observed the expected s/g difference in task accuracy or reaction time in the scanner. This can be taken as further evidence of under-powering (for studies that fail to find a behavioral difference). Conversely, in studies that did find a performance difference between males and females, any fMRI signal differences could reflect the degree of challenge more than cognitive circuitry per se, complicating the interpretation of such neural findings.
the conclusion to be made is that men and women both activate these same neural structures: amygdala, hippocampus, thalamus, frontal lobe, and midbrain. In other words, the circuitry for emotion processing–like language and spatial cognition—appears overwhelmingly similar be tween men and women. Although we cannot eliminate the possibility that there are reliable male/female differences in certain populations under very specific conditions, the parsimonious conclusion is that group-level s/g differences, if they exist, are buried within the greater variance of individual difference.
discussion
brain size and its correlates:
With the difference in overall brain size comes other male/female brain differences that are largely, if not exclusively, attributable to size rather than sex. One of these is GM/WM ratio, which averages 5.5 % larger in females across multiple studies. As brain size increases, there is a disproportionate increase in the denominator of this ratio, since larger brains need larger-caliber, more heavily myelinated axons to transmit action potentials across greater distances. Thus, the s/g difference in GM/WM ratio is largely eliminated when adjusted for total brain size
Without exception, the difference in global brain size is reflected in every major cortical and subcortical brain component, which range from 5 to 11% larger in absolute volume in males compared to females. Again, normalizing these measures to individual brain or head size largely eliminates any volume difference between males and females in specific structures. Of the handful of s/g differences that survive this correction, all are small in magnitude (d ≤ 0.25) and sensitive to analytic methods—brain seg mentation software or brain size normalization method
the absolute difference in amygdala volume is a mere 1% larger in males (after ICV or TBV normalization) and not reliably significant. Moreover, the magnitude and significance of s/g difference in both of these structures is highly sensitive to the precise method of brain volume normalization
For cortical volumes there is even less consistency in claims of s/g difference, especially comparing studies using surface- versus volume-based segmentation
Cortical thickness is another metric often stated to differ between males and females. Several large and small MRI studies report greater average cortical thickness in females, however, this finding is highly sensitive to image acquisition method
The human brain is not sexually dimorphic
s/g differ ences in the human brain are extremely subtle and variable. There is nothing to justify the term “sexual dimorphism” to describe them. Among the few reliable differences, nearly all are byproducts of brain size, and none are evidence of “two shapes” as “dimorphism” would denote. Thus, when brain size is covaried in the analysis of individuals’ brain measures, s/g explains about 1% of the total variance. In other words, brain differences attributable to sex or gender are trivial relative to other sources of individual variation. Furthermore, differences that are often portrayed as related to s/g are more accurately attributable to brain size, such that they distinguish large- from small-headed men as well as they distinguish the average man from the average woman.
Indiscriminate use of “sexual dimorphism” has been rejected by leaders in the field (Ball et al., 2014; McCarthy et al., 2012), who state that it should be restricted to phenomena in which there is no overlap between groups, such as the shape of ovaries vs. testes or SNB volume in male vs. female rodents. For smaller effects, these authors advise using “sex difference” or “sex effect.” Some in the neuroimaging field are also starting to abandon “sexual dimorphism”.
We agree and argue that the issue is more than semantic. The term “dimorphism” has potent heuristic value, reinforcing the belief in categorically distinct organs: a “male brain” and “female brain” that have been evolutionarily shaped to produce two psychologically distinct categories of people.
In other words, the term “dimorphism” reinforces a binary under standing of s/g brain difference, when in fact, few such differences actually exist and the ones that do are very small, with great variability from population to population. Of note, a similar conclusion is converging from the growing research on transgender participants’ brains, according to Smith et al. (2015) who remark that “viewing gender as a binary or dichotomous category has to be reconsidered.”
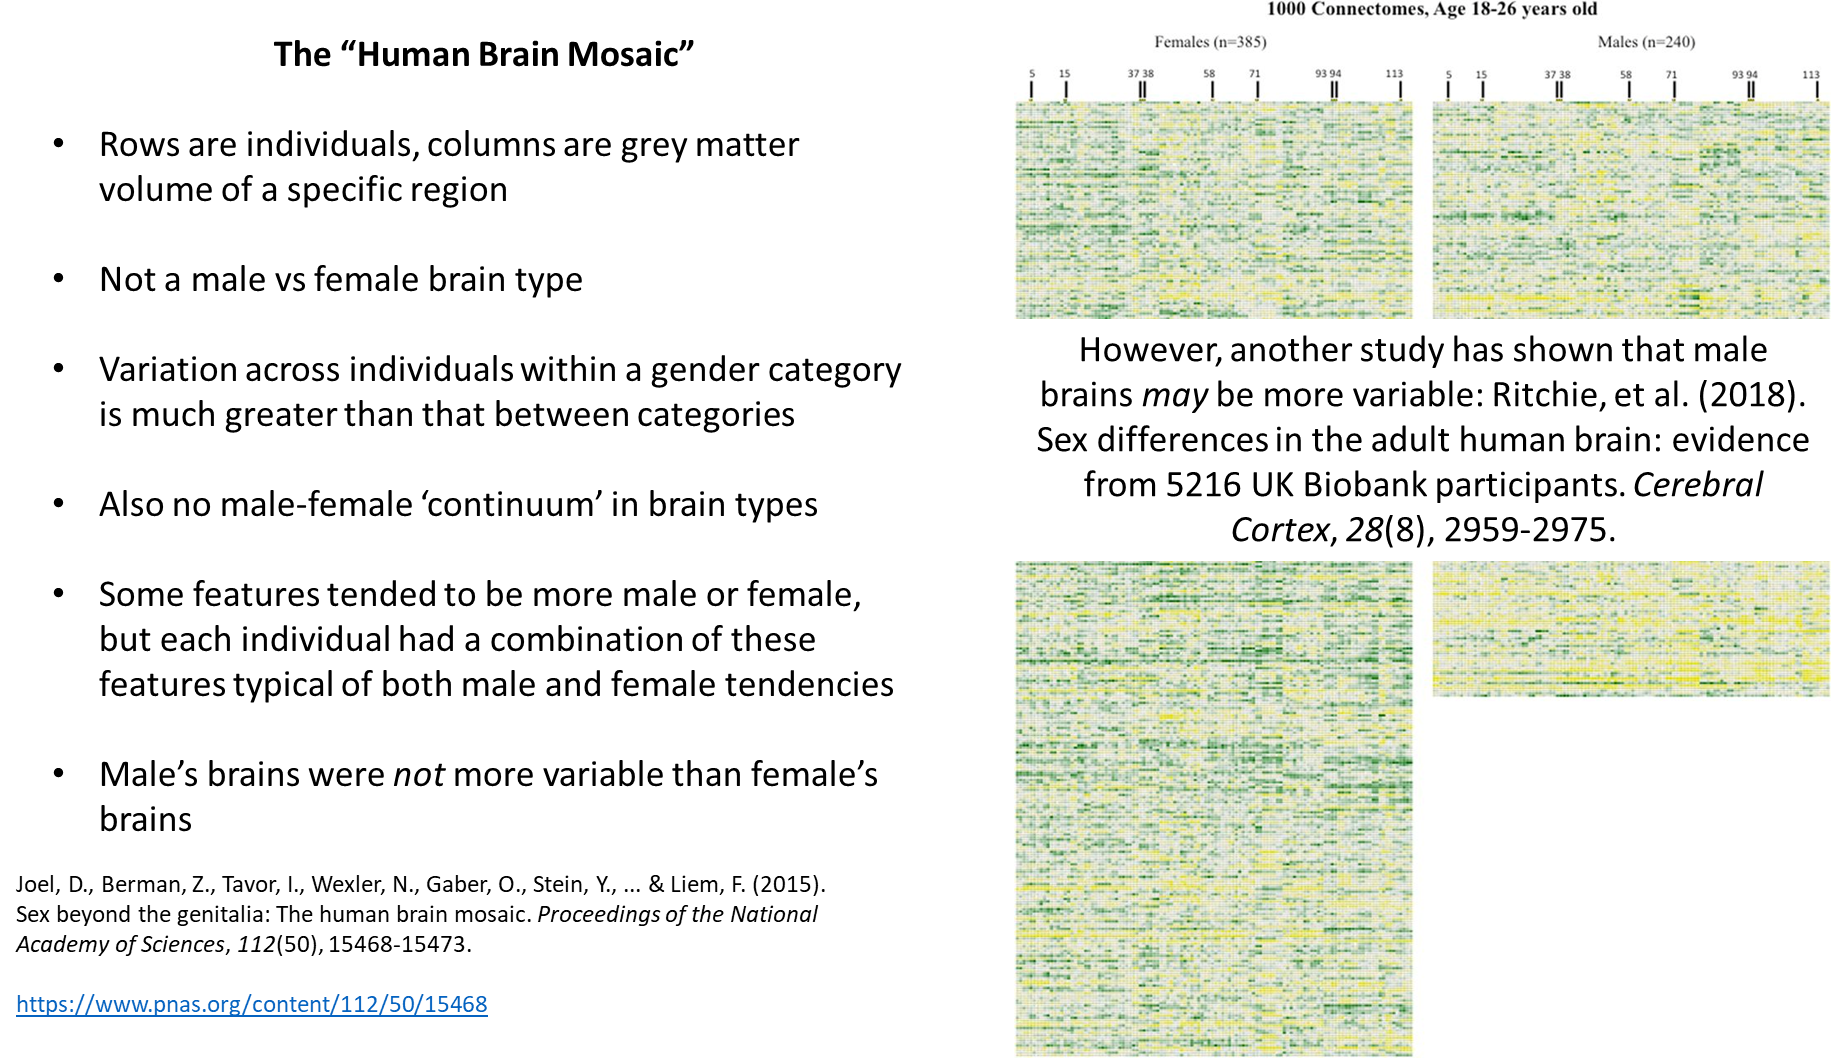
Rather, a picture is emerging not of two brain types nor even a continuous gradient from masculine to feminine, but of a multidimensional “mosaic” of countless brain attributes that differ in unique pat terns across all individuals. Although such differences may, in a particular sample, sum up to discriminate male from female brains, the precise discriminators do not translate across populations so are not diagnostic of two species-wide types. In this sense, the brains of male and females are not dimorphic (like the gonads) but monomorphic, like the kidneys, heart and lungs, which can be transplanted between women and men with great success.