

Unit 1 and 2 Microeconomics
actual notes from microecon lessons + little notes to help me remember things
Main terms to know:
Opportunity Cost - most desirable alternative given up when making a choice (basically like, “the one that got away”)
Factors of Production - Land, Labor, Capital
PPC (Production Possibilities Curve) - shows efficiency in production of 2 items, one item on x-axis, one item on y-axis. if production is on curve line = efficient, if under curve = inefficient, if above curve = impossible!
2 kinds of PPC = Constant Opportunity Cost and Increasing Opportunity Cost
Constant Opportunity Cost is a straight, downward sloping line because the 2 products use similar resources during production.
Increasing Opportunity Cost is a curved line (probably what you think of when you think of a PPC graph) because of the law of increasing opportunity costs.
Substitute - a product used as a replacement when product x’s prices increase (think grape juice and wine, if wine prices increases, people will buy grape juice instead)
Complement - a product that decreases in quantity demanded when product x’s prices increase (think hotdog and hotdog bun, no wants to buy a hotdog bun if they can’t even afford the hotdog itself)
Normal Good - when your income goes up, you’ll be able to afford it, so demand will increase (think hailey bieber erewhon smoothie. if you have some extra money, you might spend some money on it, but it’s not a need)
Inferior Good - when your income goes up, you decided that you’re too good for these products, so you buy less. (think cheap pizza, stuff like that)
Elastic - if price of product goes up, people buy less. if price of product goes down, people buy more. (think luxuries, think back to the hailey bieber smoothie, if it was less than $22, more people would buy it, right?)
Inelastic - this is stuff that people will still buy even if the price jacks up and will buy a little more if price goes down. (so for this, think like eggs and gas. right now, eggs and gas are pretty expensive, but they’re still needed for most people, so they’ll pay the jacked price)
Price Ceiling - Goes below equilibrium unless stated otherwise
Price Floor - Goes above equilibrium unless stated otherwise
Shortage - When the price is low, there is a shortage
Surplus - When the price is high, there is a surplus
Consumer Surplus - difference between what you’re willing to pay vs what you actually paid
Producer Surplus - difference between what you’re willing to sell something for vs what you actually sold it for
Ok those are basically all (most) of the important terms in unit 1 and 2, so let’s get into the meat of it!
Let’s talk about a basic supply and demand graph.
The demand curve is downward sloping, while the supply curve is upward sloping. The place that they intersect is called in “equilibrium”. This is the place where supply and demand are efficiently maximized.
You may come across a question where the supply or demand curve shift either to the left or right depending on the situation. It’s important to graph each change that you come across in a problem (especially if you are the type of person who likes to visualize the problem). After graphing the shift, you’ll find the new equilibrium. Compare this new equilibrium to the old (original) equilibrium to determine if the price and quantity demanded have changed.
But what if you encounter a problem where both the demand AND supply shift?
In that case, it’s important to note that either the price or the quantity demanded will be indeterminate. To determine which of the 2 is the indeterminate 1, you should graph each shift on separate graphs and write the changes to P and Q for each graph. After this, compare each graph’s P and Q changes. This is kind of hard to explain so just look at this screenshot from Clifford’s video.
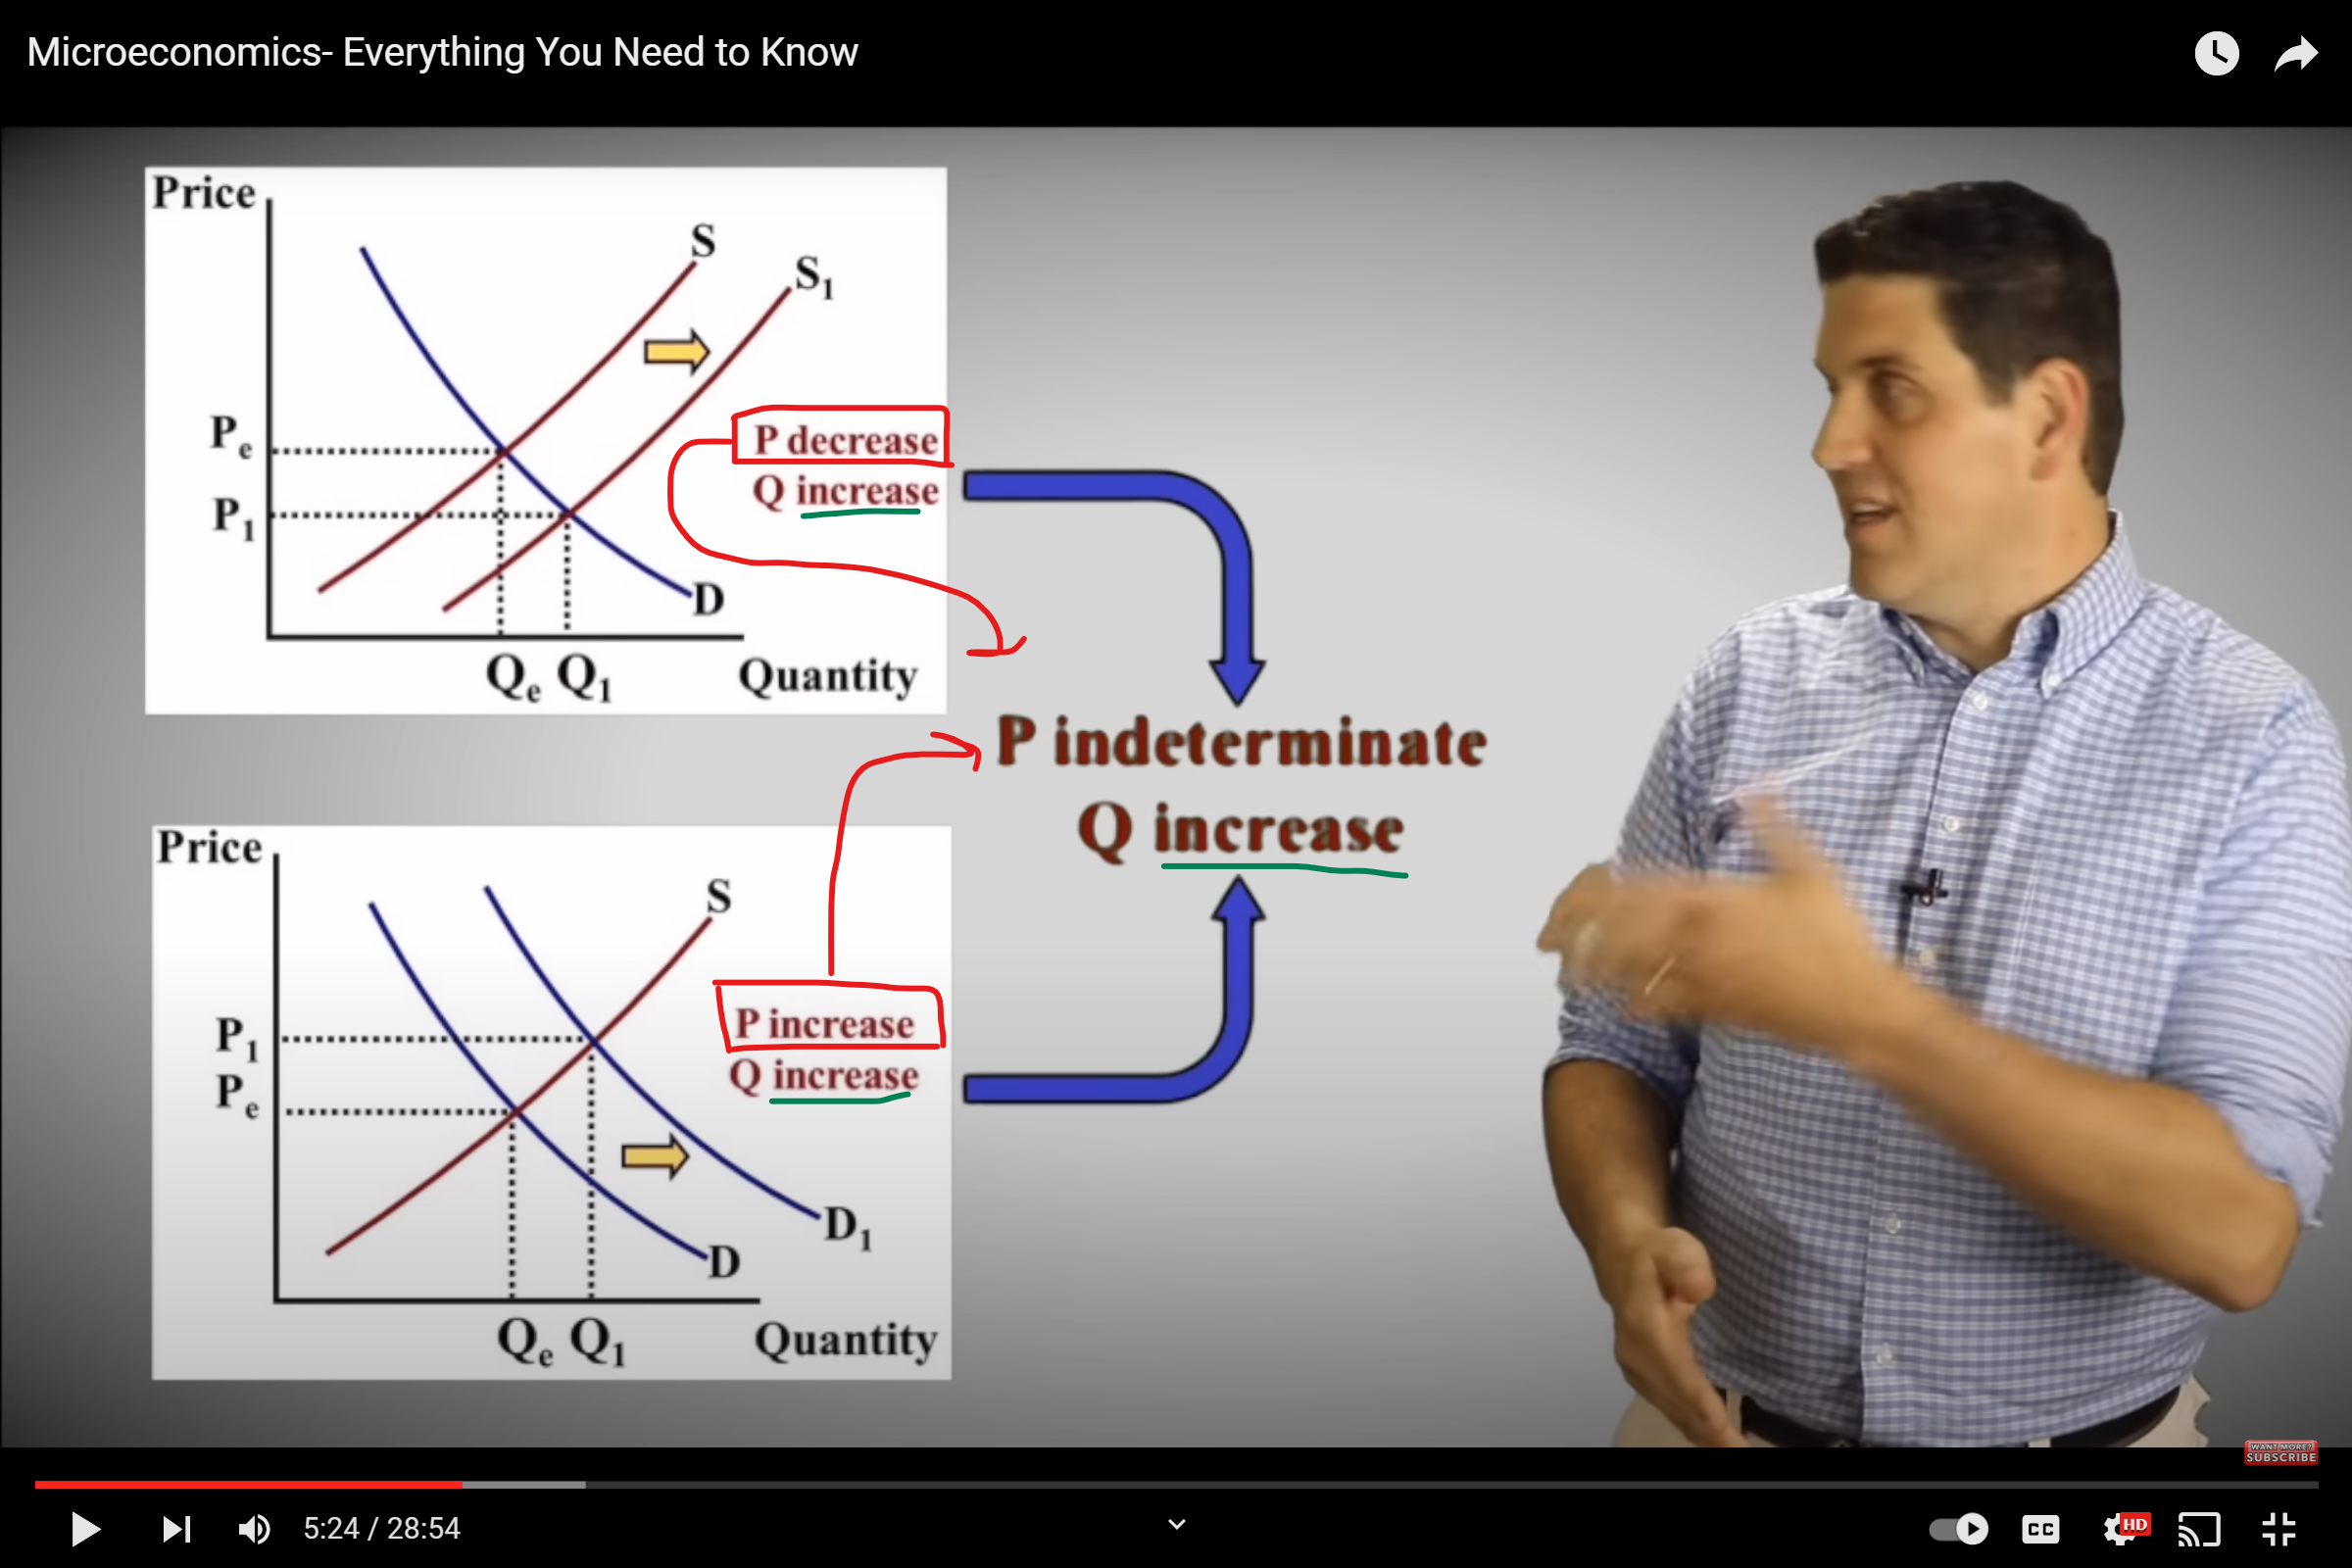 Basically, because P went up in 1 graph and down in the other, it is ambiguous and therefore, indeterminate. Whereas, Q increases in both, so we know for sure that Q increases when both shifts happen! Hopefully that made sense.
Returning back to Elastic and Inelastic.
An Elastic Graph kind of looks like this: — , but and Inelastic Graph kind of looks like this: | (I remember this because Inelastic starts with the letter “I” and the graph resembles that)
Also, INelastic means that it has a coefficient of LESS than 1, while Elastic means that it has a coefficient of MORE than 1. I remember this because the prefix “in” and “less” fit together in my head)
I bring up the coefficients because in order to determine if a product is elastic or inelastic, you must find the coefficient of it. To do that, you do:
% Change in Quantity / % Change in Price
After solving, refer back to the coefficient rules to determine what kind of good it is.
Now, how do we figure out if a product is a substitute or a complement? That’s easy.
It’s essentially the same formula we just used, with quantity on top and price on bottom, BUT, you used the quantity of product b, and the price of product a. So, it should look something like this:
(Cross Price Elasticity of Demand Formula)
% Change in Quantity of Product B / % Change in Price of Product A
After solving, you’ll need to evaluate if your answer is positive or negative. If your answer is positive, it’s a substitute. If your answer is negative, it’s a complement.
The way I remember this is that substitute teachers are helpful and good (+), whereas compliments can inflate someone’s ego and make them into a cocky person (-). It’s weird but it makes it easy.
The next formula is to find out whether a product is a normal good or an inferior good. This is in direct relation to income, so income will be used in the formula. It will look something like this:
(Income Elasticity Formula)
% Change in Quantity / % Change in Income
If your answer is positive, it’s a normal good. If your answer is negative, it’s an inferior good. This is pretty easy to remember as long as you know what inferior means.
There’s also this thing called the TR Test (Total Revenue Test), where you can see if a graph is elastic or inelastic. Basically, in an inelastic graph, the TR will follow whatever direction (increase or decrease) that the price goes in. So if the price falls, so does TR. But in an elastic graph, the TR does the opposite of what the price does. So, if the price falls, the TR increases. I remember this because the word “elastic” reminds me of resistance, so it’s like the TR is resisting the pull of the price.
Finally, there is the utility maximizing rule. This one’s pretty simple. Just divide the amount of satisfaction something gives you by the price that it costs, and then compare it to other options. Whichever option has the highest number is the best option.
The formula looks like this:
MU of A / P of A = MU of B / P of B
There’s more concepts in Unit 2, like tariffs and taxes, but they’re better off being explained in Clifford’s “Microeconomics - Everything You Need to Know”, because it’s just a lot of looking at graphs and stuff.