"The Candlestick Bible" Notes
What is a candlestick?
Japanese candlesticks are a type of financial chart that visually represents an asset's price movements over a specific period, showing the opening, closing, high, and low prices. They depict the buying and selling of assets in the financial markets.
A. Candlestick Anatomy:
The filled part of the candlestick is called the real body.
-The thin lines poking above and below the body are called shadows/wicks/tails.
-The top of the upper shadow/wick is the high
-The bottom of the lower shadow/wick is the low.

Candlesticks have different body sizes: Long bodies and short bodies.
Long/big bodies = strong buying/ selling pressure.
Short/little bodies = weak buying/ selling pressure.

-If the close is above the open, we can say that the candlestick is bullish which means that the market is rising in this period of time. ( bullish, buy, up=up)
If the close is below the open, we can say that the candlestick is bearish which indicates that the market is falling in this session. (bearish, sell, down=down)
Candlestick shadows/tails/wicks that are long, show that trading action occurred well past the open and close.
Upper shadows signify the session high
Lower shadows signify the session low
-If a candlestick has a longer upper shadow, and short lower shadow, this means that buyers bid price higher, but sellers drove price back down to end the session back near its open price.
-If a candlestick has a long lower shadow and short upper shadow, this means that sellers had force in price, but buyers came in and drove prices back up to end the session back near its’ open price.
B. Candlestick patterns
Candlestick patterns are the language of the market. They are one of the most powerful trading concepts, they are simple, easy to identify, and very profitable setups. If you learn how to read candlestick patterns the right way, you will be able to understand what these patterns tell you about the market dynamics and the trader’s behavior. This skill will help you better enter and exit the market at the right time. Focus on the anatomy of the pattern and the psychology behind its formation, this will help you make an educated guess on the markets next move.
Candlestick Formations:
Engulfing Candle
The engulfing candlestick pattern is characterized by a candle that is completely engulfing the previous candle, including the wicks.
Below are examples of both a bullish engulfing candle and bearish engulfing candle. The engulfing candle is communicating that either the buyers or sellers are now in control of price.
When an engulfing candle occurs in a trend, bullish engulfing during a bullish trend or bearish engulfing during a bearish trend, is interpreted as a continuation signal.
When it occurs at the end of a trend (either uptrend or downtrend) it indicates a reversal and the market will change direction.
This pattern is essential for traders to identify potential entry and exit points, as it provides insight into market sentiment and momentum.

Doji Candle
Doji is one of the most important Japanese candlestick patterns, when this candlestick forms, it tells us that the market opens and closes at the same price which means that there is equality and indecision between buyers and sellers, there is no one in control of the market.
Remember always that a Doji indicates equality and indecision in the market, you will often find it during periods of resting after big moves higher or lower, or consolidation.
When it is found at the bottom or at the top of a trend, it is considered a sign of reversal.
The different types are:
the Doji(basic)= characterized by a an open and close at the same market price. often seen during consolidation; indicates in decision in the market.
the Dragonfly Doji= characterized as a bullish candlestick pattern. The candle has an open and close at the same or about the same price, with long lower wick that shows the resistance of buyers and their attempt to push the market up. Considered a bullish reversal signal at the bottom of a downtrend.
the Gravestone Doji= is the bearish version of the dragonfly Doji, it is formed when the open and close are the same or about the same price. This pattern indicates that while buyers were able to push prices well above the open, sellers overwhelmed the market pushing the price back down.
Identifying the formation of Gravestone and Dragonfly doji candlesticks, will help you visually see where support/demand and resistance/supply areas are located. For these candlestick patterns to be reliable they must occur near these levels.
Star Candle
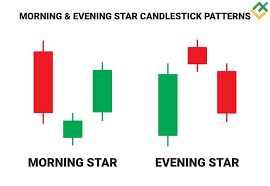
The star pattern is considered as a reversal pattern, it often occurs at the top or bottom of a trend and it consists of three candlesticks:
The first candlestick is bearish which indicates that sellers or buyers are still in charge of the market.
The second candle is a small one which represents that whomever is in control of price, but they don’t push the market much in their favor and this candle can be bullish or bearish.
The third candle is a candlestick that gapped up on the open and closed above the midpoint of the body of the first candle, this candlestick holds a significant trend reversal signal.
The two types are the Morning Star and the Evening Star.
Morning Star = considered a bullish reversal. The morning star pattern shows us how buyers took control of the market from sellers, when this pattern occurs at the bottom of downtrend near a support level, it is interpreted as a powerful trend reversal signal.
Evening Star = considered a bearish reversal. In general, the evening star pattern is the bearish version of the morning star pattern. The sellers took control of the market from the buyers, when this pattern occur at the top of an uptrend near a resistance level, it is interpreted as a powerful reversal sign.
Pin Bar Candle
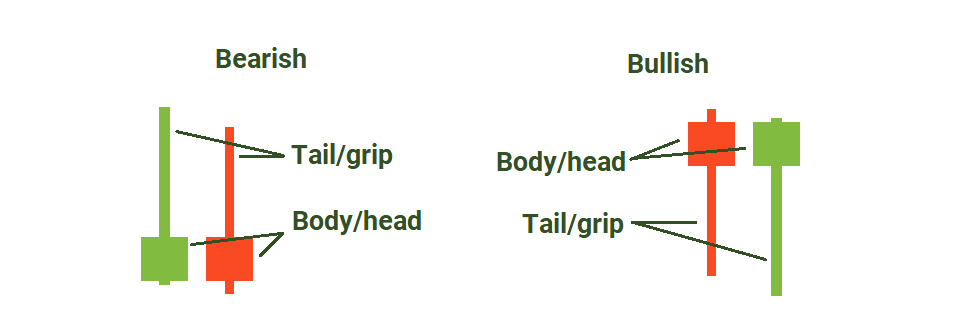
The pin bar candlestick is created when the open high and close are roughly the same price; it is also characterized by a long wick. this is considered a reversal candle stick pattern when at bottom or the top of a trend. When this candlestick forms near a resistance level. It should be taken as a high probability setup.
The two types are:
Hammer(pin bar): indicates a bullish rejection from buyers and their intention to push the market higher, meaning buyers beat the sellers. Although there was lower market activity, the buyers ultimately closed out the candle.
Shooting star(pin bar): would be the opposite of the hammer pin bar. it indicates a bearish rejection from sellers and intention to lower the market, meaning sellers beat buyers. Even with buying activity above the open the sellers closed the candle.
Harami Candlestick Pattern
The Harami pattern (pregnant in Japanese) is considered as a reversal and continuation pattern, and it consists of two candlesticks:
The first candle is the large candle, it is called the mother candle.
Followed by a second smaller candle which is called the baby.
For the Harami candlestick pattern to be valid, the second candle should close outside the previous one. The body of the baby candle must be engulfed by the body of the mother candle.
The Harami candle tells us that the market is in an indecision period. In other words, the market is consolidating. When this candlestick pattern happens during an uptrend or a downtrend, it is interpreted as a continuation pattern which gives a good opportunity to join the trend and if it is occurred at the top of an uptrend or at the bottom of a downtrend, it is considered as a trend reversal signal.
Tweezer Tops and Tweezer Bottoms
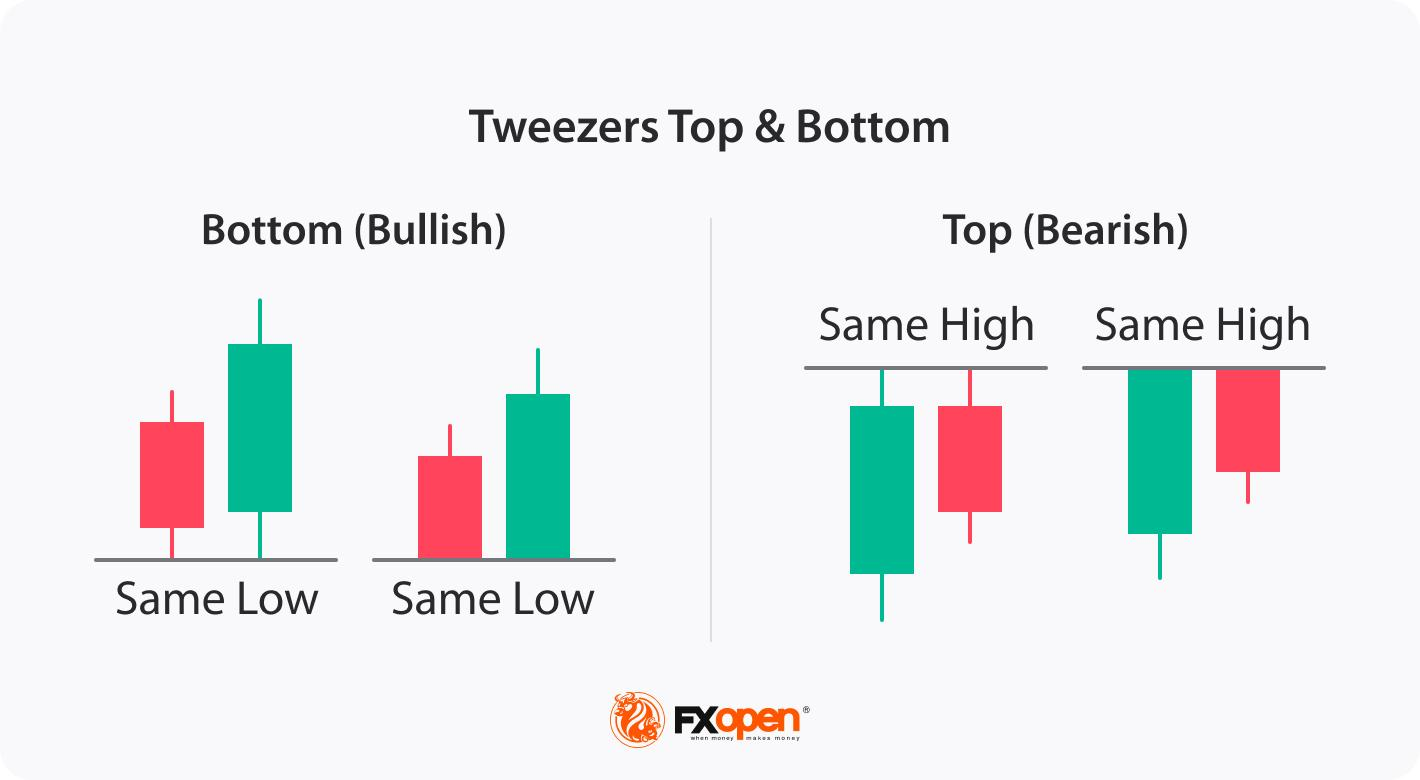
The tweezers top formation consists of two candlesticks:
The first one is a bullish candlestick followed by a second bearish candlestick.
And the tweezers bottom formation consists of two candlesticks as well:
The first candle is bearish followed by a second bullish candlestick.
The tweezers top formation is considered as a bearish reversal pattern seen at the top of an uptrend, and the tweezers bottom formation is interpreted as a bullish reversal pattern seen at the bottom of a downtrend.
A "tweezers top" occurs during an uptrend when buyers push prices higher, suggesting the market is still rising. However, sellers then drive prices down, closing below the opening of the bullish candle, signaling a potential trend reversal. Conversely, a "tweezers bottom" happens in a downtrend when sellers push prices lower, but buyers then drive prices up to close near the initial bearish candle's open, indicating a potential upward reversal. These patterns can indicate trend reversals and are more reliable when used with other technical analysis tools.
C. The Market Structure
As a trader, one of the most important skills is reading market structure. This allows you to apply the right strategies for different market conditions. You need to study market movements and behavior since not all markets should be traded the same way. Mastering this skill helps you understand crowd actions, market control, and optimal trading times. Through price action analysis, you'll encounter three market types: trending, ranging, and choppy. You don’t need indicators to identify a type of market trend, just a visual observation of price action is quite enough to get an idea about the market trend.
Trending Markets
Trending markets are simply characterized by a repeating pattern of higher highs and higher low in an up-trending market, and lower high and lower low in a down trending market.
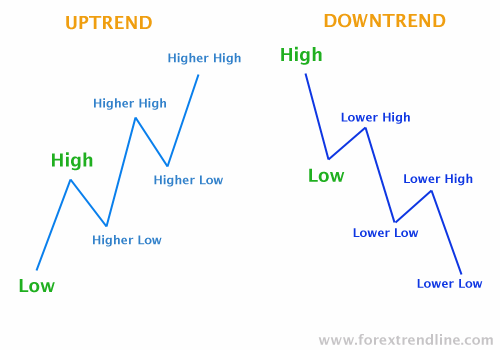
Trade with the trend! Meaning trade in the direction of the trend. Uptrend=Buy, Downtrend=Sell
But the question is, what is the right time to enter a trending market?
Trending markets are characterized by two important moves, the first move is called, the impulsive move, and the second one is called the retracement(pullback/corrective) move.
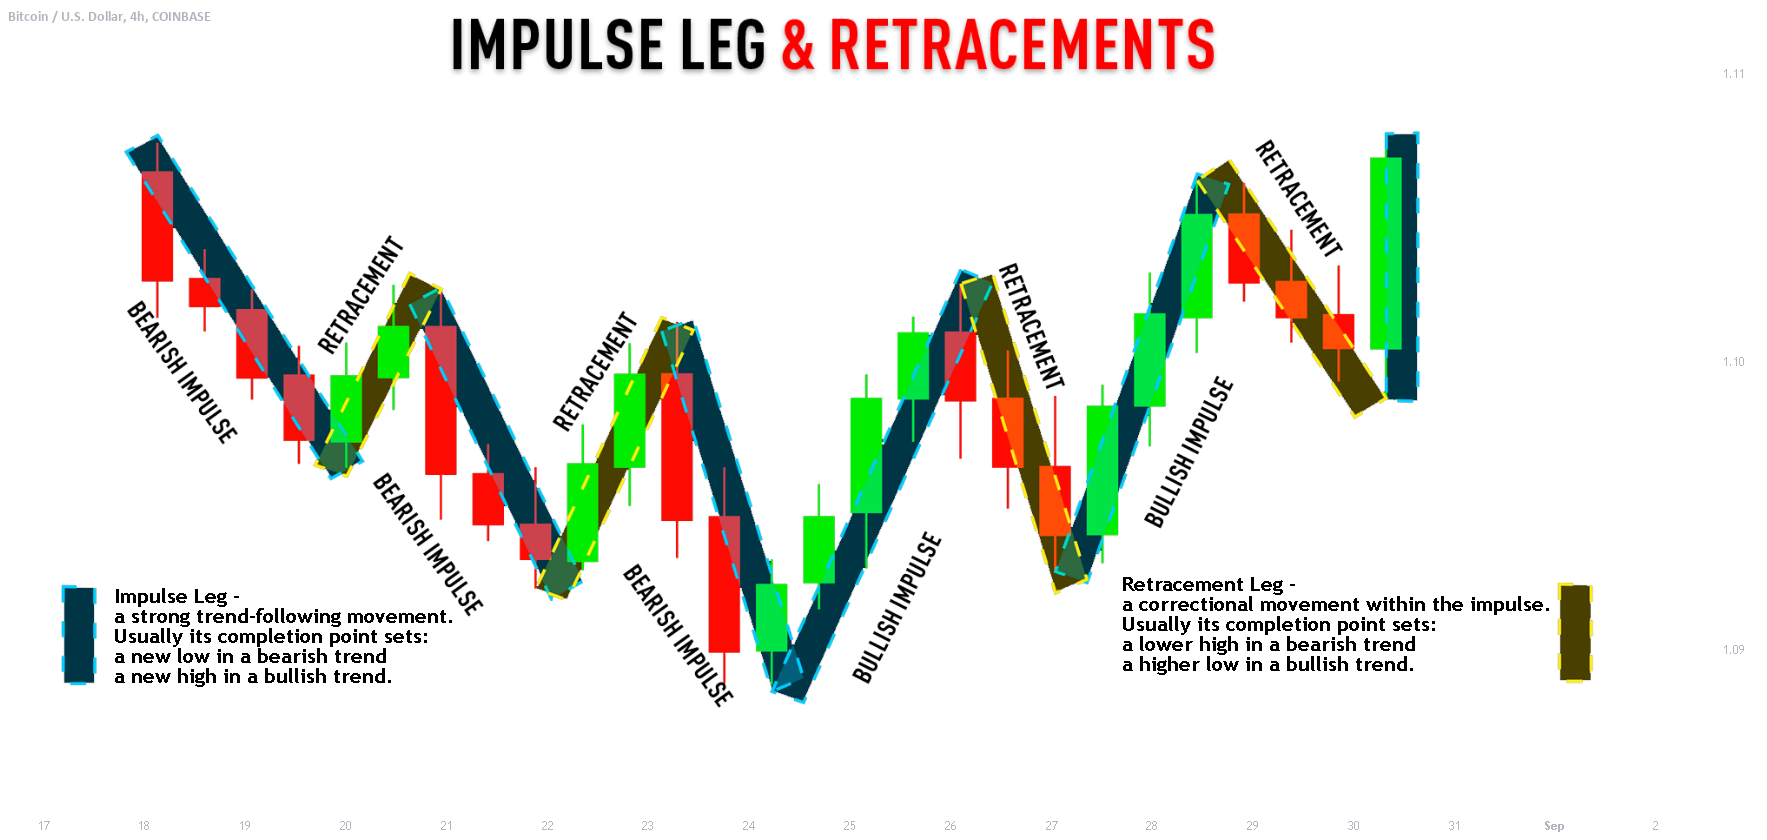
Impulsive moves and retracements happen at support and resistance.
Support and Resistance:
Support and resistance levels/areas are characterized by swing points. Swing points are candle that initiates the reversal. This area then becomes an area of support or resistance. A point were the market rejected price and moved in the opposite direction. The market then respects this by creating a reversal again in the future at that same point.
Previous support areas/levels can become resistance levels in the future and vice versa. ( Refer to the diagram above)
When the market makes the retracement move it respects the previous swing point (support or resistance level) which will represent the beginning of another impulsive move. As you can see, when the market tests the previous swing point (support level) it goes up again. By drawing a support level in an uptrend market, we can predict when the next impulsive move will take place.
To trade a trending market: enter after retracement corrects its direction and ride out the impulsive move.
How to draw trendlines:
Trendlines are similar to support and resistance lines in that the market respects the trend line, and when price approach it, the market rejects price and continue in the same direction.
To draw a quality trend line, you will need to find at least 2 minimum swing points, and simply connect them with each other. The levels must be clear, don’t try to force a trend line.
2.Ranging Markets (Consolidating)
Ranging markets, often referred to as consolidating markets/areas or simply consolidation, are characterized by neutral or horizontal orientation.

This is when sellers and buyers are bouncing market price between key support and resistance levels, not creating new highs or lows.
In a consolidation trend, neither the buyers or sellers are control of price price.
This will continue until a breakout, and a new trending market begins.
How to trade ranging markets:
Wait for price to approach support or resistance, then buy at key support level or sell at key resistance level and catch the movement back to either support or resistance.
Wait for the breakout from either resistance or support. Catch the impulsive move until the next retracement. Beware of fake outs, wait for conformation.
Wait until after the retracement, or pullback, then enter for a buy or a sell.( note: pullbacks don’t always occur after breakouts)
Choppy Markets
When analyzing the charts, if a market isn’t resembles a ranging market but it doesn’t appear to have clear key support and resistance levels, it isn’t worth trading and is probably a choppy market.
Choppy markets are very noisy, price is moving in a tight range. There aren’t any small trends with a support and resistance with a horizontal orientation. y’know what I mean?
The best way to determine when a market is choppy is best viewing on the daily chart.
Time frames and Top Down analysis
Candlesticks are visual representations of market price for any given frame of time.
For example if you are looking at the charts on the 4H time frame, every candlestick displayed on the chart depicts 4 hours of time from open to close.
In price action day trading, the Daily (1D), 4H, and 1H are primary time frames. Though there are many time frame to use in trading with other strategies.
Top Down analysis is the analyzing from higher to lower time frames to have a better informed assessment of price action, before executing a trade i.e. if you wanted to swing trade start on the 4H, then the weekly charts, then the daily charts, to identify confluence on the different time frames, when looking for trade ideas.
*The rest of the PDF is dedicated to strategies using candlestick the suggests. I am disinterested in the writers trading strategies as I will applying my own strategy ; however, I find the insights on candlestick patterns and their implications for price action quite valuable for enhancing my understanding of market movements. That all for my notes!