OPB451 W1 - Visual Acuity
Visual Acuity
Definition of Visual Acuity
Visual acuity (VA) is a fundamental limit of visual performance.
It measures fine spatial vision.
Studied over many centuries
Used to define vision impairment / blindness
Various occupations and driver licensing require specific levels of VA.
Limiting Factors of Visual Acuity
Visual acuity is primarily limited by:
The optics of the eyes.
The anatomy and physiology of the visual system.
It serves as a key clinical measure of the integrity of the optical and physiological state of the eye and its visual pathways.
Link between Visual Acuity and Contrast Sensitivity
Understanding Sensitivity and Charts
Sensitivity refers to the ability to distinguish between stimuli based on contrast.
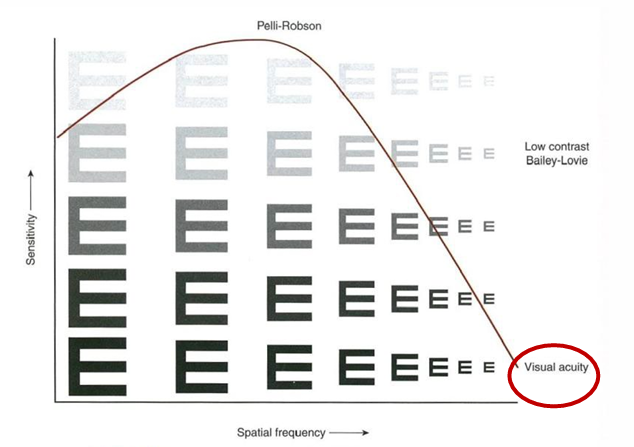
Pelli-Robson and Bailey-Lovie Charts:
Pelli-Robson provides charts with various contrasts.
Bailey-Lovie utilizes low-contrast optotypes of diminishing size.
Contrast Sensitivity Function (CSF):
Graphically represents the relationship between contrast and spatial frequency.
The CSF envelope dictates how varying levels of contrast affect visual acuity.
Specifying Visual Acuity
Measurement Types
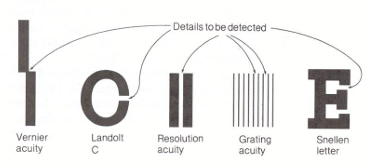
VA can be specified by four main types:
1. Minimum Visible
Detecting a feature, e.g., stars.
Measurement: 0.00014° (0.5" gap).
2. Minimum Resolvable
Resolving two features (e.g., gratings).
Measurement: 0.017° (1' = 60" at 1' acuity).
3. Minimum Recognizable
Identifying a feature, like Landolt C or Snellen Letters.
Measurement: 0.017° (1' = 60").
4. Minimum Discriminable
Discriminating a change in a feature (e.g., vernier).
Measurement: 0.00024° (~1").
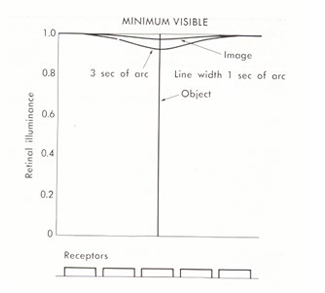
Minimum Visible Acuity
Minimum visible acuity refers to the smallest target detectable, such as stars under bright conditions.
Humans can detect targets as small as 0.5" under bright photopic conditions (ideal conditions).
The optics of the eye affect how target images project on the retina.
The target is either present or absent
measurement involves increasing the size of the target until it is first detected. This is limited by the observer’s contrast sensitivity - i.e. sensitivity to small variations in stimulus intensity (∆L/L).
Minimum visible acuity is rarely used clinically.
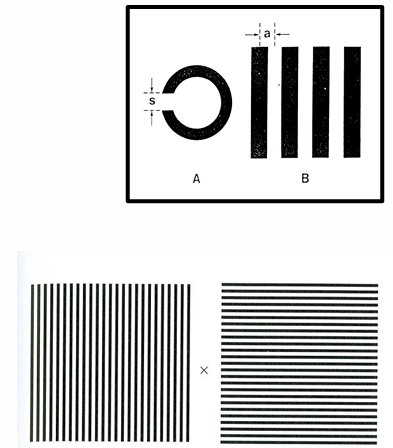
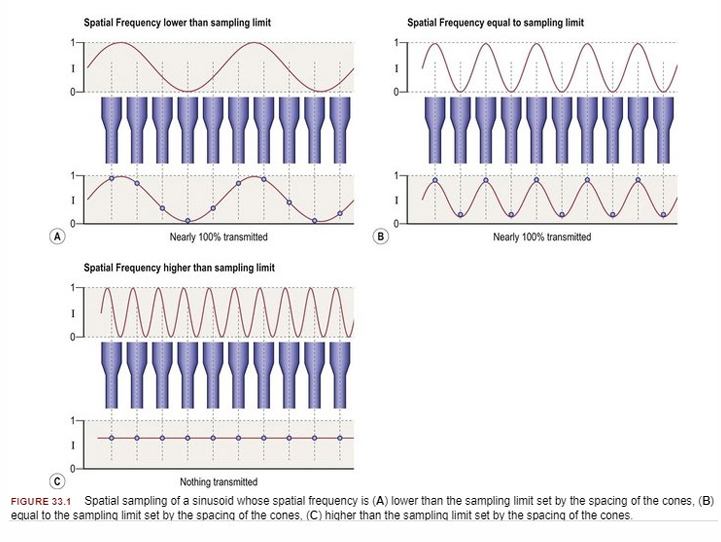
Minimum Resolvable Acuity
The smallest angular separation between neighbouring features that can be resolved
Typically measured using gratings or striped patterns, where acuity limit is normally where target subtends 60" (1') acuity.
Determined by the spacing of foveal cones in foveal vision. The limit is determined by cone spacing, where each black and white stripe needs to fall on separate cones.
Foveal cones have a centre-centre separation of 0.5’.
Minimum Recognizable Acuity
Relates to the angular size of the smallest recognizable feature.
Often assessed with letter charts such as Snellen charts.
Also involves cognitive judgement regarding patterns.
Letters are constructed so that they are five times larger than the strokes that form the letter.
Determined by measuring the smallest letter that can be accurately recognised.
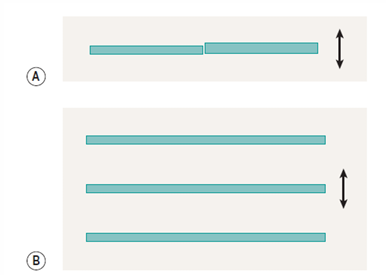
Minimum Discriminable Acuity
Refers to the angular size of the smallest change in a feature that can be discriminated (size, position, or orientation).
involves judgments of the relative position of the components of a pattern, e.g., vernier acuity.
Known as hyperacuity, capable of resolving changes smaller than a foveal cone's diameter.
Better than resolution acuity, can be as small as 1”
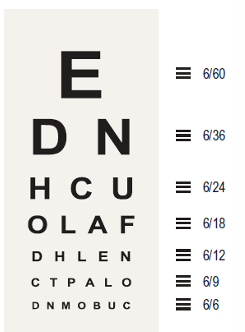
Snellen Visual Acuity
The Snellen notation is the most common method used for measuring visual acuity - other notations are used for scientific purposes
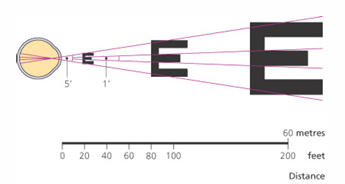
Based upon the angle that the critical detail of an object subtends at the anterior nodal point of the eye.
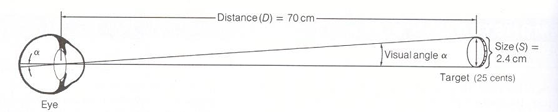
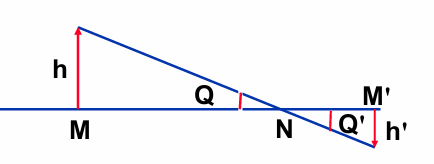
Minimum Angle of Resolution
The smallest angle resolvable by the eye
Reference point is the anterior nodal point of the eye where:
Q’ = Q, tanQ = h/MN = h’/M’N
h’ = retinal image size
h = size of the object detail resolved
MN = target - nodal point distance
M’N = retina - nodal point distance.
if you take M’N to be the posterior nodal point distance of 16.67mm then an object subtending 1’ of arc will have an image size of h’ of 4.8 microns.
Snellen Acuity Ratio
Understanding the Ratio
Assumes that 1’ is good resolution
Snellen acuity is calculated as the ratio of viewing distance (d) to the distance (D) where critical detail subtends 1'.
Different unit measurement (meters or feet) can be used.
Can express Snellen fractions in both vulgar (e.g., 6/12) and improper forms (e.g., 6/3).
Snellen acuity = d/D
d = viewing distance (M)
D = distance at which critical detail would subtend 1’.
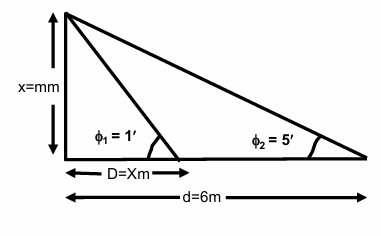
Snellen Acuity Example 1
Question:
What is the Snellen VA if the smallest detail that you could resolve at 6 meters is 5 minutes of arc
Answer:
Snellen acuity = d /D
test distance is 6 meters = numerator.
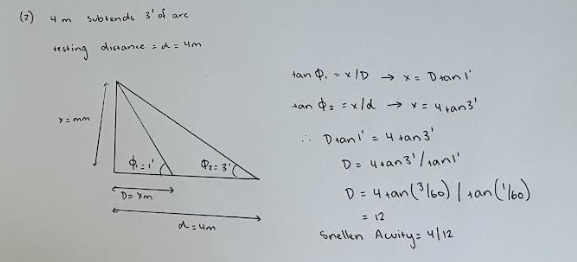
tan φ1 = x/D → x= D*tan 1'
tan φ2 = x/d → x= 6*tan 5'
∴ D*tan1' = 6*tan 5'
D=6*tan5′/tan1′
Snellen Acuity =6/30
Snellen Acuity Example 2
Question:
What is the Snellen Acuity when a 5mm spot can be detected at a distance of 4m?
Answer:
Snellen acuity = d /D
test distance is 4m = 4000mm = numerator
Denominator = D, the distance at which the critical detail subtends 1’
tan 1′ = 5/D → D=5/tan 1′ = 17.2m
Snellen acuity = 4/17.2
Notes on Snellen Acuity
Variations in Snellen scores give contextual understanding of visual acuity levels.
Acuity such as 6/6 indicates 'good' vision, while 6/12 represents vision less than optimal.
6/6 means that the test is at 6 meters and the detail subtends 1 minute arc at 6m
6/12 means the test is at 6 meters and the detail subtends 1 minute of arc at 12m and 2 minutes of arc at 6m.
Increase D with respect to d then decrease VA
Decrease D with respect to d then increase VA.
Understand implications of age variations, where most observers exceed the average results of 6/6.
young observers, average acuity is 6/3 - 6/4.5
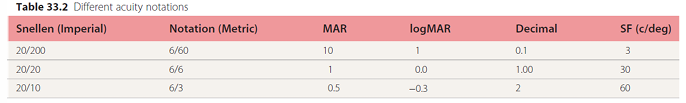
Decimal Acuity
System Usage
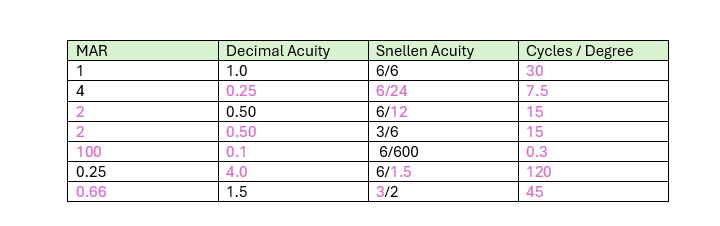
The decimal acuity system converts Snellen into decimals, simplifying comparisons between measures.
Understanding this system aids in determining visual standards across Europe.
decimal acuity is Snellen Expressed as a decimal (e.g., 6/3 = 2.0).
where lower values represent worse / poorer acuity.
decimal acuity = 1 / critical detail = 1 / MAR
Converting Between Systems
Conversion Techniques
Conversion strategies between Snellen, Decimal, and MAR are crucial for clinical assessments and documentation.
1. Snellen to Decimal
d/D to d ÷ D.
Example: Snellen 6/24 to decimal = 6÷24 = 0.25
2. Decimal to Snellen.
test distance (d) required.
Example: Decimal 0.25 to Snellen is 6/(6/0.25) = 6/24
3. Snellen to MAR
MAR = 1/Snellen
Example: Snellen 6/24 to MAR = (1/(6/24)) = 4 min arc.
4. MAR to Snellen
test distance required
(d/dx MAR)
Example: MAR 4 min arc to Snellen = 6/(6 × 4) = 6/24
Conversion to Contrast Sensitivity
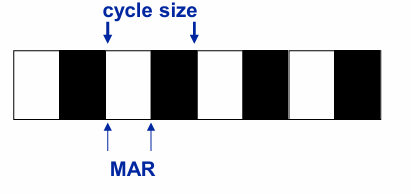
can use contrast sensitivity grating as a visual acuity stimulus.
For a grating, the unit Minimum Angle of Resolution (MAR) refers to the width of a dark stripe or of a white stripe. Cycle size (λ)
The formulae that relates contrast sensitivity (cycles per degree (cpd)) and MAR:
Period (min arc) = 2 MAR (min)
Period (deg) = 2 MAR (min) / 60 = MAR/30
frequency (cpd) = 1 / period (deg) = 1 / (MAR/30) = 30/MAR
Different Acuity notations
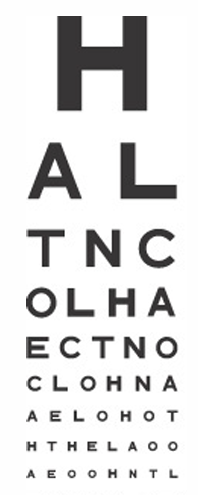
Problems with Snellen Charts
irregular size progression
different spacing between lines (crowding)
different spacing between letters (crowding)
truncation (stops at 6/5 or 6/6)
different numbers of letters on each line.
patient’s task is different if they have poor acuity compared with if they have good acuity.
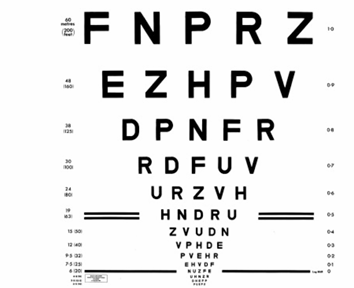
Bailey Lovie Charts (logMAR)
Chart based on design principles that had been discussed over the previous 70 years.
Equal number of letters on each line (5)
size change between each line is 0.1 log units (base 10)
spacing between letters also changes on a log basis.
smallest letters 6/3
size progression: 60, 48, 38, 30, 24, 19, 15, 12, 9.5, 7.5, 6, 4.8, 3.8, 3.0
logMAR Acuity
Application in Vision Testing
logMAR provides a standard for low vision and research contexts.
Facilitates more precise measurement of visual acuity.
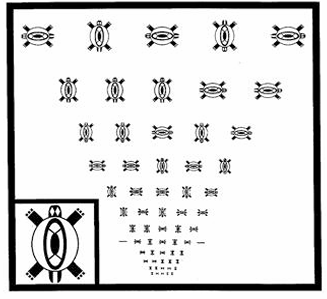
LogMAR principles also used in the Turtle Chart.
Limitations to Visual Acuity
Optical Constraints
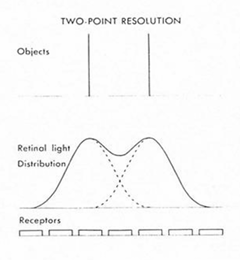
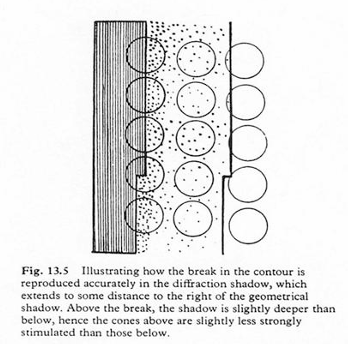
Optics of the eye spread retinal image of the target. Point in space forms a Gaussian-like distribution on the retina - PSF.
For targets consisting of 2 points (for a diffraction limited system), the limit of resolution is given by Rayleigh’s criterion.
Rayleigh’s criterion states that 2 point targets can be correctly resolved provided maxima of diffraction pattern of first point coincides with the first minima in the diffraction pattern of the second point.
for a complex object, the point spread functions of all the points within the complex object are convoluted to give a figure spread function.
Rayleigh's Criterion helps define resolution boundaries for clinically relevant two-point targets.
Anatomical/Physiological Limits
Retinal Influence
Retinal anatomy critical in establishing the limits of foveal resolution acuity.
limit is spacing of retinal cone mosaic at the retina
Known as the Nyquist Limit
The Nyquist limit contrasts with how two adjacent points may be resolved effectively.
For two adjacent points to be resolved, their retinal images must fall on separate cones.
for a Snellen letter, the limb-width is angular spacing of foveal cones.
Angular separation of foveal cones is ~ 2 microns; assuming a retina - posterior nodal plane distance of 16.67mm, this corresponds to:
MAR of 0.41 min of arc
Snellen 6/2.5
spatial frequency of 72 cpd.
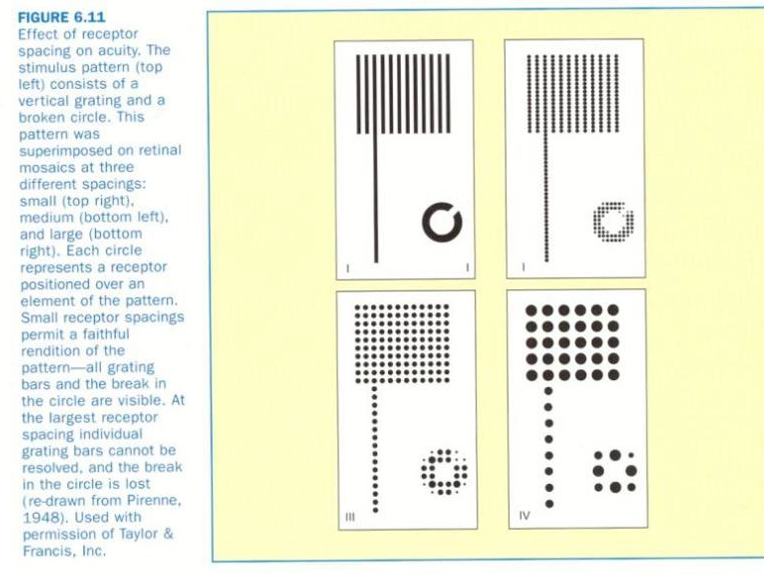
Morphology Impact
The spacing of retinal cones directly impacts the perceived quality of letters and shapes at different angles.
Task Design Effects - Detection Tasks
Absolute threshold
if the background is below absolute threshold then the detection acuity task is one of an absolute threshold determination.
Increment threshold
if the background is above absolute threshold for a given level of dark / light adaptation the detection acuity task is one of an increment threshold (∆L/L).
Task Design Effects - Localisation Tasks
Defined as a measure of the ability of the visual system to locate the relative position of objects as distinct from resolving spatial detail.
localisation acuity is hyperacuity
the ability of the human visual system to detect vernier offsets is of the order of 1-5” compared with the width of a cone which is ~ 25”
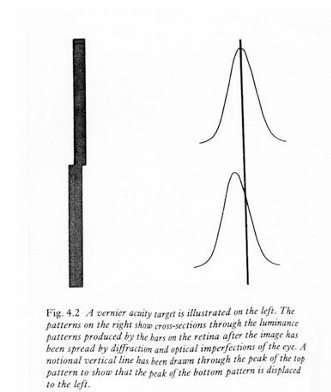
some spread in the retinal image (due to aberrations or diffraction) is important to localisation acuity
Vernier acuity is believed to occur at a cortical level and is related to the visual system’s ability to average luminance information across space to provide directional cues.
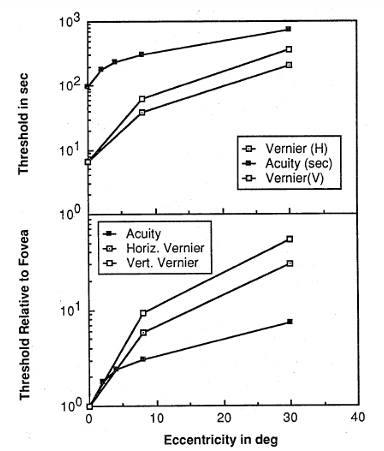
Vernier Acuity drops off (gets worse) much more quickly than visual acuity as you measure performance further away from the fovea into the periphery.
orientation sensitive
Mediated by striate and extrastriate cortical regions.
Factors Affecting Visual Acuity
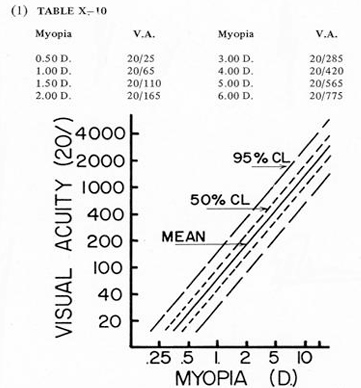
Optical Blur
Uncorrected refractive errors or insufficient accommodation decreases VA.
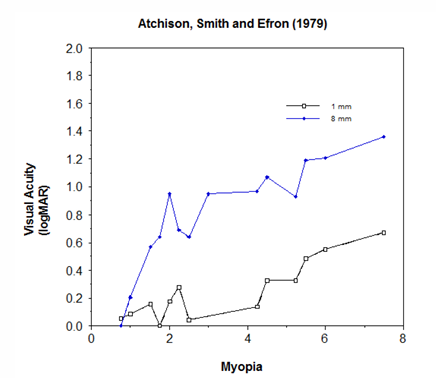
Myopic vs hyperopic refractive errors.
pre-presbyopic hyperopes, and especially young hyperopes, can accommodate over their hyperopia to some extent.
visual acuity will be better than would be expected in pre-presbyopic hyperopes based on optical blur alone.
Astigmatic defocus
roughly 1DC is equivalent to 0.5 DS
accommodation may be used to focus to different parts of the astigmatic interval.
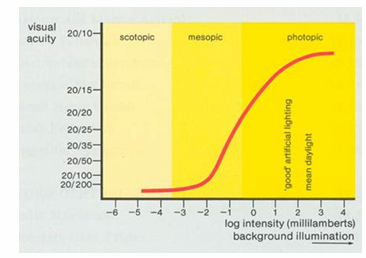
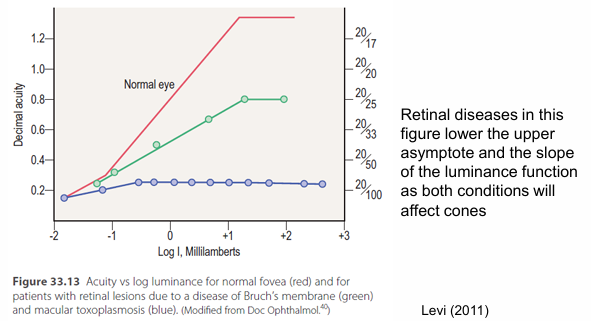
Retinal Illumination
Visual acuity increases with higher illumination as vision is cone mediated, and thus retinal mosaic is finer.
for very high luminance levels visual acuity is reduced due to glare effects.
Target Contrast
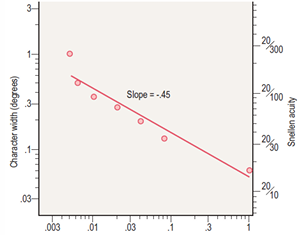
VA typically measured using high contrast (100%) optotypes.
reducing target contrast decreases VA (most noticeable when contrast is below 70%)
VA for letters varies linearly on log-log axes, with slope of -0.5 (i.e., VA decreases in proportion to square root of target contrast).
Clinical charts
Printed charts: Difficult to get better than 90% Weber contrast.
Projector chart: when room lights are on, contrast is reduced - room lights provide a wash.
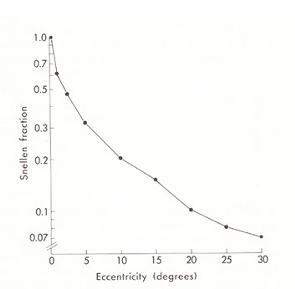
Retinal Location Effects
under photopic conditions, VA decreases with increasing eccentricity due to changes in photoreceptor and ganglion cell density.
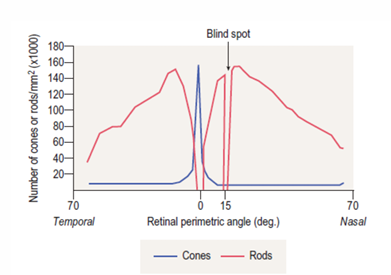
Under mesopic conditions the peak VA occurs at ~4o
Under scotopic conditions there is a foveal scotoma due to the absence of rod receptors in the fovea.
The blind spot occurs at approximately 15 degrees in the temporal field.
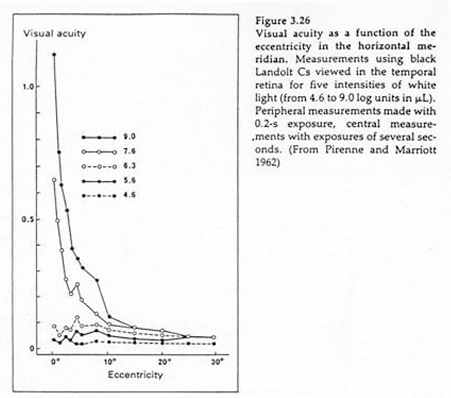
Decline in photopic VA with eccentricity is approximately linear.
Relates to cortical magnifications
cortical distance devoted to 1o of visual field is greater at the fovea than in the periphery
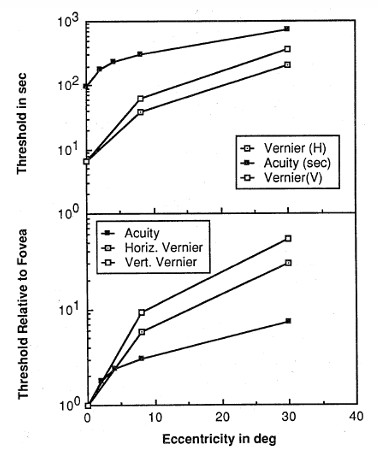
the rate of fall off with eccentricity varies dependent on the visual function measured:
vernier acuity has a steep fall-off with eccentricity, while the fall off in VA and CSF is shallower.
For a VA chart in which the letters are ‘scaled’ so that each letter covers approximately the same cortical distance.
VA would be equivalent regardless of eccentricity.
Crowding is also greater in peripheral than central vision - VA is reduced in the presence of neighbouring letters.
crowding does not reduce the contrast of letters but makes them appear jumbled and indistinct.
crowding in foveal vision is also found in some amblyopes.
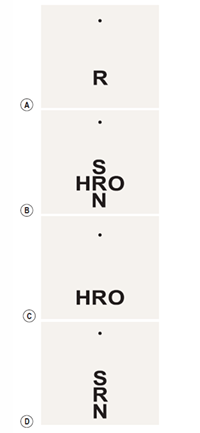
The reader can experience crowding by fixating the dot and trying to identify one letter.
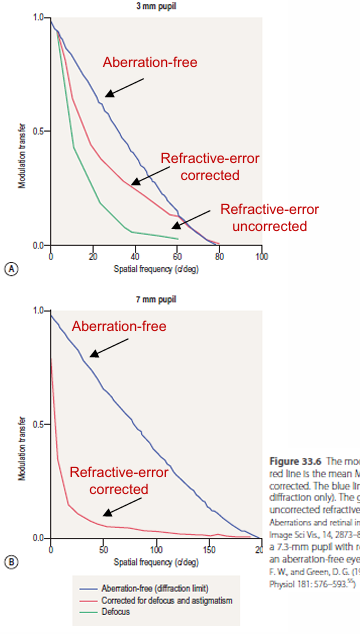
Pupil size
For an in-focus eye and fixed retinal illuminance, the optimum pupil size for VA is 2.5mm.
VA reduces for pupil size <2mm and > 6mm.
Diffraction becomes significant for pupil sizes < 2mm, while aberrations can become significant at pupil sizes > 6mm.
Pupil size will affect retinal illuminance if the target luminance is kept constant.
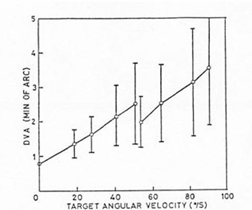
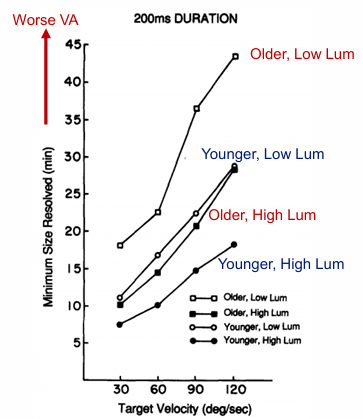
Motion Effects on Acuity
VA decreases as target velocity increases.
Magnitude of the decrease in VA for moving targets is dependent upon stimulus parameters.
light levels, as well as some patient factors such as practise effects.
Small involuntary eye movements have no effect on VA
if eye muscles are temporarily paralysed and image stabilised, the entire world gradually fades.
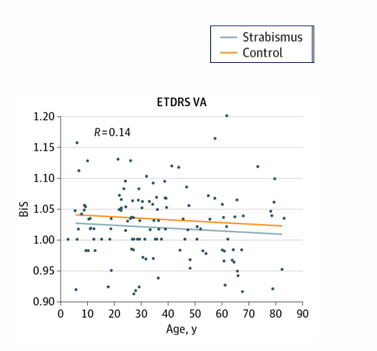
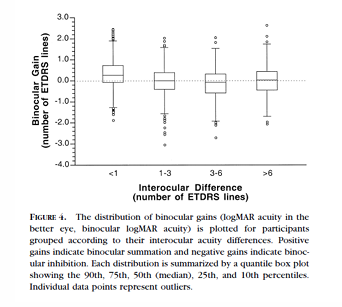
Binocular vs. Monocular Acuity
binocular VA is greater than monocular by about 10%
Differences are likely to be due to probability summation as well as binocular summing of the images at a cortical level.
summation is lower with increasing age and with increasing interocular differences between eyes.
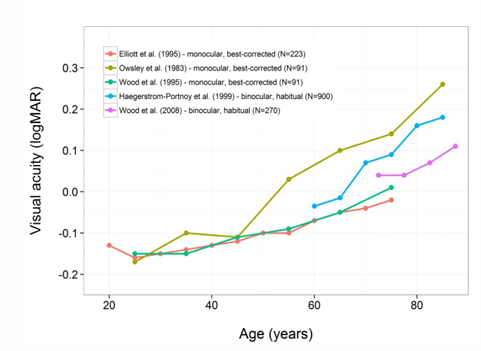
Age-Related Variance in VA
developmental studies have shown that VA increases significantly over the first year of life.
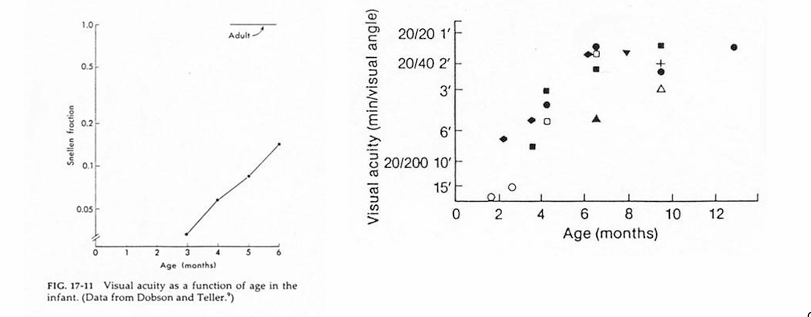
Questions to consider:
what factors are likely to be involved? cone lattice of adult vs newborn.
why does the rate of decline in VA with age vary between studies? monocular vs binocular.
Sample Questions
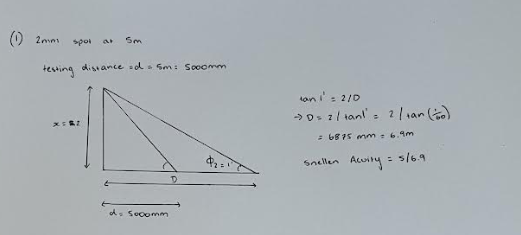
(1) What is the Snellen VA when a 2mm spot can be detected at a distance of 5m?
(2) What is the VA if the smallest critical detail that can be resolved at 4 m subtends 3′ of arc?
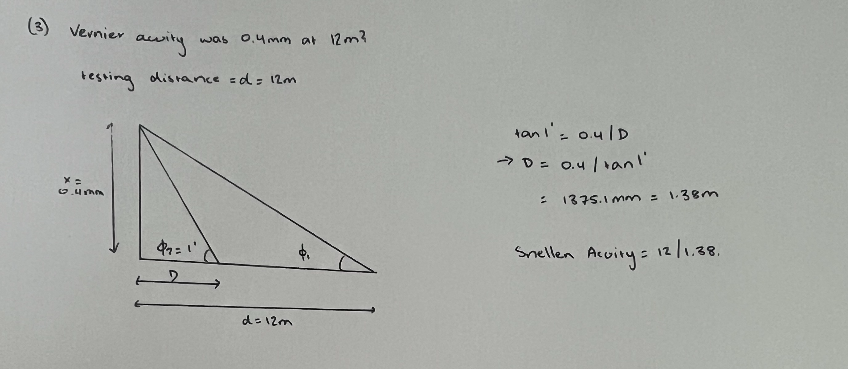
(3) What is the Snellen VA if the smallest displacement resolved in a vernier acuity test is 0.4 mm at 12 m?
(4) Complete visual acuity conversion table for MAR and cycles/degree.