19.3-4
A pedigree chart is a diagram that models the inheritance of phenotypes from one generation to the next. Pedigree charts are used by scientists, genetic counselors, and animal breeders. Pedigrees show inheritance across one or more generations. Individuals connected by a horizontal line have mated and had children. Vertical lines connect parents to their children. Siblings are generally shown from left to right according to birth order.

This simple pedigree chart shows a family in which the parents had three children. (Figure by Melissa Hardy is in the public domain).
In a pedigree chart, females are symbolized by a circle and males are symbolized by a square. Sometimes the gender of an individual is not identified in the pedigree; these individuals are symbolized by a diamond. A gender may not be specified in the pedigree for one of several reasons: the person’s gender may be unknown, the person may not identify as male or female, the person may be intersex, or the person’s gender may be withheld for privacy reasons. Sometimes diamonds are used for all individuals in a pedigree, when it is not clinically relevant to specify their gender.
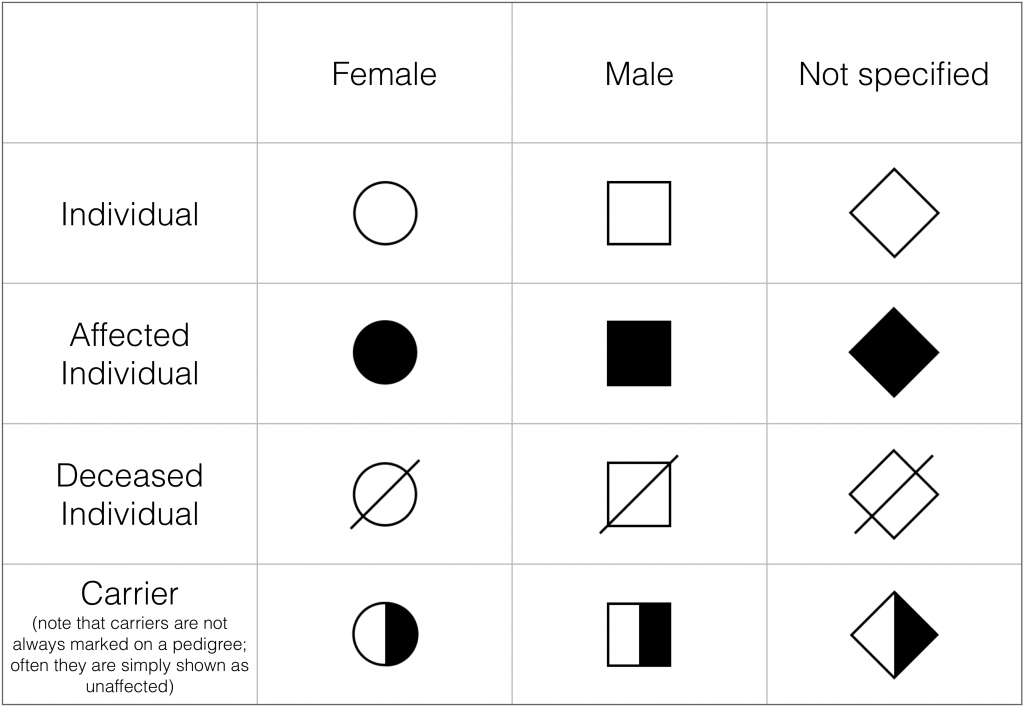
Some of the symbols used in pedigree charts. (Figure by Melissa Hardy is used under a Creative Commons Attribution license).
Shading represents that the individual is affected by the disease or condition. Pedigree charts do not always include shaded shapes, because sometimes a pedigree is constructed for a reason other than following a disease or condition. Sometimes heterozygotes are indicated by shading half of the shape, but often they are not indicated and are simply shown as unaffected.
Pedigrees can be used to study the genetics of inherited diseases. They can be analyzed to determine whether a genetic condition is autosomal or sex-linked, and whether it is dominant or recessive. We can also ask questions about the genotype of individuals on a pedigree given their phenotypes.
Pedigree Analysis
Pedigree charts display different patterns depending on which inheritance mechanism is responsible for the trait. Scientists can analyze pedigree charts to study how inherited disorders are transmitted. The most common modes of inheritance are autosomal recessive, autosomal dominant, X-linked recessive, and X-linked dominant. There are also a handful of Y-linked and mitochondrial disorders.
Autosomal Recessive Inheritance
Some genetic conditions are autosomal recessive, meaning that the gene involved is found on an autosome, and affected individuals have two copies of the allele that causes the condition. If an affected individual in a pedigree has two unaffected parents, the condition is most likely recessive. Additionally, if daughters in the pedigree have two unaffected parents, the condition is most likely autosomal recessive (unlike X-linked recessive conditions, in which an affected daughter will have an affected father). With autosomal recessive inheritance, males and females are equally likely to be affected.
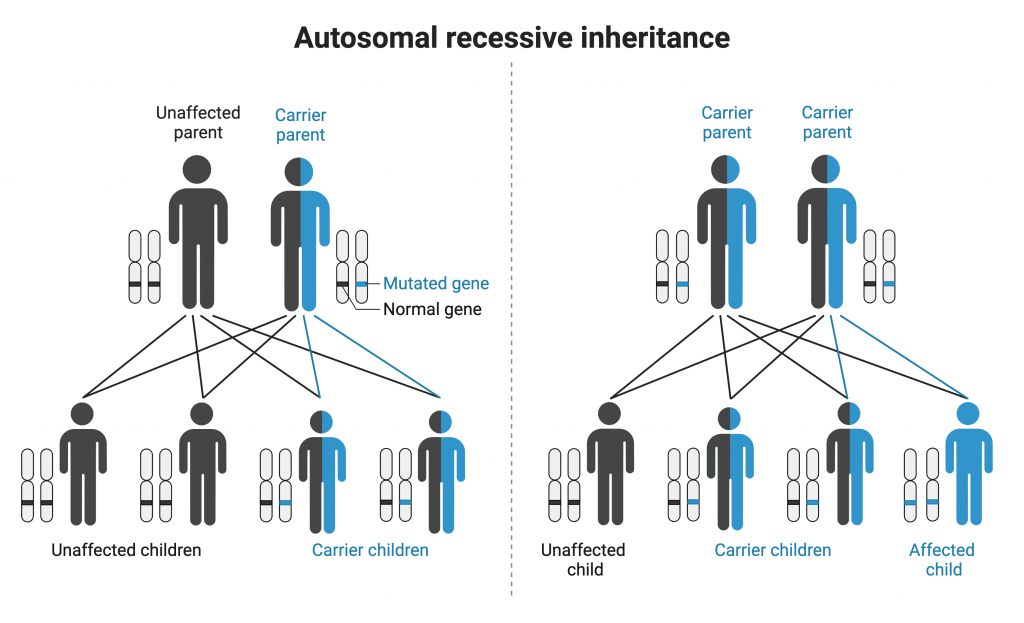
Individuals must have two copies of the mutated gene to display an autosomal recessive condition. Heterozygous individuals (carriers) can transmit the allele to offspring but are not themselves affected. (Autosomal Recessive Inheritance by Melissa Hardy is used under a Creative Commons Attribution-NonCommercial license. Created with BioRender.com)
Autosomal recessive conditions in humans include cystic fibrosis, sickle cell disease, Tay-Sachs disease, and phenylketonuria.

An example of a pedigree chart for an autosomal recessive condition. From this pedigree, we can infer that individuals 1, 2, 3, 4, and 11 are carriers. There is not enough information to determine the genotype of individuals 5, 6, 8, and 9. (Autosomal recessive pedigree by Melissa Hardy is in the public domain).
It is helpful to be able to assign genotypes to all individuals on a pedigree chart in order to predict if it is possible that an individual might pass along a mutant allele to their offspring. When the inheritance mechanism is autosomal recessive, it is helpful to start with affected individuals. All affected individuals are expected to be homozygous recessive in genotype (for example, genotype aa). Looking at individual 7 on the pedigree chart above, we would then recognize that both parents (individuals 1 and 2) must carry a copy of the mutant allele. Both parents are expected to be heterozygous in genotype because neither one is affected by the trait. One can then determine the genotypes of the siblings of individual 7. Here, we do not know whether individuals 5 and 6 are heterozygous or homozygous for the normal allele because no offspring are shown. However, we can conclude that individual 4 is heterozygous for the relevant gene because her daughter (individual 10) expresses the trait. Furthermore, one can conclude that both individual 3 and individual 11 must also be heterozygous for the relevant gene.
Autosomal Dominant Inheritance
Genetic conditions can display autosomal dominance. In this mode of transmission, a single mutant allele is sufficient to cause the condition because the mutant allele is dominant over the normal allele. Affected children generally have at least one affected parent (although not always, because some conditions display incomplete penetrance, meaning that not every individual with the allele will display the phenotype). Males and females are equally affected.
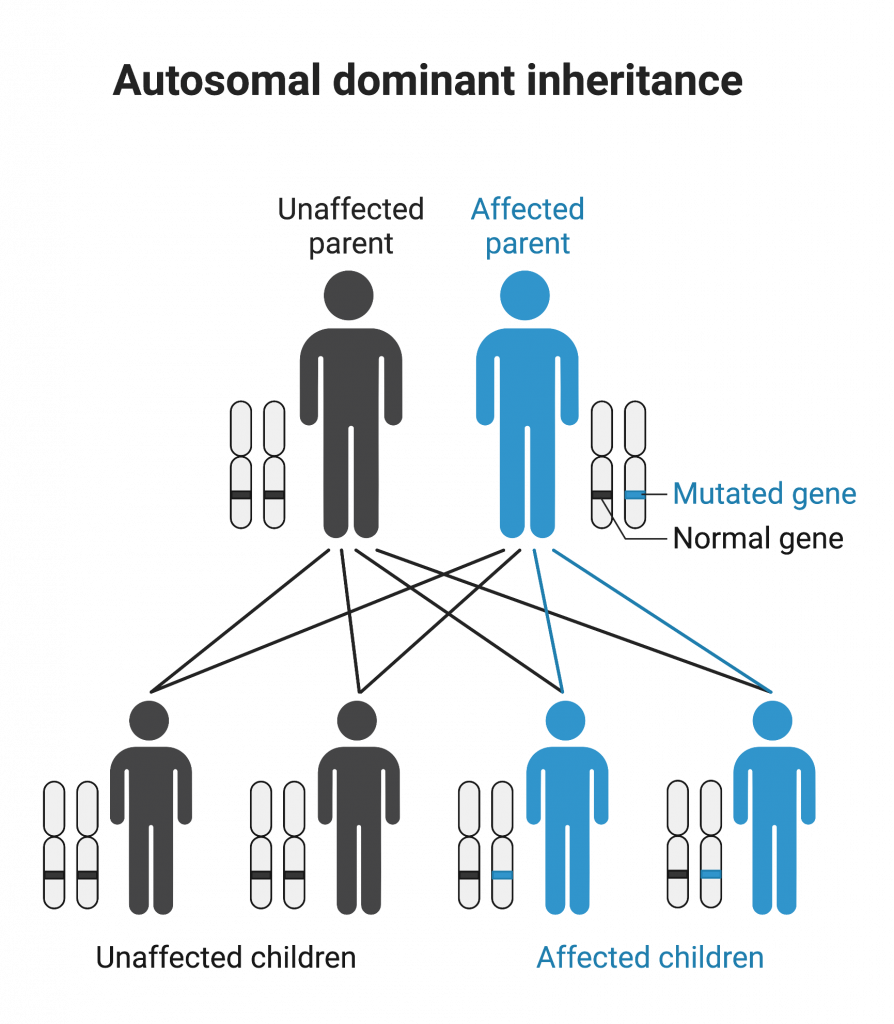
One copy of the mutant allele is sufficient to develop an autosomal dominant condition. In contrast, an individual must have two copies of the mutant allele to display an autosomal recessive condition. (Autosomal Dominant Inheritance by Melissa Hardy is used under a Creative Commons Attribution-NonCommercial license. Created with BioRender.com)
Autosomal dominant conditions in humans include Marfan syndrome, Huntington’s disease, and achondroplasia.

An example of a pedigree chart showing inheritance of an autosomal dominant condition. All affected individuals have at least one copy of the mutated allele. Unaffected individuals are homozygous recessive. (Autosomal dominant pedigree by Melissa Hardy is in the public domain).
Let’s think about assigning genotypes to individuals on a pedigree chart representing an autosomal dominant trait. Each affected individual must have one or two copies of the mutant allele; each unaffected individual is expected to be homozygous for the normal allele (genotype aa). One of the 4 children of parents 1 and 2 is not affected by the trait and hence must have two copies of the normal allele which acts in a recessive fashion (genotype aa). This would suggest that individual 1 is heterozygous in genotype (Aa). Furthermore, individuals 6, 8, and 9 are also expected to be heterozygous because their father is homozygous recessive in genotype.
X-linked Recessive Inheritance
Some conditions are sex-linked, meaning the gene that causes the condition is on one of the sex chromosomes. In mammals, this is usually the X chromosome, because the X chromosome is much larger and has many more genes. X-linked recessive conditions are much more common in males, because they have only one X chromosome. Therefore, if they inherit an X chromosome with the mutated allele that causes the condition, they will display the condition. Females must inherit two copies to display an X-linked recessive condition. Males cannot be carriers; they will either be affected or unaffected, depending on which allele they inherit on the X chromosome.
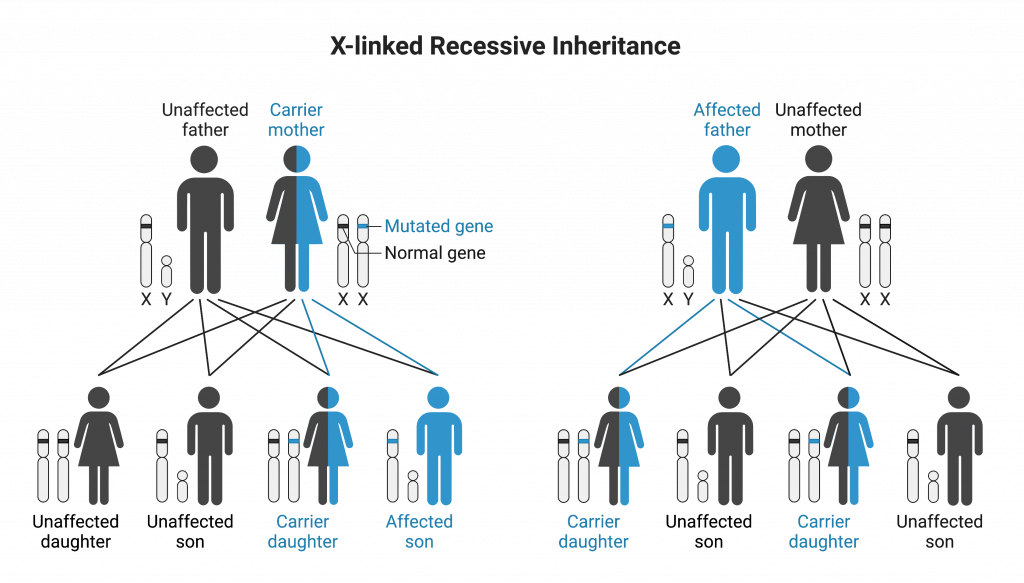
X-linked recessive conditions affect males at a higher frequency than females because of how the X chromosome is inherited. (X-linked recessive inheritance by Melissa Hardy is used under a Creative Commons Attribution-NonCommercial license. Created with BioRender.com).
In pedigrees that display X-linked recessive inheritance, sons of a carrier mother and an unaffected father have a 50% chance of being affected, while daughters will not be affected, but have a 50% chance of being carriers (heterozygotes). Sons of an affected mother will all be affected. There is no father-to-son transmission of X-linked traits.

X-linked recessive conditions affect males at a higher rate than females, since females have two X chromosomes and males only one. (X-linked recessive pedigree by Melissa Hardy is in the public domain).
Examples of X-linked recessive conditions include Duchenne muscular dystrophy, the most common form of color blindness, and hemophilia A and B.
To assign genotypes to individuals on a pedigree chart representing an X-linked recessive trait, it is important to recognize two things: 1. Males only have one copy of the X chromosome and females have two copies, and 2) the presence of one normal allele will result in an unaffected individual. Thus all unaffected males will have a copy of the normal allele (genotype XAY, and all affected males will have a copy of the mutant allele (genotype XaY). All three of the affected males are expected to have the XaY genotype, having received the X chromosome from their mother. Thus individuals 1 and 7 are both heterozygous females with genotype XAXa.
X-linked Dominant Inheritance
Conditions that display X-linked dominant inheritance are less common than X-linked recessive conditions. For this mode of inheritance, affected fathers will pass on the allele and condition to all of their daughters. Sons of an affected, heterozygous mother have a 50% chance of being affected.
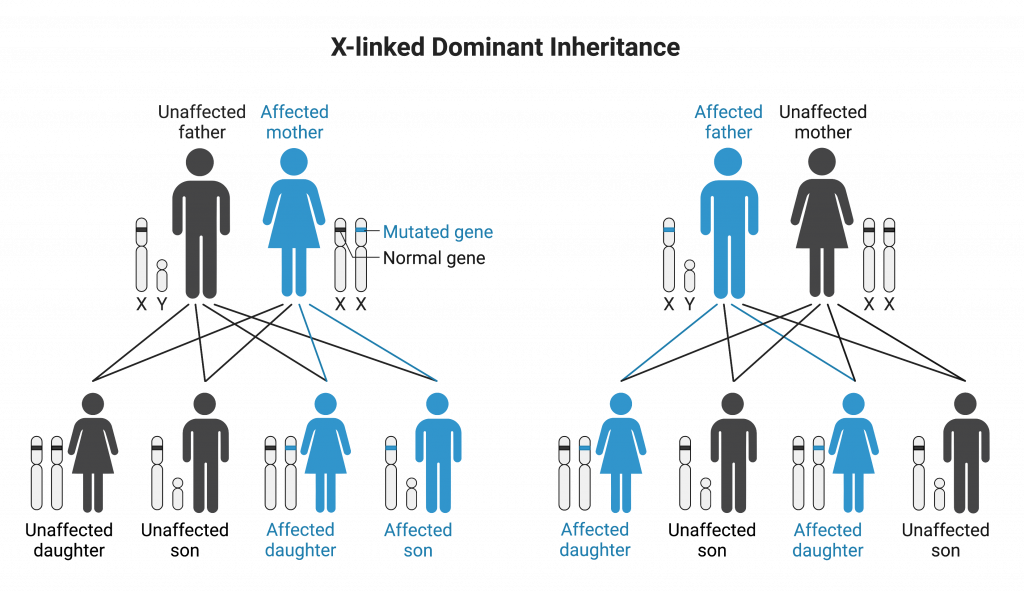
Dominant alleles can also be transmitted on the X chromosome. (X-linked dominant inheritance by Melissa Hardy is used under a Creative Commons Attribution-NonCommercial license. Created with BioRender.com).
Examples of X-linked dominant inheritance include Rett syndrome and most cases of Alport syndrome.

An example of a pedigree chart displaying an X-linked dominant condition. (X-linked dominant pedigree by Melissa Hardy is in the public domain).
In order for a daughter to be homozygous for the mutant allele, both of her parents must be affected by the mutant trait. Thus all affected females on this chart are heterozygous in genotype. Mendel’s studies in pea plants implied that the sum of an individual’s phenotype was controlled by genes, such that every characteristic was distinctly and completely controlled by a single gene. However, single observable characteristics are almost always under the influence of multiple genes (each with two or more alleles). For example, multiple genes contribute to eye color in humans.
In some cases, several genes can contribute to aspects of a common phenotype without their gene products ever directly interacting. In the case of organ development, for instance, genes may be expressed sequentially, with each gene adding to the complexity and specificity of the organ. Genes may function in complementary or synergistic fashions, such that two or more genes need to be expressed simultaneously to affect a phenotype. Genes may also oppose each other, with one gene modifying the expression of another.
Epistasis
In epistasis, the interaction between genes is antagonistic, such that one gene masks or interferes with the expression of another. “Epistasis” is a word composed of Greek roots that mean “standing upon.” Often the biochemical basis of epistasis is a gene pathway in which the expression of one gene is dependent on the function of a gene that precedes or follows it in the pathway.
An example of epistasis is pigmentation in mice. The wild-type coat color, agouti (AA), is dominant to solid-colored fur (aa). However, a separate gene (C) is necessary for pigment production. A mouse with a recessive c allele at this locus is unable to produce pigment and is albino regardless of the allele present at locus A. Therefore, the genotypes AAcc, Aacc, and aacc all produce the same albino phenotype. A cross between heterozygotes for both genes (AaCc x AaCc) would generate offspring with a phenotypic ratio of 9 agouti:3 solid color:4 albino. In this case, the C gene is epistatic to the A gene.
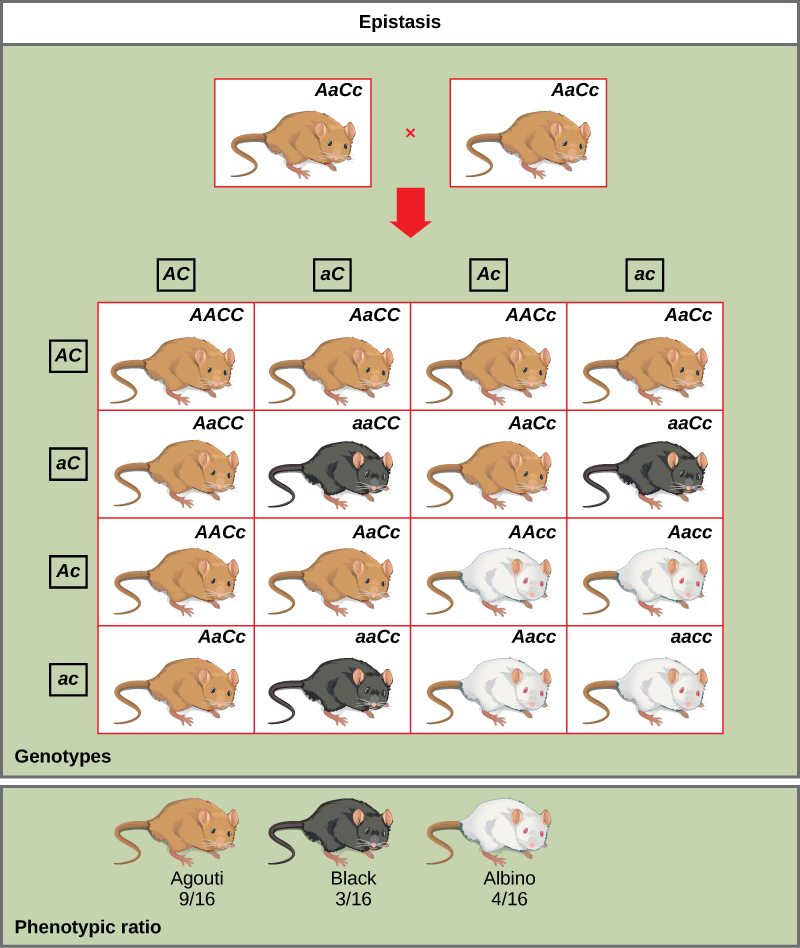
In mice, the mottled agouti coat color (A) is dominant to a solid coloration, such as black or gray. A gene at a separate locus (C) is responsible for pigment production. The recessive c allele does not produce pigment, and a mouse with the homozygous recessive cc genotype is albino regardless of the allele present at the A locus. Thus, the C gene is epistatic to the A gene. (Figure by OpenStax is used under a Creative Commons Attribution license).
As you work through genetics problems, keep in mind that any single characteristic that results in a phenotypic ratio that totals 16 is typical of a two-gene interaction. Recall the phenotypic inheritance pattern for Mendel’s dihybrid cross, which considered two noninteracting genes—9:3:3:1. Similarly, we would expect interacting gene pairs to also exhibit ratios expressed as 16 parts. Note that we are assuming the interacting genes are not linked; they are still assorting independently into gametes.
Now we will think about this same example of epistasis in a different way – by analyzing a two-step biochemical pathway that represents the mechanism by which fur color is determined in mice:

In this pathway, enzyme C is able to convert albino fur to black fur, and enzyme A is able to convert black fur to agouti fur.
This diagram suggests that enzyme “C” is able to convert albino fur to black and enzyme “A” is able to convert black fur to agouti. You should recall that every enzyme has an active site that binds to substrates but not to non-substrates. In this example, the active site of enzyme A will bind to the “black molecule” but not to the “albino” molecule. Therefore, a functional enzyme A cannot produce an agouti mouse unless functional enzyme C is also present in the mouse.
Polygenic Inheritance
As the name polygenic inheritance implies, this inheritance mechanism involves multiple genes that work together to determine the phenotype of a particular characteristic (similar to epistasis). However, polygenic inheritance is different from epistasis in that each of these genes encodes the same function. Two examples of polygenic inheritance in humans are height and skin pigmentation.
Let’s imagine that there are 4 different genes that contribute to human height and that two different alleles are possible for each of these genes. One of the alleles for each gene provides a dose of height in an additive way (referred to as an additive allele and represented by a capital letter) whereas the other does not provide such a dose (represented by a lower-case letter and referred to as a non-additive allele). Thus, polygenic inheritance is similar to incomplete dominance except that additional intermediate phenotypes are possible. To simplify the analysis of a polygenic trait, it is assumed that a dose of height contributed by an additive allele of gene A is the same as a dose of height contributed by an additive allele of gene B, etc. Thus, an individual of genotype AaBbCcDd is expected to have the same height as an individual of genotype AAbbccDD since both of these individuals have the same number of additive alleles in their genotypes.
To learn how to recognize polygenic inheritance, we will analyze a cross between two individuals of known genotype: AaBbccDd (3 doses of height) and AaBbccdd (2 doses of height). As with any inheritance mechanism, we must first identify the possible gamete types each parent can produce and place them into a Punnett square. Rather than naming the genotypes of all offspring types from this cross, we will simply count the number of additive alleles.
ABcD | ABcd | AbcD | aBcD | Abcd | aBcd | abcD | abcd | |
ABcd | 5 | 4 | 4 | 4 | 3 | 3 | 3 | 2 |
Abcd | 4 | 3 | 3 | 3 | 2 | 2 | 2 | 1 |
aBcd | 4 | 3 | 3 | 3 | 2 | 2 | 2 | 1 |
abcd | 3 | 2 | 2 | 2 | 1 | 1 | 1 | 0 |
Six different phenotypes are expected among the offspring in the ratio: 1/32 with 5 additive alleles, 5/32 with 4 additive alleles, 10/32 with 3 additive alleles, 10/32 with 2 additive alleles, 5/32 with 1 additive allele and 1/32 with 0 additive alleles. Notice that multiple gradations of phenotype are expected, and that offspring with an extreme phenotype are rare (frequency of 0 additive alleles = 1/32) compared to offspring with intermediate phenotypes (frequency of 2 additive alleles = 10/32). Both of these features are expected whenever polygenic inheritance is operative.
 Knowt
Knowt