Week 6_ECMT1020
Multiple Regression Model
What does a model with 2 explanatory variables look like?
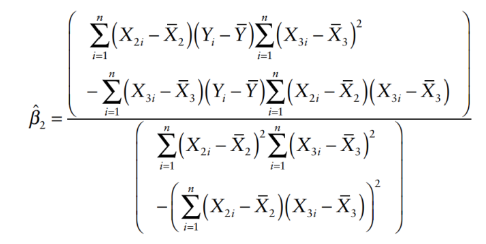
How to derive multiple regression coefficients?
Not necessarily being tested on but knowing how it derived can be great.
It is not practical to write down the expression for all regression coefficient when there are more than 2 explanatory variables.
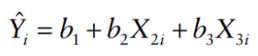
Suppose we have a general case:
Suppose we also have a fitted (estimator) model:
We always want to minimize RSS to make sure the fitted model = the true model:
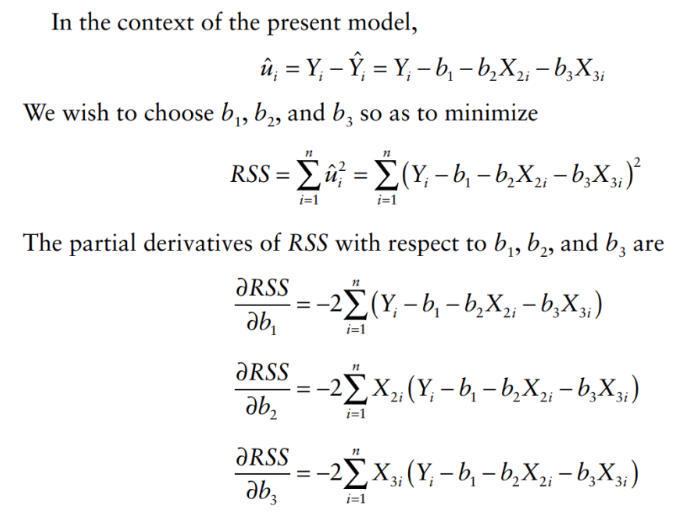
Steps:
Find residuals
Find RSS
Partial derivative for each regression coefficient to obtain the minimize values (first derivative = 0)
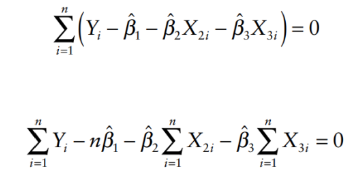
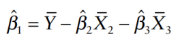
Simplify the equation to obtain for regression coefficients
How to interpret multiple regression coefficients?
Each regression coefficient estimates the influence of its corresponding variable on the dependent variable (Y), controlling for others.
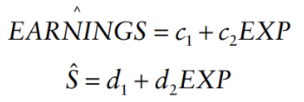
e.g. more school = more earning, but more work experience also = more earning, how to influence Y the right way?
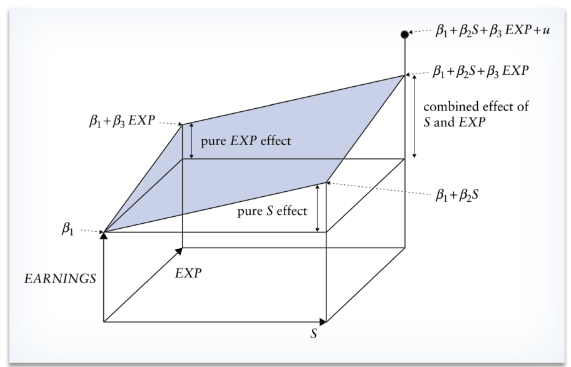
The Frisch–Waugh–Lovell theorem supports that the slope coefficient estimates remain consistent when isolating variables.
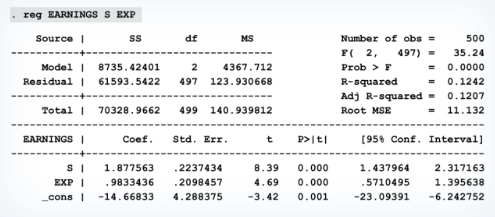
For example: we will try to purge Earnings (Y) and S (a reg. coefficient) of their EXP (a reg. coefficient):
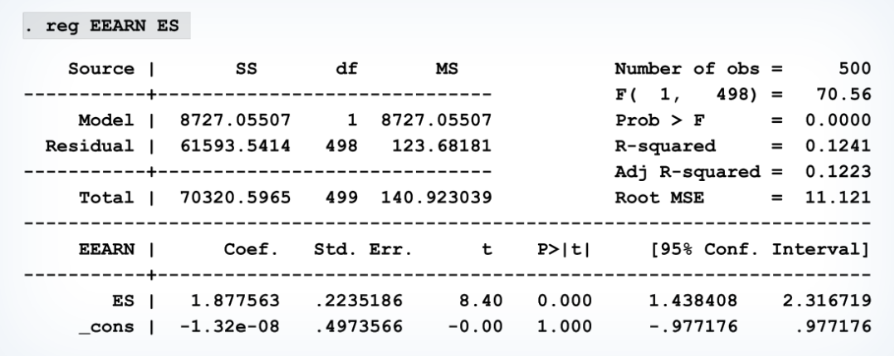
regress both of them on EXP/obtain the fitted value (this meant we split the multiple regression model to simple regression model):
subtract fitted value from the actual value:
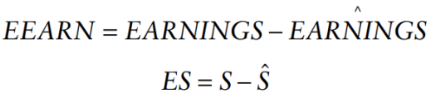
now we just have one regression coefficient, we have removed the influence of another variable (in this case, EXP):
What are the assumptions of the multiple regression coefficients?
Six assumptions for multiple regression models are restated from Chapter 2:
model is linear in parameters and correctly specified.
there doesn’t exist an exact linear relationship among the regressors in the sample.
The disturbance term has zero expectation.
the disturbance term is homoskedastic (residuals are constant).
the values of the disturbance term have independent distributions.
the disturbance term has a normal distribution.
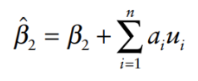
How to assess unbiasedness in multiple regression coefficient estimator?
We have a case of simple regression model:
where:
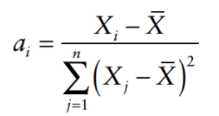
We take the expected value of the simple regression model:
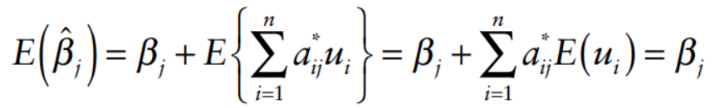
Estimators of slope coefficients are unbiased.
How do we assess for efficiency in multiple regression coefficients?
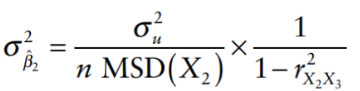
We have the variance of the multiple regression coefficients:
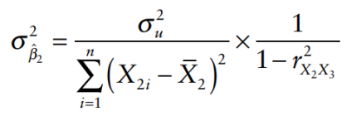
higher correlation = higher variance = model is not efficient
We can rewrite the variance equation as:
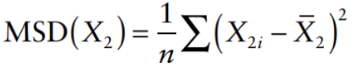
where MSD(X2) is the mean square deviation of X2, given by:
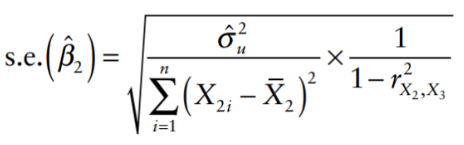
The standard error can be given by:
What is “multicollinearity”?
Definition: High correlation between explanatory variables can lead to unreliable coefficient estimates.
Increased correlation results in larger variances of coefficient distributions.
Implications:
Multicollinearity is common and generally not problematic; OLS estimators remain unbiased but may have increased variance.
Exact linear relationships between variables prevent the identification of the true model.
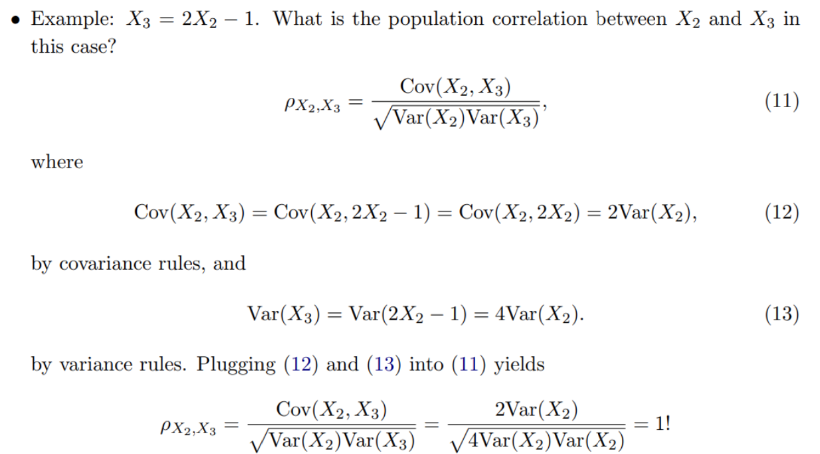
This means X2 and X3 are perfectly (high) correlated, which can cause issues in regression models by making it difficult to determine the individual effect of each variable.
not be able to identify the true model.
not be able to compute OLS estimator (value will be infinity).
How to address the problem for multicollinearity?
Direct Methods:
Reduce variance of disturbance term by adding omitted variables as regressors.
Increase sample size.
Indirect Methods:
Combine correlated variables into an index.
Remove insignificant correlated variables.
Use additional information regarding coefficients.
What is “Goodness of Fit: R²” like in multiple regression model?
R² measures the proportion of variance in the dependent variable explained by the model.
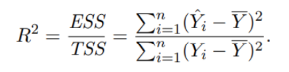
Total Sum of Squares (TSS) can be decomposed into Explained Sum of Squares (ESS) and Residual Sum of Squares (RSS).
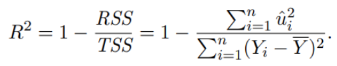
R² will not decrease when adding more variables; it generally increases.
Adjusted R²: A modified version of R² that accounts for the number of predictors in the model.
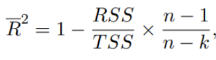
where k is the number of parameters in the regression model, and the factor (n-1)/(n-k) act as a penalization for extra parameters.