Research Methods
Introduction
Features of Science
Falsifiable: For a claim to be scientific, it should be open to testing, such that it could be ‘proven wrong’.
Objective: Scientists’ expectations or bias should not affect their recordings.
Replicable: Chance results are always a possibility, so to demonstrate the validity of a finding it must be repeated. It is therefore important that scientists record their methods carefully.
Systematic: Research should be carried out according to a plan, in an efficient and thorough manner.
Controlled: Varying one factor (IV) and measuring its effect on another (DV) allows casual conclusions to be drawn, if all other factors are constant.
Empirical: Information must be gained through direct observation/experimentation as opposed to reasoned argument or belief. It must be evidence based.
Aims: An aim is a statement of a study’s purpose. Research should state its aim beforehand so it’s clear what the study intends to investigate.
Hypothesis: A clear statement of the relationship between an independent and dependent variable.
Operationalisation: Clearly defining variables in terms of how they can be measured.
Independent Variable: The variable that is purposely manipulated by the researcher.
Dependent Variable: The variable that is measured by the researcher and should be caused by the Independent Variable.
Hypothesis
Hypotheses are clear statements of what is actually being tested. The hypothesis is proposed at the beginning and is often generated from a theory. It is a statement of the relationship between an independent and dependent variable.
A Null hypothesis states there is no difference between the independent and dependent variable. There is no effect.
A alternative/ experimental hypothesis states there is an effect between the independent and dependent variables. This can be directional or non-directional. A directional experiment hypothesis states the expected direction of the results of an investigation. A non-directional one states there is a difference yet does not state the expected direction of the results.
Variables
Independent variable: The variable which is either manipulated by a researcher or varies naturally so that the effect on a dependent variable is measured.
Dependent variable: The variable which is measured by the researcher in a experiment. Changes in this variable are caused by the change in the IV.
Extraneous Variables: Any variable in a study which could potentially influence the DV other than IV. They make identifying a trend more difficult.
Participant Variables are extraneous variables to do with the participant.
Age, Intelligence, Gender.
Situational Variables are extraneous variables to do with the scenario.
Time of Day, Temperature of the lab, Noise.
Confounding Variables: Any variable in a study which could potentially influence the DV but varies systematically with the IV.
Demand Characteristics: Result from cues which arise from the researcher or the research situation which may lead a participant to respond in a certain way during the experiment. Participants try to work out the aim of the study. The “please you effect’ or the ‘screw you effect’ may also occur.
Social Desirability Bias: When participants want to look good so change their behaviour or answers to best please societal expectations.
The investigator may be affected by their own expectations for the study and their hypothesis. This could affect their interaction with participants. If the experimenter may give away too much information, participants may act with demand characteristics. Being observed may also make participants act differently.
To avoid this researchers must to be careful about instructions and standardisation.
Standardisation: all participants should be subject to the same environment, information, and experience. Standardised instructions which should be read out to participants in a set way, with set mannerisms.
Sampling
Randomisation: The use of chance wherever possible in order to reduce the researcher’s influence on the design of an investigation. Random allocation of participants to conditions, random generation of stimuli.
Population: A large group of people the researcher is interested in studying.
Target Population: A specific group of people the research is interested in studying.
Sample: The small group of people from the target population that participate in the study.
Random Sample
When everyone in the target population has an equal chance of being picked. Participants are chosen by computer-generation, or simply drawing names from a hat.
It can get a perfect sample.
Rare as it’s hard to get a population list.
Systematic Sample
Selecting participants at set points on a list. Every 10th participant is chosen, for example.
Ensures representative sample from each group such as age, gender.
Rare as it’s hard to get a population list.
Opportunity Sample
Where whoever is able and willing to take part is chosen. Whoever is asked, including friends, family, colleagues.
Easy and practical.
Likely to produce biased results.
Stratified Sample
The researcher identifies the different strata that make up the population - for example year groups in a school. Then the population for that sample is worked out in order for it to be representative - 10 year 7’s to represent 100, 20 year 13’s to represent 200. The participants that make up each stratum are selected using random sampling.
Avoids researcher bias as the proportions that make up the numbers are randomly selected.
It is representative so generalisation becomes possible.
Stratification is not perfect
The sub-groups strata cannot reflect all the ways people are different so complete representation and generalisation is never possible.
Volunteer Sample
The experiment is advertised and participants are willing volunteers.
Bias
Bias: Only viewing things from one perspective without considering other possibilities.
Gender Bias: Occurs when one gender is favoured over another. Could happen if the research was based on male-only or female-only participants or if the researcher is the same gender as the participants, so may favour that gender.
Cultural Bias: Occurs when one culture is favoured over another. Could happen if the researcher’s perspective on findings is affected by their own cultural experiences or if researchers generalise their findings as universal without comparing different cultures.
Experiment Bias: This can be supporting their theory. Occurs when one theory is favoured over another, so the researcher sets up an experiment and interpret the results to fit the preferred theory.
Experiment Design
Experimental design is how participants are allocated to different groups in an experiment.
Laboratory
An experiment that takes place in a specific environment whereby different variables can be carefully controlled. A strength of this is the high degree of control, all the variables are controlled and the IV has been precisely replicated leading to greater accuracy. Replication is another strength - researchers can repeat experiments and check the validity of the results. However, a limitation of this design is experimenter’s bias. This bias can affect the results and participants may be influenced by these expectations. Furthermore, this design has low ecological validity as it uses artificial situations.
Field
An experiment conducted in a more natural environment but with variables still being well controlled. A strength is that it is naturalistic resulting in more natural behaviours hence high ecological validity. There is higher control of the IV. On the other hand, this design has to specially consider ethical issues - such as invasion of privacy and consent as most field experiments would have no informed consent. There is a loss of control over extraneous variables hence precise replication is not possible.
Quasi
An experiment whereby the IV has not been determined instead it naturally exists, for example gender difference studies.
Kinds of Data
Quantification: Scientists collect data that can be analysed and statistically tested for.
Percentages: difference/total * 100 = percentage
Ratios: part-to-whole, or part-to-part
Probability: the probability that the results of a particular study sample occurred even if there was no real difference in the population.
Kinds of Data
Qualitative Data: data that describes meaning and experiences which is expressed in words. It is richer and has more ecological validity, but is harder to categorise, analyse, and compare.
Quantitative Data: data that focuses on numbers and frequencies which can be counted. It is easier to categorise, analyse and compare but has low ecological validity and can lack depth.
Primary Data: data that is collected by a researcher for the experiment they are conducting, obtained first-hand. It is also the raw data collected from the different techniques.
Secondary Data: data that already exists but used in a different experiment, collected from existing sources. It is also data that needs to be manipulated to understand and establish a relationship.
Meta-analysis: data from a large number of studies are combined. A simple discussion of the overall findings is a qualitative analysis. If statistical analysis of the combined data is a quantitative approach. In this approach, an effect size is calculated (the dependent variable) which gives an overall statistical measure of difference between variables across a number of studies. Meta-analysis allows data to be viewed with more confidence, and can be generalised across larger populations. However, it is prone to publication bias meaning the data may not reflect all relevant data causing incorrect conclusions to be drawn.
Descriptive Statistics
Measures of central tendency
Mode: most common number in the data set. There can be two modes (bi-modal). Can be used for category data but is not representative of the whole data set.
Median: the middle score after the data has been put into numerical order. Not effected by extreme scores but less sensitive as not all scores are included.
Mean: add all the scores together and divide them by the number there are. This gives the average score each participant would receive. Most sensitive as it includes all scores but can be distorted by extreme values.
Measures of dispersion (spread)
Range: the difference between the highest score and lowest. It is easy to calculate but only takes into account extreme values.
Standard Deviation: the degree of variation between the mean. The larger the SD the more variability there is in a set of data. It is much more precise than range, but like the mean, can be easily distorted by anomalous data. It is also time consuming to calculate.
Correlations
A statistical technique for analysing the relationship between two sets of numerical scores (co-variables). Correlations are represented using scattergrams.
Experiments involve the manipulation of the independent variable to measure the effect on the dependent variable. The deliberate change in the IV allows psychologists to infer that the IV causes any observed changes in the DV. However, a correlation analysis does not involve any manipulation of variables. This makes it impossible yo establish a ‘cause-and-effect’ relationship unlike in an experiment.
A correlation coefficient has a maximum value of +1 and a minimum value of -1 (perfect positive to perfect negative correlations). The coefficient tells how closely the co-variables are related. Some correlations are not a simple straight-line relationship. For example, the Yerkes-Dodson law of arousal states that performance is at its best when there is a moderate level of arousal, the correlation resembles an arch.
Intervening Variables
Some correlations may suggest a link or relationship between two variables when in reality there is no link. Instead there is a third variable causing the other two to change, this is an intervening variable.
Strengths
Easy to see connection
Easily replicable
Cheap and quick (secondary data)
Used when impossible, impractical, or unethical to carry put an experiment
Limitations
Methods of measurement may lack validity
Large amount of data needed to be informative
Misinterpretation - don’t know which of the two variables caused the correlation
Intervening variables
Graphs
A graph needs:
A title
Each Axis labelled
Data potted accurately
With experimental data, the independent variable is placed on the x-axis while the dependent variable is on the y-axis.
Bar Charts are used to represent discrete data, data which is in categories that are placed on the x-axis. The columns do not touch. For example, score on a depression scale before and after treatment.
Histograms are used to represent continuous data, the columns touch because each one forms a single score on a related scale eg the number of hours of homework students do each week. The height of the column shows the frequency of values.
Frequency Polygons are used as an alternative to histograms. The line shows where the mid-point of each column on a histogram would reach.
Pie Charts show proportions in a legible way. It shows percentages with the full 360 degrees representing a full 100%.
Scattergams/Scattergraphs are used for measuring the relationship between two variables. The pattern of plotted points reveals different types of correlations.
Line Graphs represent continuous data but they link up a line to show the continuous trend. For example recall over a passage of time.
Distribution
Normal distributions are often shaped like a Bell-Curve. For example IQ. The mean, median and mode are all the exact mid-point causing the distribution to be symmetrical. The dispersion the scores is consistent and can be expressed as standard deviations.
Positive Skew: the mean has been shifted over to the right due to the high scores in the minority. The peak is to the left. A difficult Psychology test would produce this skew.
Negative Skew: the mean has been shifted over to the left due to the low scores in the minority. The peak is to the right. An easy Psychology test would produce this skew
Statistical Testing
Hypothesis: a testable statement tat states the relationship or difference between the variables being examined. These can be either directional (one-tailed) which predict the direction of the results, or non-directional (two-tailed) which states there is a difference but does not predict which direction it will go.
Null Hypothesis: states that there is no difference or relationship between the variables, any difference seen is due to chance.
Probability: the numerical value that represents the likelihood of an event happening. The probability, p, is the likelihood that the results are due to chance rather than the IV having affected the DV.
Significance: a statistical term which indicates that the association between variables is strong enough to accept the experimental hypothesis.
Inferential Testing: a way of determining whether the null hypothesis should be accepted or rejected, and the hypothesis can be accepted or declined.
Errors: Type 1 and Type 2
A type 1 error occurs when the null hypothesis is rejected when it is in fact true. A false positive. This is due to the significance level being too high and lenient.
A type 2 error occurs when the null hypothesis is accepted when it is in fact false. This is due to significance level being too stringent.
Sign Test
Sign Test is used to analyse the difference between related items. Generally used for nominal data, it is used to analyse repeated measures data.
Step 1: use a + or - sign to indicate the difference.
Step 2: Add all the pluses and minuses, ignore the columns where there is no difference between the conditions. This is the N value. To calculate the observed value add up the number of times the less frequent sign occurs. This is the sign value, the S value.
Step 3: Work out whether it is a one or two tailed hypothesis.
Step 4: Check the significance level, usually stated but if not assume 0.05. Find the N value and check the S value against the table of critical values, the C value.
In order for the study to be significant, the observed value, S, has to be smaller or equal to the critical, C, value.
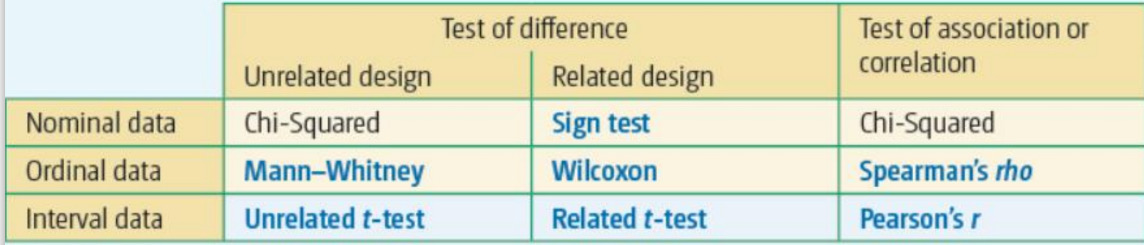
Choosing a Statistical Test
Choosing a Statistical Test
Spearman’s rho
Pearson’s r
Wilcoxon
Mann-Whitney
Related t-test
Unrelated t-test
Chi-Squared test
Sign Test
Inferential statistics is the use of statistical tests to draw conclusions about the populations that the samples came from. To tell whether the results are statistically significant or not, based on the chosen significance level and the probability.
The test is chosen depending on:
Type of Study (difference/correlation)
Type of Experimental Design (unrelated/related (repeated measures))
If the test is correlational then this is not an issue.
Type of Data (nominal/ordinal/interval)
Nominal - named data, can only be one category eg introvert or extrovert. Resulting data is in the form of frequencies, there is no inherent order in the categories.
Ordinal - data that can be ordered, such as rank data. The intervals between the units on the scale are not necessarily equal. Questionnaires and psychological tests tend to use ordinal data.
Interval - data that can be ordered with equal intervals, eg temperature. The data can be compared in terms of magnitude, the equal intervals are based on a standard unit of measurement.
Ratio - a ratio scale has an absolute zero. Eg number of children, inches or centimetres.
Peer Review and The Economy
Peer Review
Peer Review is a system used by scientists to determine whether research findings should be published by scientific journals. Peer reviews act like a filter to reduce the chances of flawed or unscientific research being accepted and potentially supported.
Research papers are independently, and anonymously, scruntinised by scientific experts in the same field as the paper. Several expert reviews assess: the research design and methodology, the methods of data analysis, whether the conclusion is justified, the ethics of the paper and ethics of publication, potential sources of bias, the significance of the research and potential application, plagiarism, and the consequences of it. The reviews report back with suggestions or improvements if appropriate and then either accept or reject the paper.
The Types of Outcomes
Accepted Unconditionally
There are no improvements to be made so the paper is published as is.
Accepted Conditionally
The paper can be published, yet there are small tweaks and improvements to be made.
Rejected Conditionally
Similar to accepted conditionally, however the paper is rejected initially but with major improvements it can be resubmitted for publication.
Rejected Unconditionally
The paper is rejected, there is no chance of resubmission.
Importance
It is a way of checking the validity of the research
Ensures that the credibility of the research is assessed by those most qualified to do so before it becomes part of the public domain
The process ensures that any research paper published in a well-respected journal has integrity and would be taken seriously by fellow researchers and by lay people.
It allows for funding to be allocated.
The Case of Cyril Burt
In the 1950s, Sir Cyril Burt investigated the relationship between intelligence and genes. His original results, published in 1943, showed a strong correlation coefficient of 0.770 in MZ twins who were reared apart. In 1955, he added 6 pairs of twins, reporting a total of 21 sets, with a correlation coefficient of 0.771. In 1966 he reported a total of 53 pairs and a coefficient of 0.771. He argued that since IQ was largely genetic, it was appropriate to test and segregate children into schools appropriate to their abilities.
However, Dr Oliver Gillie, a medical correspondent to the London Sunday Times, set out to find two of Burt’s research assistants yet could not locate either. It is also highly unlikely to have found 53 pairs of identical twins reared apart. Furthermore, with an increased sample it is unlikely and more importantly mathematically impossible the correlation coefficient would remain so similar. Yet the research helped to establish the Eleven-Plus examination used in the UK, but this system is based on completely fabricated bit of research.
Evaluation
Peer review establishes the validity of research based on expert knowledge of other researchers in the same discipline. This prevents falsified work from being accepted helping to maintain the credibility of psychology.
It provides valuable feedback so that researchers can revise and improve their papers before publication.
However, it is time-consuming which places demand on the academic community, meaning it can take a long-time to get work published. This may have negative consequences as useful applications cannot be put into practice until the work has been accepted and published.
Peer review is sometimes accused of protecting established opinions and not being open to genuinely new ideas. Reviews may be subjective in whether the work is credible. Hare found that his work into psychopathy was rejected numerous times because the reviewers didn’t believe the data.
The Economy
Psychology studies have numerous strong implications on the economy.
On average absences from work costed the British Economy £25 billion in 2014, this has likely doubled, with one third of all absences being due to stress, anxiety, and depression. It is likely that mental health costs around £8 billion per year (£16 billion today). However, research into psychopathology can be applied to treatment of mental health illnesses allowing people to return to work and contribute as effective members of society.
Only 29% of mothers work full-time, and only 37.4% work part-time. Society is still oriented around the mother as a primary care-giver. Psychology research into the role of the father supports this. Bowlby suggested that fathers do not have a role in attachment and that they should provide an economic function instead of emotional one. Yet, other research suggests fathers could have the same role as women, this could mean that men have better paternity rights, enabling them to stay at home more and still be paid, and women could earn whilst men stay at home.
Reliability and Validity
Reliability is a measure of consistency. Consistency could be over time, is it possible to obtain the same results on subsequent occasions when the measure is used, or consistency could be across researchers.
Validity: The research achieves what it claims to do. A psychological test must measure what it intends to measure (internal), and the findings should be able to be generalised beyond the specific context of the study.
Reliability
There are two methods to test reliability:
Test-Retest Method
The test or questionnaire is administered again on a second occasion.The results of the two tests should be correlated to check for similarity. The reliability of the measuring instrument is assumed to be correct only when there is a significant positive correlation of +0.8. (It ain’t great unless it’s .8)
There must be enough time in between the occasions so that participants do not simply remember their answers, but not too much time, not too far apart, so that the answers would completely change.
Inter-Rater Reliability (Inter-observer/inter-clinician/etc)
Data on observed behaviours from the same behaviour categories can be reliably collected when there are at least two observers. The results should be correlated to check for reliability. The observers would make independent observations/tallies and then the data is compared to check for similarity. A correlation is calculated to determine the level of inter-rater reliability.
This is most relevant to observations which are open to interpretation in which the interpretations cause subjectivity bias.
Behaviour categories are assigned and tested usually with a pilot study, in order to completely operationalise the study.
Improving Reliability
Questionnaires
Remove questions or rewrite ambiguous or complicated questions if at first the questionnaire produced low correlation using the test-retest method.
Open questions can be replaced with closed questions which are usually less ambiguous, increasing the reliability over time.
Interviews
Less structured interviews have low reliability, therefore structuring the interview asking the exact same questions to each participant, with no leading or ambiguous questions improves reliability.
However, different interviews may still ask questions in different styles, with different accentuation on certain words, so it is best to use the same interviewer whenever possible.
Experiments
Lab experiments with high control typically have high reliability.
However, the conditions which the experiment takes place in, and the instructions given to participants must be exactly the same. Instructions should be standardised and extraneous variables should be controlled as much as possible.
Field experiments always have low reliability.
Observations
Behaviour categories could be misinterpreted, and must cover all possible behaviours. If some categories are missing or the category overlaps and is ambiguous, observers need to make subjective judgments on what to record and where.
Behaviours need to be operationalised and must be measurable along with self evident. For example, pushing instead of aggression, giggling instead of happy.
More than one observer means that inter-observer reliability can be measured.
Validity
External Validity
Population Validity
When the results can be generalised to other groups of people.
Ecological Validity
When the results can be generalised to situations outside the research setting, other aspects of life.
The study’s conclusions reflect settings typical of contemporary, everyday life but the activity may not be the exact activity found in everyday settings. A study will only have high ecological validity if both the internal and external validity are high. It is the extent to which behaviours observed and recorded in a study reflect the behaviours that actually occur in the real world.
Mundane Realism
Do the activities of the study reflect common everyday settings? A study can have high ecological validity, it can reflect natural behaviour, but low mundane realism, non-natural tasks. It is more likely to find high ecological validity when mundane realism is high.
Temporal Validity
When the results can be generalised to other time periods, does it stand the test of time.
Internal Validity
Face Validity
The subjective validity at face value. Does the study actually seem to measure what was intended? An independent expert looks at the measure being used and assesses without any tests whether it will measure what it had set out to measure.
Concurrent Validity
How well does the measure agree with existing measures? By comparing the new procedure with a similar established procedure, validity can be established if the correlation is strong.
Temporal Validity
Do the concepts or results remain true and valid over a period of time? Ideologies and societal conventions change, for example views towards homosexuality, and some psychological concepts reflect these views. A study or theory would have high temporal validity if it does not change with time. For example, the duration of short term memory has not changed over time, it may be improving minutely but it is not as starkly different as views of eugenics.
Improving Validity
Questionnaires
A lie scale within the questionnaire is used along with psychological tests of honesty. These additional questions assess how truthful someone is in their answers to help control social desirability bias.
Anonymity can encourage truthfulness, increasing the validity of the results.
Experiments
To be sure that the independent variable has had an effect on the dependent variable, a control group should be used.
Control of variables through standardisation is need order to reduce investigator effects and demand characteristics, single-blind or double-blind procedures can be used.
Observations
Observations tend to have high ecological validity, especially if they are covert, because the behaviour is natural and authentic.
However, behaviour categories which are broad, ambiguous, or overlap reduce the validity. So, clear, operationalised behaviour categories must be made.
Qualitative Methods
Qualitative methods, such as case studies, usually have high ecological validity because the depth and detail of them allows for more subjectivity reflecting the participant’s reality.
Interpretative validity needs to be demonstrated. This means that evidence, direct quotes, must be used to back an interpretation.
Gathering evidence from multiple sources, the use of triangulation, can strengthen case studies and interviews, as interpretations can be validated.