Statistics in Psychology

A positive correlation will have both variables increasing.
A negative correlation will show one variable increasing while the other variable is decreasing.
On a scatterplot, if there is no correlation, then points will be scattered everywhere, showing no visible line.
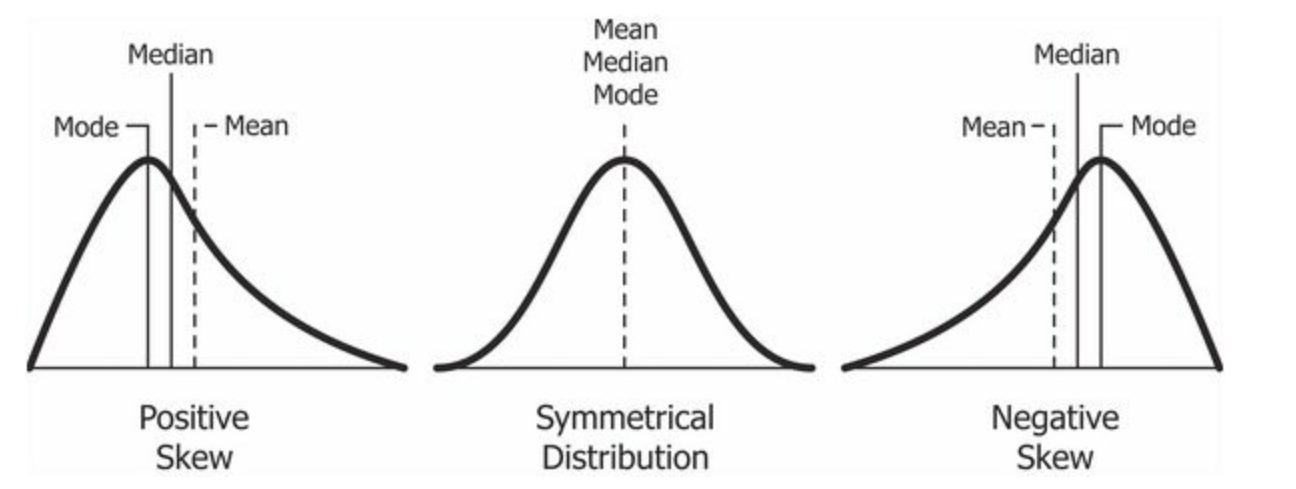
Skews are created by outliers (data points that lie far outside the typical range of a dataset) — can come from errors in data collection
A positive skew means that a group has a high outlier.
The mean is greater than the median, which is greater than the mode.
ex: contains more low scores
A negative skew (left-skewed) means that a group has a low outlier.
The mean is less than the median, which is less than the mode.
ex: contains more high scores
Mean: The average of a data set. Add all the numbers in the data set and divide by the total number of values.
Median: The middle value in a data set when the numbers are arranged in order from least to greatest. If there's an even number of values, the median is the average of the two middle numbers.
Mode: The value that appears most often in a data set.
Bimodal: 2 modes shown
Range: The difference between the largest and smallest values in a data set. It indicates how spread out the data is.
Statistical significance
p-value: if it is less than 0.5 (<0.5), then the results of the experiment was caused by chance
Standard deviation: A way to see how spread out a group of numbers is from the average.
ex: If everyone scores close to the same number, like 7 or 8, the standard deviation is small. That means most kids feel about the same level of happiness.
ex: If some kids score low (like 2 or 3) and others score high (like 9 or 10), the standard deviation is large. That means kids feel very different from each other.