AppEcon
MODULE 1: OVERVIEW OF APPLIED ECONOMICS
ECONOMICS - came from the word “Oikonomia” which means “household management”
- It is the study of mankind in the ordinary business of life
- Social science that involves the use of scarce resources to satisfy unlimited wants
- The study of economics revolves around the concepts of scarcity, needs, and wants
Applied Economics - the application of economic theories and models in real life.
BASIC ECONOMIC CONCEPTS:
- Scarcity - condition where there are insufficient resources to satisfy all needs and wants
- Opportunity Cost - the value of what you lose when choosing between different options
- Comparative Advantage - the ability to produce goods or services at lower opportunity cost
- Absolute Advantage - the capacity to produce more output compared to another entity
BASIC ECONOMIC PROBLEMS
- Human wants are unlimited but resources are scarce
THREE BASIC ECONOMIC QUESTIONS:
- What To Produce - determined by consumer’s preferences
- How To Produce - determined by producers seeking profit
- For Whom To Produce - determined by consumer’s purchasing power
Economic Goods - goods and services that are used extensively in economic discussions
FACTORS OF PRODUCTION
- Land - soil and natural resources
- Labor - physical and human effort
- Capital - man made resources
- (in book) Entrepreneurship
- Entrepreneurship - also known as “enterprise”
- Represents factor that decides how much and in what way factors are to be used
- Entrepreneur - individual who start a new business
- Circular Flow Diagram - an economic model that illustrates the flow of factors of production in the economy.
- Production Possibility Frontier - is an application of the concept of allocation of resources and factors of production
- Rent - payment from LAND
- Salary - payment from LABOR
- Interest - payment from CAPITAL
- Profit - payment from ENTREPRENEURSHIP
METHODS USED IN ECONOMIC ANALYSIS
- Qualitative Approach - focuses on directional relationship of different economic variables
- Quantitative Approach - involves mathematical and statistical analysis of economic data
Economic Variables - are important in explaining and understanding economic theories or models.
Variables - are used to signify elements in an economic model
Functions - explains the relationship between two or more variables
Economic Equation - is a mathematical expression of an economic thought or concept
Graph - provides a visual representation of the relationship between two or more economic variables.
Economic Theories - these are statements on the relationship of variables
- It provides a broader understanding of economic concepts
- Marginal Utility Theory - states that people buy goods that give the highest personal satisfaction
Economic Models - are the representations of economic and social phenomena analyzed using research, observation, and testing
- Ceteris Paribus Assumption - it has a latin term that literally translates to “all else being the same”
- Time Series - the data are collected for particular elements for several time periods
- Cross Sectional - data includes different variables for a single time period
Normative Economics - evaluates economic decisions, policies, or outcomes as good or bad.
- subjective opinions
Positive Economics - evaluates economic scenarios and policies based on qualitative and quantitative analysis
- factual and objective
BRANCHES OF ECONOMICS
- Microeconomics - a branch of economics that examines the individual or company level.
- Pertains to individual units of the economy
- Macroeconomics - studies behavior of whole economy
- Studies aggregate or country level
- Deals with economy as a whole
MICROECONOMIC CONCEPTS:
- Utility - the value or satisfaction derived from consumption of goods and services
- Marginal Utility - is the additional utility or satisfaction from consumption of additional goods or services, keeping other things constant
Law of Diminishing Marginal Utility - marginal utility of goods and services decreases as quantity increases, ceteris paribus
Indifference Curve - a chart showing combination of two goods in various quantities
Indifference Map - a graphical representation of two or more indifference curves
Budget Line - set of combinations of two goods that can be purchased within a given income and prices
Equilibrium Position - where indifference curve and budget line intersect
Disposable Income - the income after taxes
Discretionary Income - the income left from disposable income after all other necessary expenses have been deducted
MACROECONOMIC CONCEPTS
GDP - “gross domestic product” the estimated market value of all goods and services produced in a particular country
GNP - “gross national product” the value of all products and services produced by a country’s citizen
COMPONENTS OF GDP:
- Personal consumption expenditures - goods can be durable
- Services include banking, health care, education
- Business Investment - fixed investment and change in private inventory
- Government spending
- Net export of goods and services
![]()
- Output Approach - it looks at the output and evaluates what goods and services are factored in.
- Expenditure Approach - it considers the value or expenditure associated with the purchase of goods and services
MODULE 2: THE PHILIPPINE ECONOMY AND ITS 21ST CENTURY SOCIO ECONOMIC CHALLENGES
ECONOMIC SYSTEMS - the different ways of managing a nation’s available resources to answer the three economic questions:
- What To Produce
- How To Produce
- For Whom To Produce
- Free Market Economy - system characterized by competition and high level of private ownership
- Prices are set by market mechanisms
- Resources are allocated freely
- Individual and entities have economic freedom
- Nations with FME: New Zealand, Singapore, Australia
- Laissez Faire System : an examples of a free market economy
- Centralized Economy - also known as “command economy”
- Characterized by heavy involvement of the government
- The government plans, directs, and decides how resources will be allocated
- Mixed Economy - an economic system that combines the features of free market and centralized market systems
- Most industrialized countries have this type of economic system: United States, France, and other European Countries
- Traditional Economy - is characterized by customs and habits.
- Barter is a mechanism where goods are exchanged for another goof
- Currently limited to some nations in Africa
MACROECONOMIC GOALS OF A COUNTRY
Economic Growth - is typically measured through GDP
- Business Cycle is characterized by the upward and downward trend of GDP observed over a period of time
- It is a cycle of fluctuations in the GDP around its long term natural rate.
- It explains the expansion and contraction in economic activity that an economy experiences over time.
- It is completed when it goes through a single boom and a single contraction in sequence
- Recession - a period of economic downturn characterized by high or increased unemployment, slow business, and a decline in consumer purchases
- Expansion - features low or decreased unemployment, and a rise in consumer spending driven by higher income
- Depression - a prolonged period of recession
Full Employment - the upward and downward movements in the business cycle that leads to unemployment
- The unemployment, as a result of the business cycle is called cyclical unemployment
Price Stability - is the stable level of prices in the economy, which avoids long periods of inflation or deflation and sustains the value of money over time
- It denotes that the consumer spending is not affected by inflation because consumers do not worry that the value of money will change anytime soon
- It is important to separate the increase in the prices of individual goods or services from the increase in the general price level
THE STATE OF THE PHILIPPINE ECONOMY
- Economic Performance - the philippine economy has been experiencing growth since 1999
- Outlook for the Philippine Economy - this remains positive
THE PHILIPPINES’ 21ST CENTURY SOCIOECONOMIC CHALLENGES
Global Challenges - the continuous integration of economies across the world means that the Philippines is vulnerable to major international issues.
- War and Terrorism
- Political Instability in Europe
Domestic Issues - in addition to international issues, the Philippines has to deal with internal socioeconomic challenges as well.
- Territorial Dispute with China - an on going maritime dispute over the West Philippine Sea, which started in 2012
- Achieving Ceasefire in Mindanao - the attempt of the Philippines to end the long-time standoff with the rebels in the southern portion of the country
MODULE 3: THE LAW OF DEMAND AND SUPPLY AND THE MARKET EQUILIBRIUM
Commodity - pertains to a homogenous good that commands a price
THE MARKET:
- Consumer Market - most visible to consumers as we partake in these activities
- Producer Market - enable raw material and intermediate product producers to sell their products to final product producers to final product producers who are now the market buyers
- Resource Market -enables resource owners to sell the basic services of labor, land, and capital to producers of goods and services
- Resource Constraint - compels firms, governments, and household consumers to find the best trade off with the least opportunity cost.
DEMAND
- Demand - amount of goods and services consumers are willing to purchase given a certain price
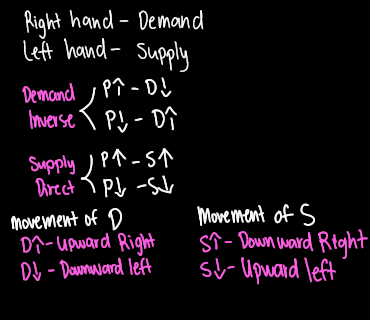
- Law of Demand - "with all other factors being constant or equal, the price and quantity demand of any product or service will be inversely related to each other. In other words, with increasing price, the quantity demanded will decrease and vice versa"
- "as price increases, demand decreases"
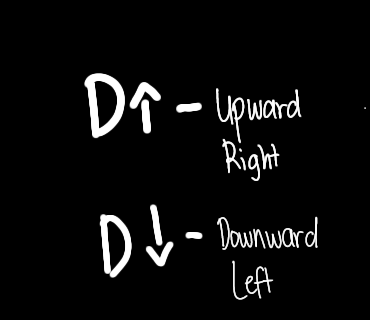
- Demand Curve - (graph) a graphical representation of the relationship between the price of a certain commodity and the quantity demanded.
- price is shown on the left axis while quantity demanded is shown on right axis
- "Demand Schedule"- a table of price and quantity values
- Demand Curve Slope - result of such inverse relationship between price and quantity demanded
- slope of demand curve is downward highlighting inverse relationship between price and quantity demanded
- Slope = p2-p1 / q2 - q1
- Price Elasticity Of Demand - a measurement of change in the consumption of a product in relation to a change in its price
- economists use price elasticity to understand how supply and demand for a product change when it's price changes
- Ed = (q2 - q1 / (q1 + q2 / 2)) / (p2-p1/ (p1+p2 / 2))
The slope is always (-)
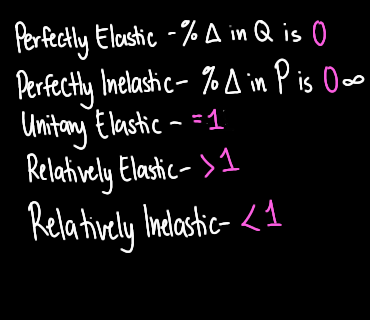
- Perfectly Elastic - undefined
- if % change in Q is = to 0
- Perfectly Inelastic - if % change in P is = to 0
- Unitary Elastic - if it's equal to 1
- Relatively Elastic - more than 1
- Relatively Inelastic - less than 1
- Shift of Demand Curve - quantity demanded is dictated by a change in price.
- There are cases when the demand curve shifts either to the right or to the left.
- Demand shift indicates an entirely different demand schedule
DETERMINANTS / FACTORS OF DEMAND CURVE SHIFT
- Income
- Substitute Goods - goods that meet the same requirements or fulfill the same needs as another good
- Complementary Goods - are generally consumed or used together.
- Consumer Expectations
- Tastes and Preferences
SUPPLY
- Refers to the willingness of the sellers to produce and sell a good at various possible prices
- Law of Supply - all other factors being equal, as the price of a good or service increases, the quantity of goods or services that suppliers offer increase, and vice versa (ceteris paribus)
- as price goes up, quantity goes up
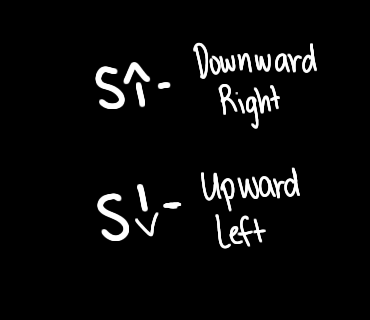
Supply Curve - a graphic representation of the correlation between the cost of a good or service and the quantity supplied for a given period
- The price will appear on the left vertical axis, while the quantity supplied will appear on the horizontal axis
- Supply Curve Slope - a supply curve slopes upward to the right (a positive slope), indicating that the greater the price buyers are willing to pay for the product, the greater the quantity firms will supply.
- The producer lowers the price until the quantity demanded equals the quantity he has to supply
Slope of supply is always positive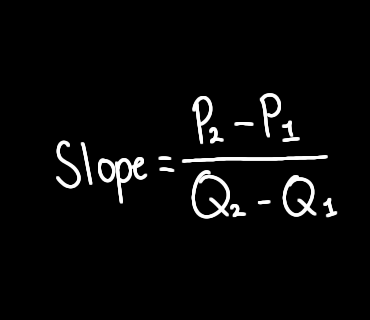
PRICE ELASTICITY OF SUPPLY (PES or Es) - A measure used in economics to show the responsiveness, or elasticity, of the quantity supplied of a good or service to a change in its price.
- The elasticity is represented in numerical form
- % change in the Qs / % change in P
- Shift of Supply Curve - when price of the commodity remains constant, but there is a change in supply due to some other factors, causing the curve to shift to a particular side
FACTORS THAT CAUSES THE SUPPLY CURVE SHIFT
- Number of Sellers - as quantity sellers/ producers increase, the overall supply increases
- Price Resources - as prices for raw materials increase, the production cost of the firm also increases, causing the supply to decrease
- Taxes and Subsidies - taxes and subsidies incentives firms to either produce more or less of the good
- Technology - has a major impact of efficiency of production and cost of production
- Expectations - producers are incentivized to produce more products that are demanded by consumers. This cause quantity produced to increase or decrease
- Related Products - complementary and substitute goods have direct correlations with the quantity supplied to producers
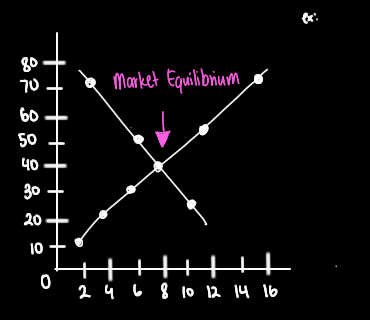
Market Equilibrium is an economic state when the demand and supply curves intersect and suppliers produce the exact amount of goods and services consumers are willing and able to consume
- Where lines intersect
SURPLUS, SHORTAGE, AND GOVERNMENT INTERVENTIONS
- In a competitive market, a surplus or a shortage may occur when there are movements or changes within the supply and demand schedule
- Surplus - may be experienced when price of good is above equilibrium price and when government sets a price floor above equilibrium price
- Price Floor - lowest price above market equilibrium
- Price Ceiling - highest price below market equilibrium
- Surplus - supply is greater than demand
- Shortage - occurs when the quantity demanded exceeds the quantity supplied
- This happens when the price is below the equilibrium level
- May also be experienced if government sets a price ceiling below the equilibrium price
MODULE 4: APPLICATION OF SUPPLY AND DEMAND
TERMS TO REMEMBER:
- Disposable income - the net amount after taxes and mandatory contributions have been deducted
- Normal Goods - as consumer’s income rises, quantity demanded for goods also increases
- Inferior Goods - as income rises, quantity demanded decreases
- Luxury Goods - an increase in demand more than the proportionate increase in income
- Necessity Goods - shows an increase in demand that is less than proportionate in income
- Veblen Good - to increase in demand when its price soars to the point of being extremely overpriced
Market Structure - refers to the competitive environment in which buyers and sellers operate
Competition - the rivalry among the sellers in the market
Market - a situation of diffused, impersonal competition among sellers who compete to sell their goods and among buyers who use their purchasing power to acquire the available goods in the market.
- A place or point at which buyers and sellers negotiate their exchange of well-defined products or services
The Varying Degrees of Competition in The Market Depending on The Following Factors:
- Number and size of buyers and sellers
- Similarity or type of products bought and sold
- Degree of mobility of resources
- Entry and exit of firms and input owners
- Degree of knowledge of economic agents regarding prices, costs, demand, and supply conditions
COMPETITION AND MARKET STRUCTURES
Perfect Competition:
- Pure Competition - a market structure where there are many buyers and sellers. None of them can cause changes in prices and quantities of goods and services. E where there are “Price Takers”.
- Usual Problems: how to survive and how to get fair market share
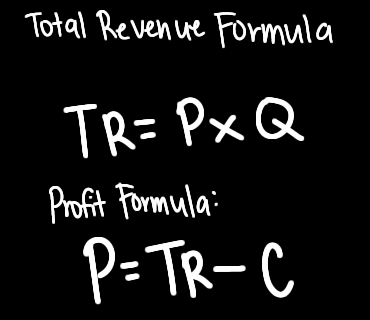
- TR = PRICE x QUANTITY and TC = TOTAL FIXED COST + TOTAL VARIABLE COST
- TR should be greater than TC (total cost)
Imperfect Competition:
- Monopoly - a market structure where there is only one seller that represents the whole industry. “Price Maker”
- Usual problem: Improvement of products and services
- Monopolist lacks the foresight to become efficient due to absence of competition
- Oligopoly - a market structure where there are few sellers
- Competitors in this structure collude and are called “players”
- Duopoly: there are two sellers. It is best if they work together rather than compete with each other
- Usual Problem: the existence of barriers to entry wherein the competitor finds it hard to enter the industry because of the initial capital requirement
- Monopolistic Competition - a market structure that consists of different products with many sellers
- Usual Problem: how to be unique and different from its competitors
Applications of Demand and Supply to The Philippine Labor Market
- Labor Supply - is comprised of the available labor force who are willing and able to work, and awaiting deployment.
- Labor Demand - refers to the industry’s total available job vacancies from the previous cycle or year up to the present
- Wages - are payments made in exchange for the time and effort exerted or given by an individual who was able to either produce a good or a service
- Total Output - refers to the number of workers multiplied by their corresponding individual yield
The Philippine Peso and The Foreign Exchange
- Foreign Exchange - is the conversion of Philippine currency into and international currency, such as the American dollar.
- A stronger dollar mean either international currency’s economy is getting stronger and local currency’s economy is getting weaker
- A weaker dollar means either the local currency is getting stronger and international currency is getting weaker
- Dollar supply comes from dollar holders (OFWs)
- If the dollar is in demand in a country like the Philippines, then its value will appreciate against the peso and dollar. Holders will see this as a signal to pour in the currency to take advantage of the high exchange rate and withdraw the same if the exchange rate is low
Rent and Price Structure - quantity demanded of real estate rises as prices fall, ceteris paribus