MEA 250 Notes
1.1 Introduction
- Coasts has a length of 440,000 km;
- Coastal zones account for 0.05% of the earth’s landmass;
- Half of the earth’s population lives within 100 miles of the coast
The Coast: Beaches and Shoreline Processes
- Coastal region constantly changes
- Primarily due to waves
- Erosion
- Deposition
- Man people live in coastal regions
- 80% people in U.S. live within easy access of coast
1.2 Coastal Settings
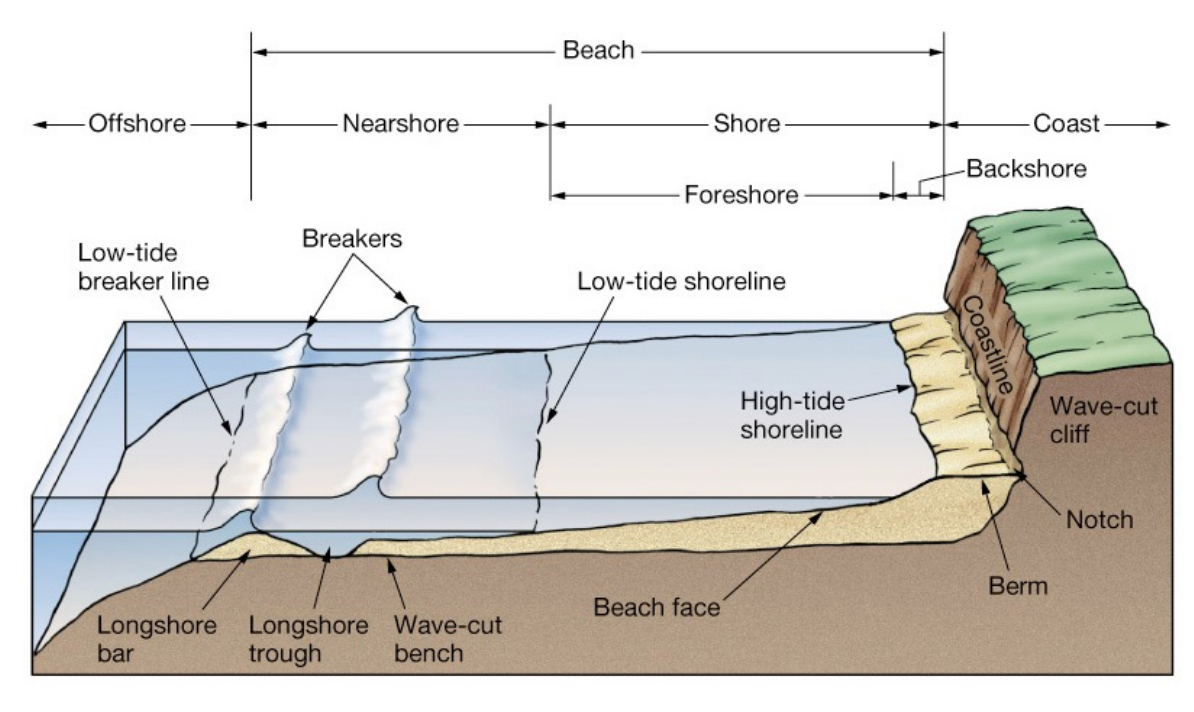
Berm/backshore- area from coastline to high-tide shoreline
Foreshore + Berm + backshore= shore
Nearshore + shore= beach
- Erosional and Depositional Coasts
- Sea caves, sea arches and sea stacks, etc
- Deltas, barrier island systems etc
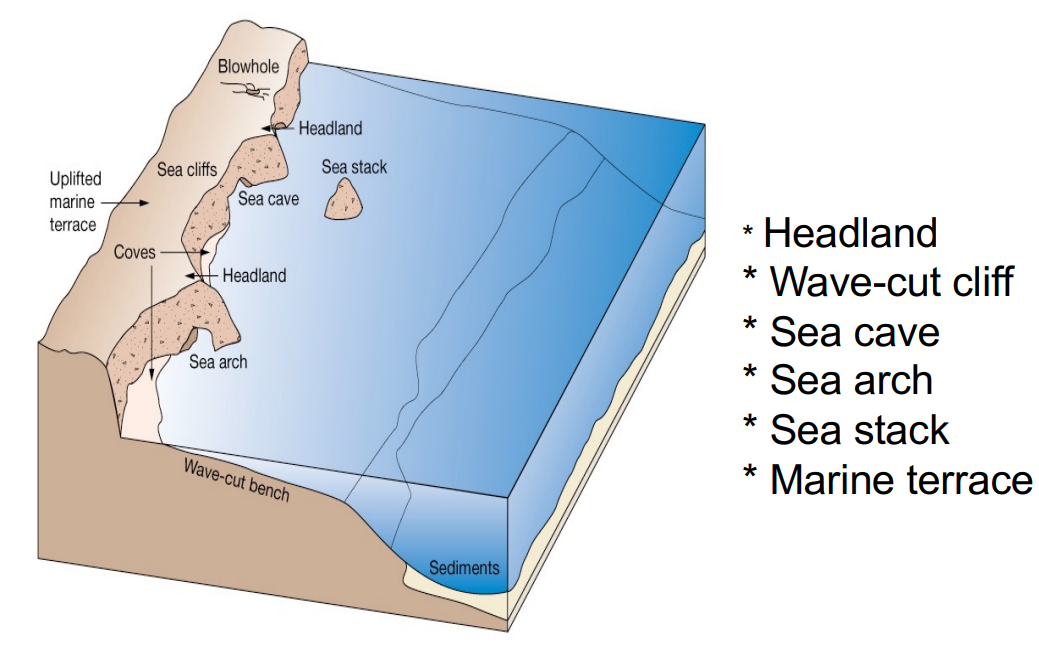
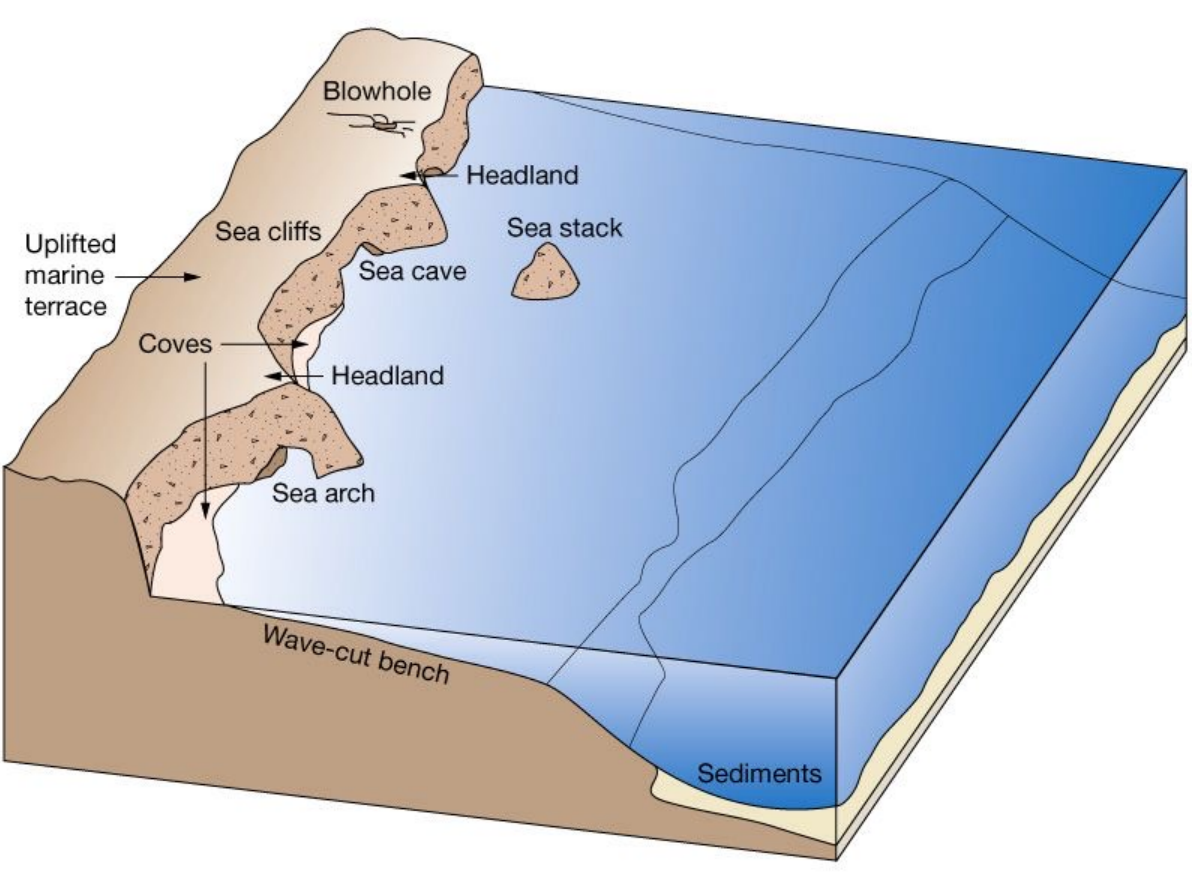
Erosional Shoreline
- Well-developed cliffs
- Recent tectonic activity
- Headlands
- Wave-cut cliff with sea cave
- Sea arches and sea stacks
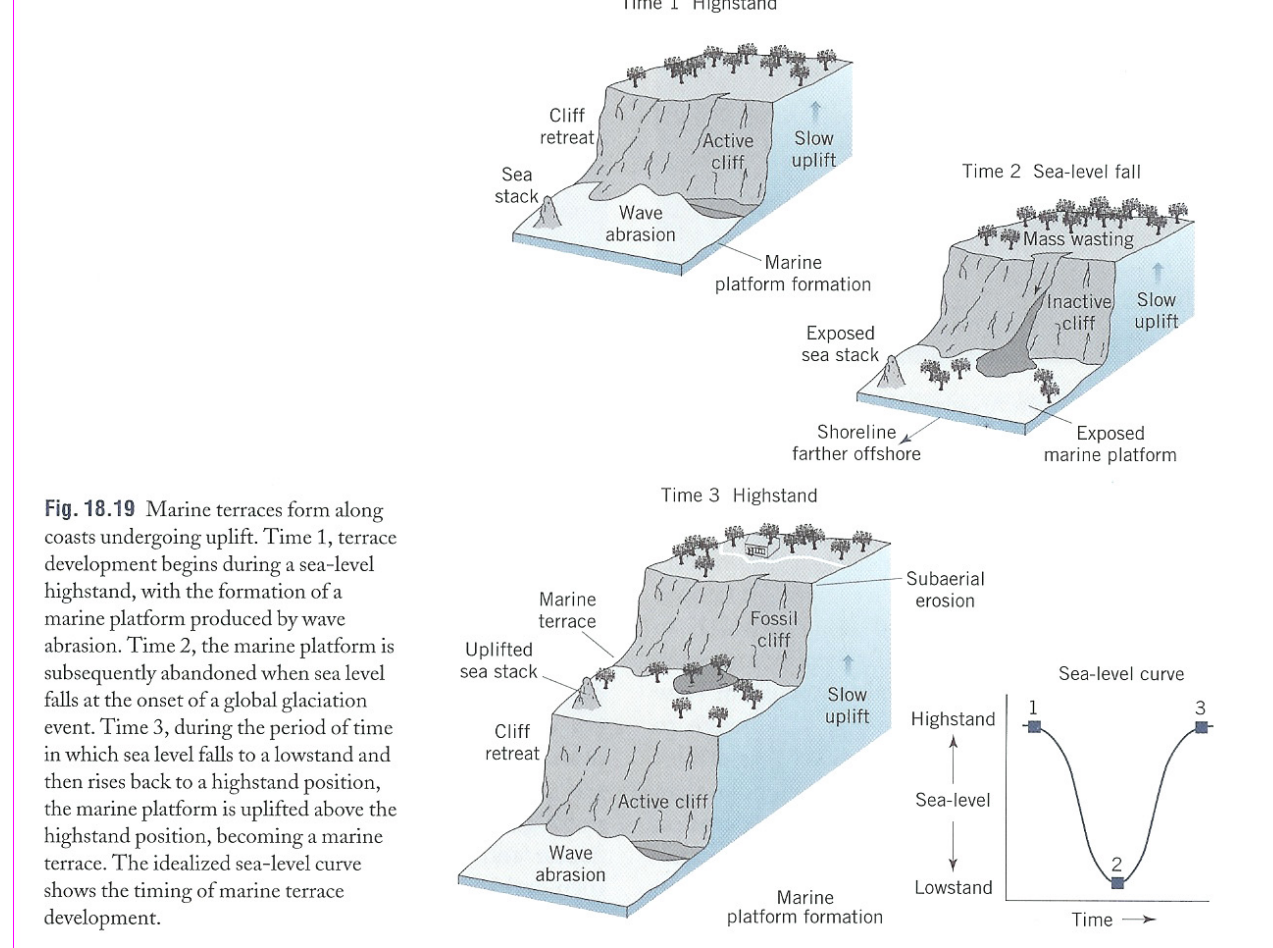
- Marine terrace
- The wave cut bench that gets uplifted
- The marine terrace is above sea level
- Wave erosion increases with:
- More shore exposed to open ocean
- Smaller tidal range
- The wave energy is more focused on a narrow strip of cliff rather than distributed across a large area
- Weaker bedrock
- Features of Erosion Coast
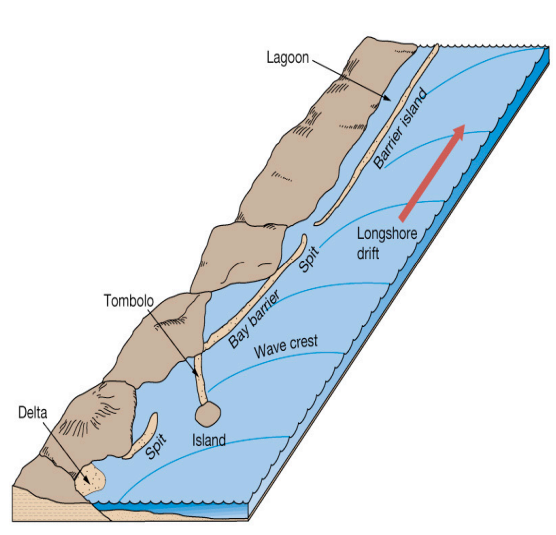
Depositional Shorelines
- Primarily deposited by longshore drift
- Beach
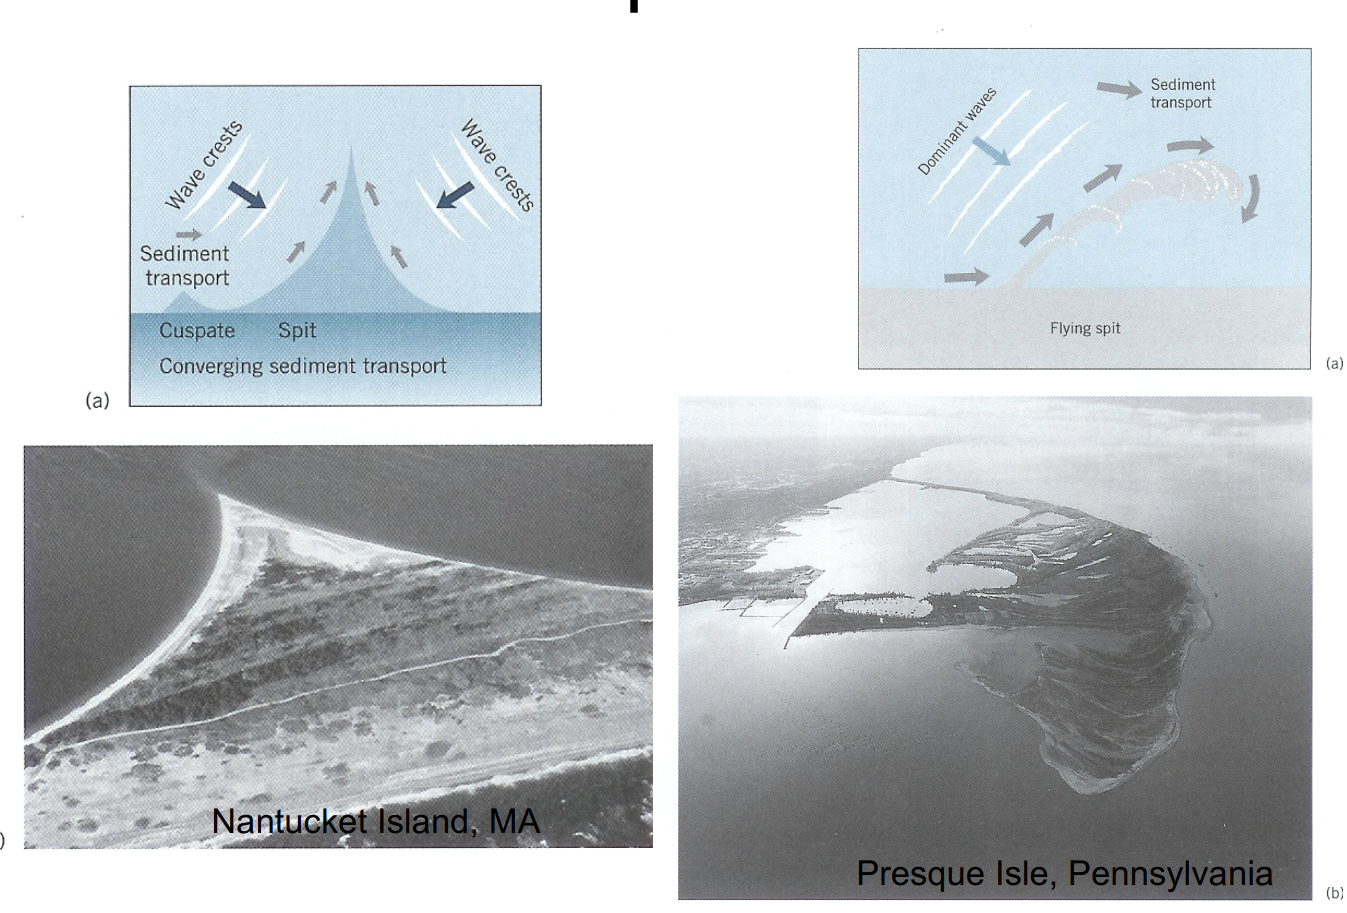
- Spit
- Ridge of sand pointing in the direction of the longshore drift.
- Bay barrier
- Sand extending from mainland
- Barrier island
- Like Outer Banks
- Delta
- Outwash from a river or stream
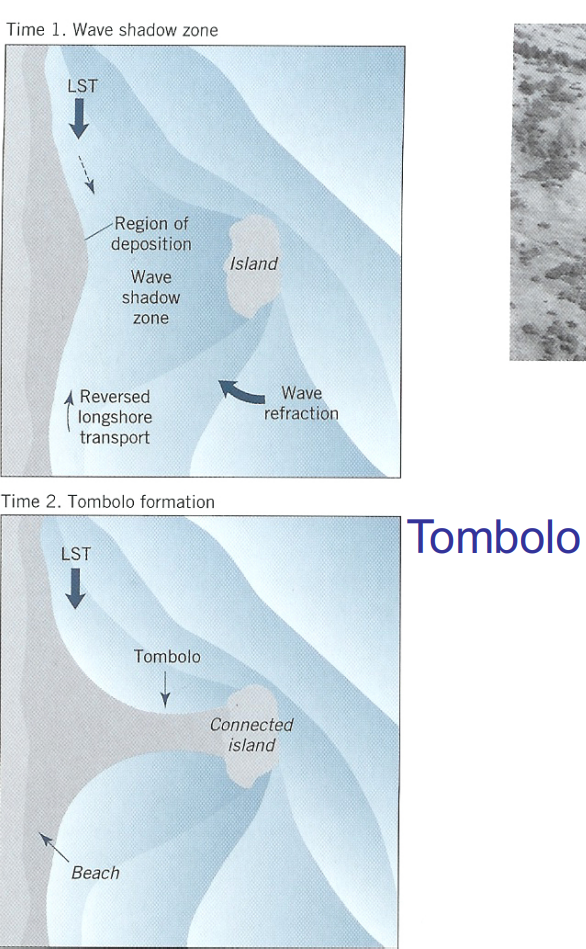
- Tombolo
- Connects island to island or island to mainland, perpendicular to incoming waves
Barrier Islands
- Long, narrow offshore deposits parallel to shore
- Most developed due to rise of sea level about 18,000 years ago
- Common East and Gulf coasts of U.S• Protect mainland from high wave activity
Characteristics of US Coast
- The Pacific Coast - An active continental margin where recent tectonic activity has caused many areas to be uplifted. The Pacific Coast is mostly a primary coast.
- It is characterized by steep, rugged shorelines and a narrow continental shelf.
- The Atlantic Coast - Because the Atlantic Coast is a passive continental margin on the trailing edge of the North American plate, it has been either stable or slowly subsiding for a long period of time. The Atlantic Coast is mostly a secondary coast, having been highly altered by waves and currents.
- It is characterized by gently sloping shorelines and a wide continental shelf.
- The Gulf Coast - In a tectonic setting similar to the Atlantic Coast. However smaller wave size and a smaller tidal range mean that oceanic processes have less effect than the other coasts. The dominant coastal feature here is the Mississippi River Delta.
- The Pacific Coast - An active continental margin where recent tectonic activity has caused many areas to be uplifted. The Pacific Coast is mostly a primary coast.
Human Interference in Coastal Processes
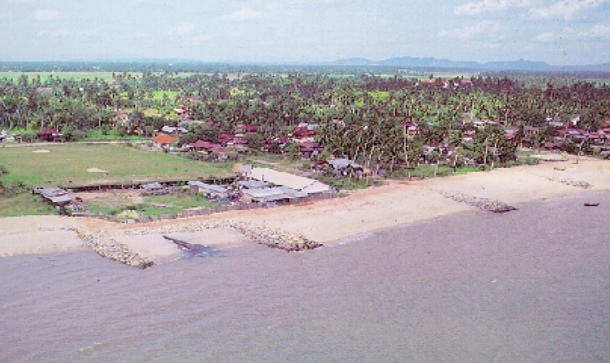
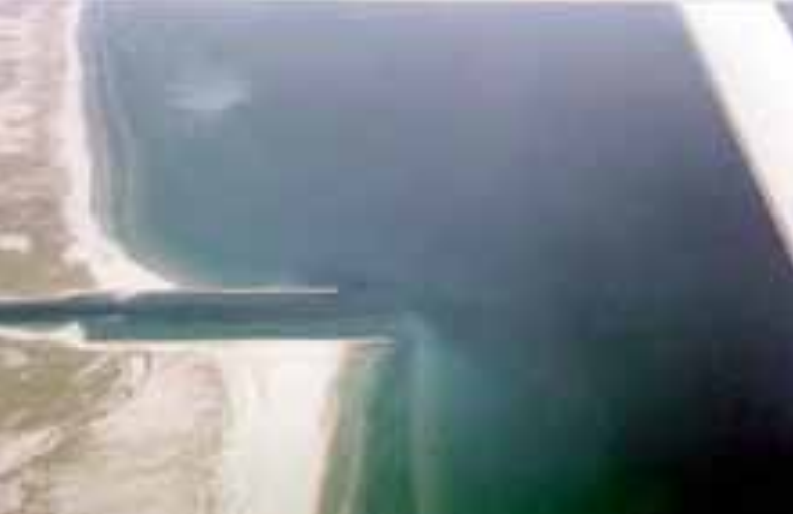
- Groins are short extensions of rock or other material placed at right angles to the beach. Their intent is to trap sand moving along the beach by longshore drift. But they usually make erosion worse on the down-drift side of the groin.
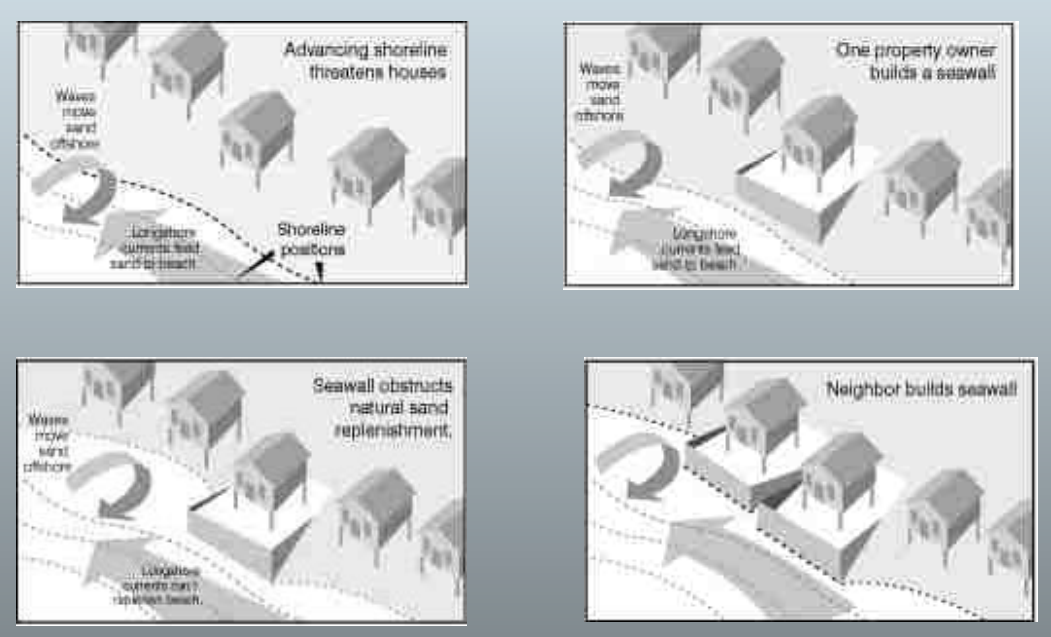
- Seawalls are built to protect coastal cliffs and bluffs from eroding, but their flat faces reflect wave energy back onto the beach, eroding the beach. The beach forms a natural barrier to waves, so as the beach gets smaller, wave erosion worsens.
- Importing sand (adding sand to the beach from elsewhere) is commonly done to restore eroded beaches. This expensive procedure usually involves dredging sand from offshore and putting it on the beach. But this offshore sand is often finer (made up of smaller particles), so it erodes away within a short period of time.
1.3 Coastal History
- A. Ancient civilizations located on the coast (Athens, Rome, Alexandria)
- 1. Transportation (protected harbor usually)
- 2. Food source
- B. Exceptions to civilizations on the coast (Incan, Mayan, and Chinese): Not great sailors
- C. Military perspective: If you control the coast – you control the country
- D. Early U.S. settlement commonly on coast, river, or large lake (transportation)E. 20th Century revolution for coasts: recreational equipment and air-conditioning increased coastal usage: continuing into 21st century.
- F. US population changes (1960-1990): huge increases on Atlantic + Pacific seaboards
- G. By 2010 US coastal environments will occupy 10% of the total land area, but account for nearly 50% of the US population
- 1. Density at the coast = 400 persons per square mile
- 2. Density of non-coastal areas = 100 persons per square mile
1.5 Coastal Research
- Countries like the Netherlands – coastal research was a way of life
- Late 1800’s research began on coasts: origin of barrier islands and coral reefs• During 20th century first systematic study of coastal processes (including engineering studies)
- World War II brought need for understanding coasts: Normandy + Pacific Islands• Korean War required knowledge of mudflats; MacArther landed troops on W. Korean mudflat
- Out of these needs grew the Army Corps of Engineers (supported university like Scripps)
- After World War II Office of Naval Research was created and it supported coastal research
- 1. Started in the 1960’s and 1970’s: used process/response approach (scientific method)
- Created Coastal Studies Institute of LSU
- Research approach is only 30-40 years old
- The National Science Foundation now also supports extensive coastal research
I. Contrast East Coast of U.S. (passive margin – no tectonics) with the West Coast of U.S. (active margin – subduction and tectonic activity)
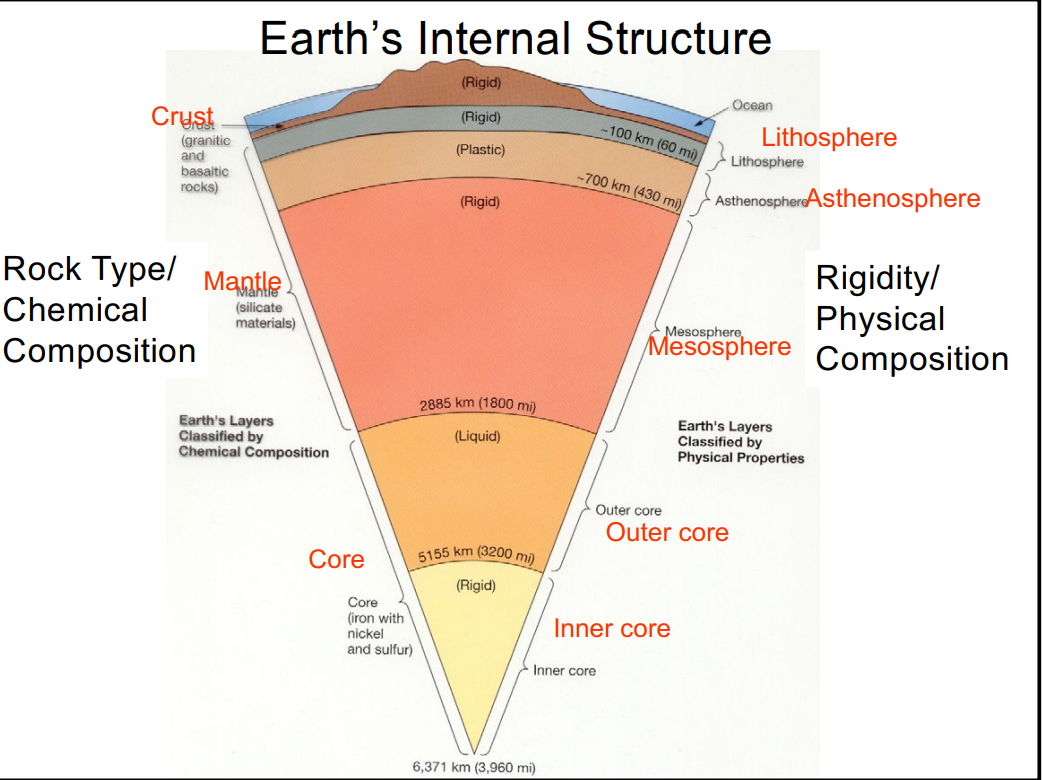
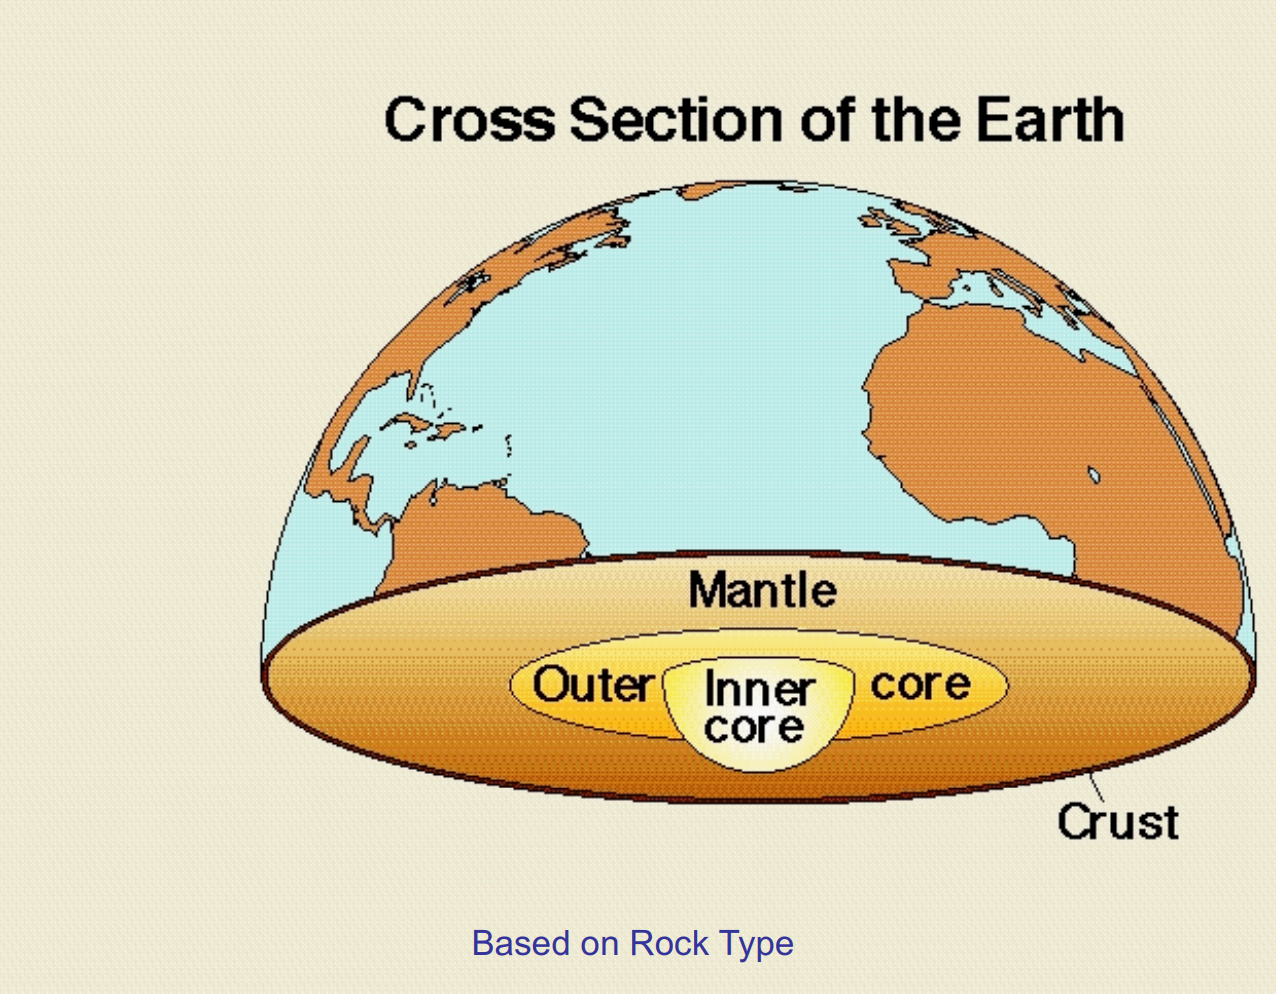
- *Lithosphere
- Thicker than crust. Includes crust and upper portion of mantle
- Described as rigid
- *Asthenosphere
- Between lithosphere and mantle
- Described as plastic (can be depressed or molded)
- Mesosphere
- Described as rigid
- Mantle
- Includes lithosphere, asthenosphere, and mesosphere
- 70% of earth’s volume
- Upper mantle rigid, lower
- Less dense
- Rich in Mg-Fe silicates
- 1-3K oC
- 2866 km thick
- Outer Core
- Fluid behavior
- 3K oC
- Rich in Fe, Ni
- Rotates faster than inner core
- 2258 km thick
- Inner core
- Rigid
- Rich in Fe, Ni
- Very dense (5x granite), pressure
- Very hot (4-5K oC)
- Magnetized
- 1222 km radius
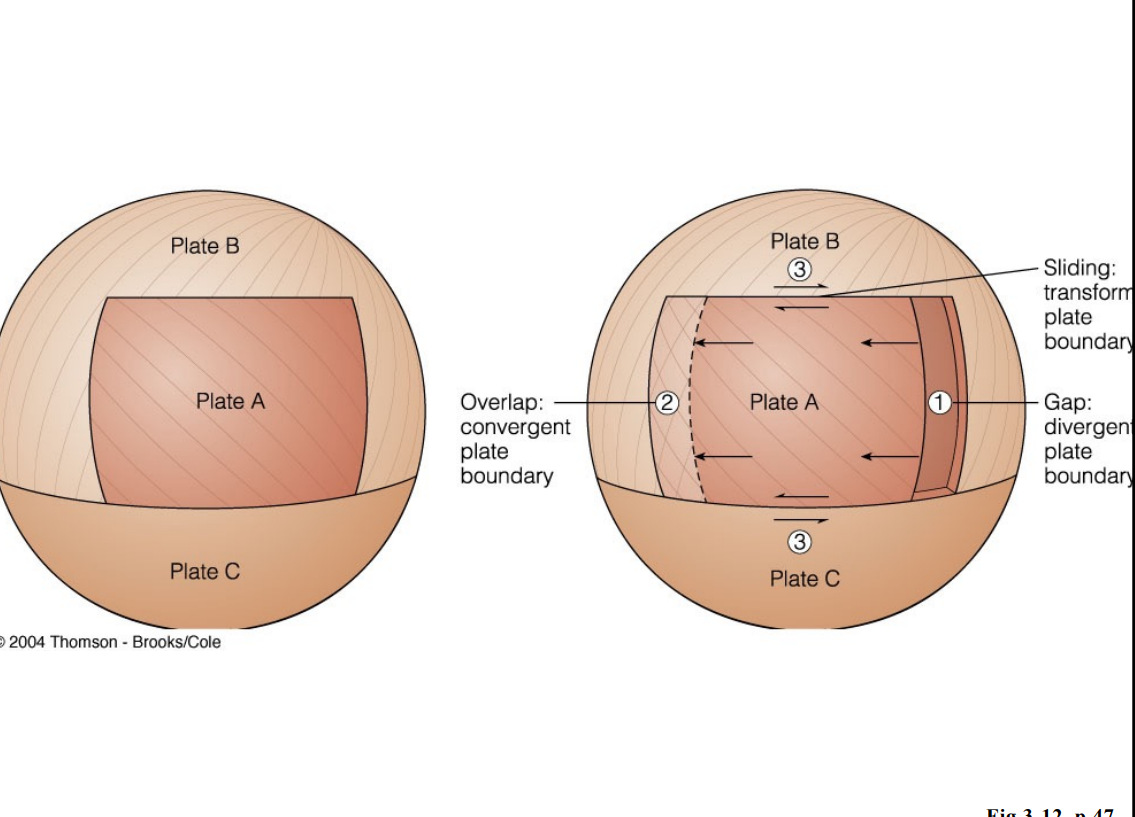
- The tectonic system is powered by heat. Some parts of the mantle are warmer than others, and convection currents from warm mantle materials rise and cool materials fall. Above the mantle floats the cool, rigid lithosphere, which is fragmented into plates. Large convection (partially melted asthenosphere) drag the plates away from one another, toward the other, or past another.
Divergent, convergent, and transform plate boundaries
- *Mid-Atlantic ridge- divergent plate boundary
- Pacific plate converges with the Eurasian plate
- Most earthquakes occur near subduction zones at convergent boundaries
- Ring of fire
- Area of pacific ocean where many large earthquakes occur
- Seafloor spreading
- New seafloor is created at ridges where plates diverge
- Oldest ocean floor is farthest from ridges
- Passive margin vs active margin
- Passive margin- no subduction or convergent plate boundary
- Active margin- area where two plates meet and subduction occurs, creating a trench, lots of seismic activity
History of continental drift
- At one point pangea was one large continent where all of the continents fit together
- Supported by fossil evidence and the sea floor spreading
- Newest ocean floor created at mid-ocean ridges
- When ruptures occur at convergent boundaries/subduction zones the older continental crust ruptures while the younger oceanic crust does not. This causes strong earthquakes on the land side of the subduction zones.
Chapter 3- Material Flux to Coast
Weathering Processes:
- Basin Size
- Elevation
- Rainfall
- Rock type
- Vegetation
Transport of Material to the Oceans
- Streams (89%): Naturally about 50/50 for dissolved and particulate, but human activity has increased the particulate flux.
- Ice (7%): Ground up rock debris carried by melting glacial streams and icebergs.
- Groundwater (2%): Very hard to quantify- this number is only a guess.
- Shore Erosion (1%): Erosion of coast lines from waves, tides, and storms.
- Volcanic Eruptions (0.3%): Can be locally important (e.g. Mt. St. Helens), but too infrequent to be a large flux.
- Dust (0.2%): Winds of dry areas transport dust to the ocean (which can be an important source of Fe to biota).
Water Discharge
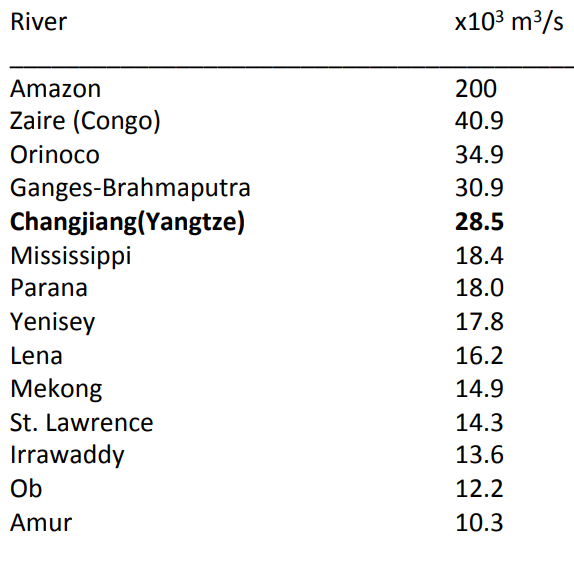
Drainage Area
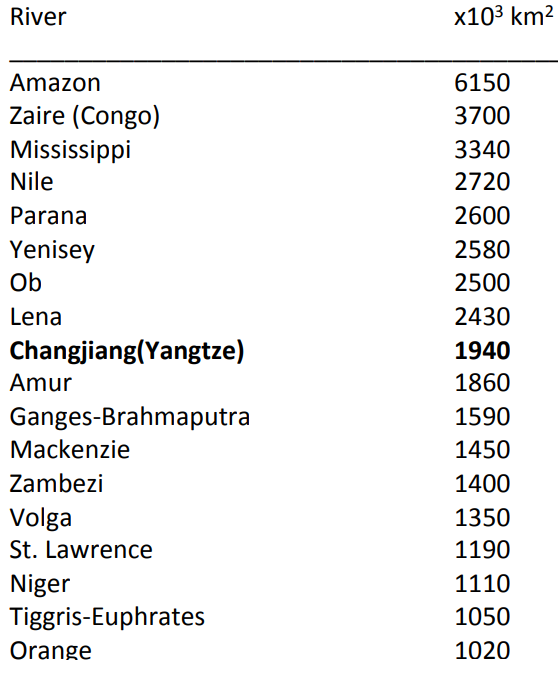
- To calculate the
Average Annual Suspended Load
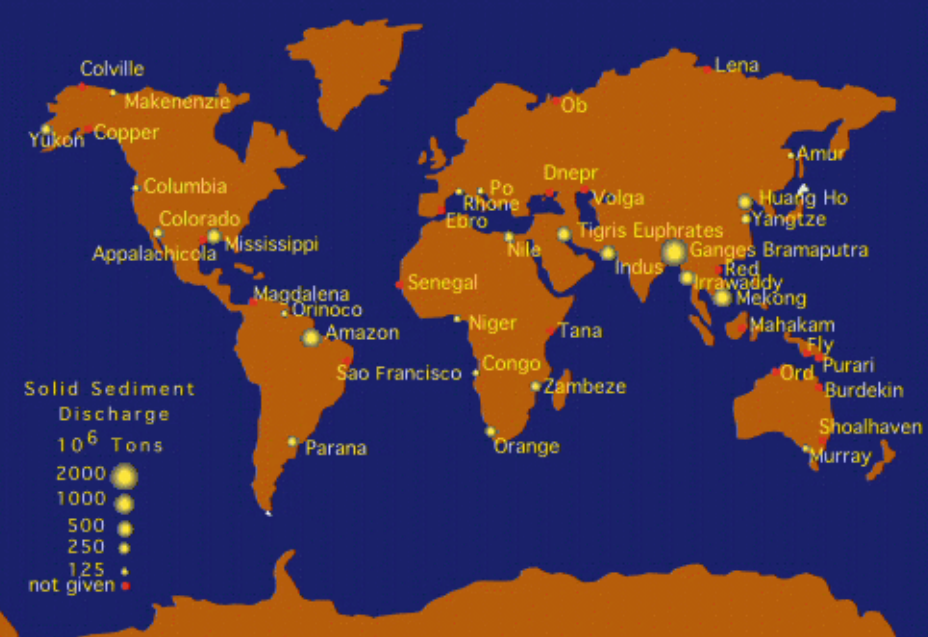
Discharge of Sediment to the Coastal Ocean
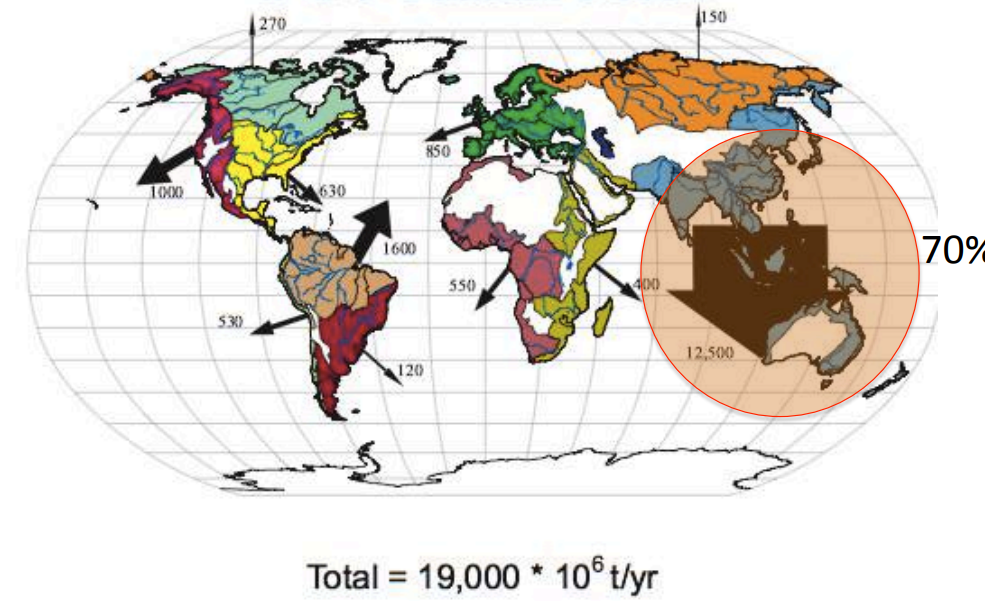
South and East Asia contribute ~70% of sediment to the ocean
The main reason is weather and tectonic activity and human activity
- Flux
- Delta (River←→Ocean)
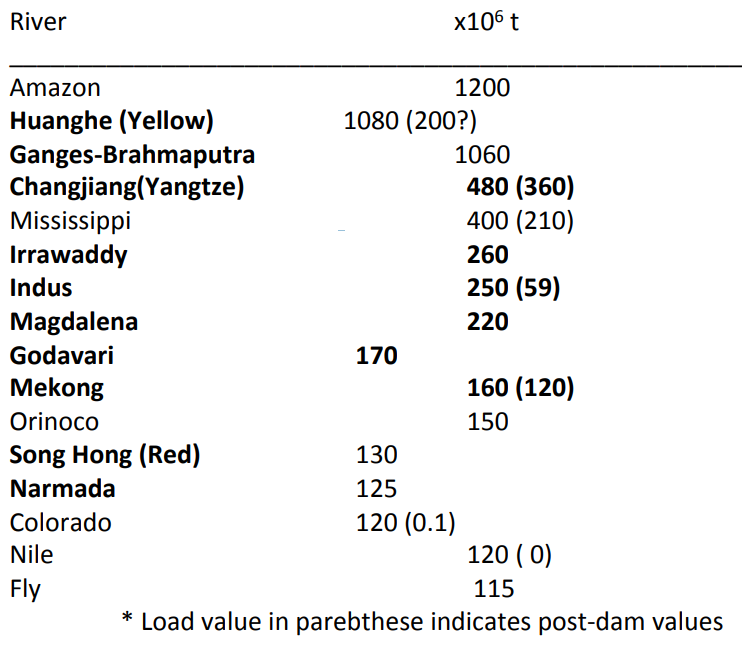
Sediment Load:
- The solid material that is transported by a natural agent, especially a stream
- Or
- Mass of sediment passing through a stream cross section in a specified period of time, expressed in millions of tons (mt). 100Mt/year
Sediment Yield:
- Sediment load per unit of drainage area
- Total quantity of sediment, expressed in units of mass (or volume) per unit of time.
- Or
- Total sediment discharge from a watershed relative to the watershed area, expressed in units of mass per unit time per unit area.
- *To calculate the sediment yield, take the total sediment load divided by the total area
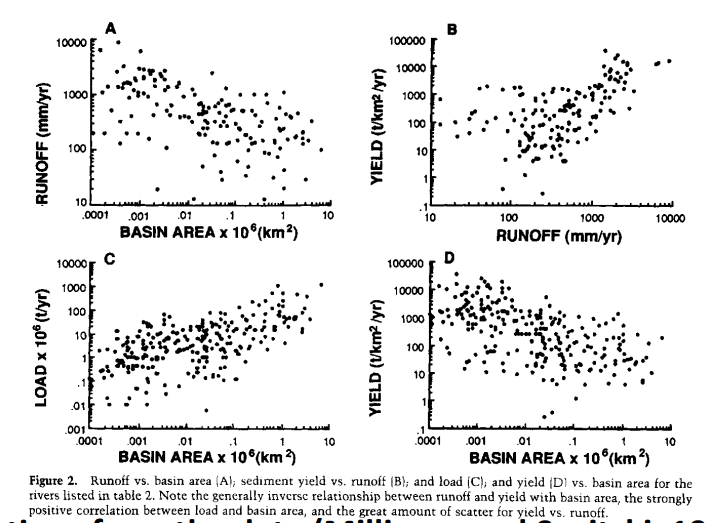
- Generalizations from the data:
- Increased basin area, correlates with lower runoff/rainfall.
- The higher the rainfall/runoff, the greater the sediment yield
- The larger the basin area, the greater the sediment load (g/yr).
- The larger the basin area, the lower the sediment yield (g/cm2/yr).
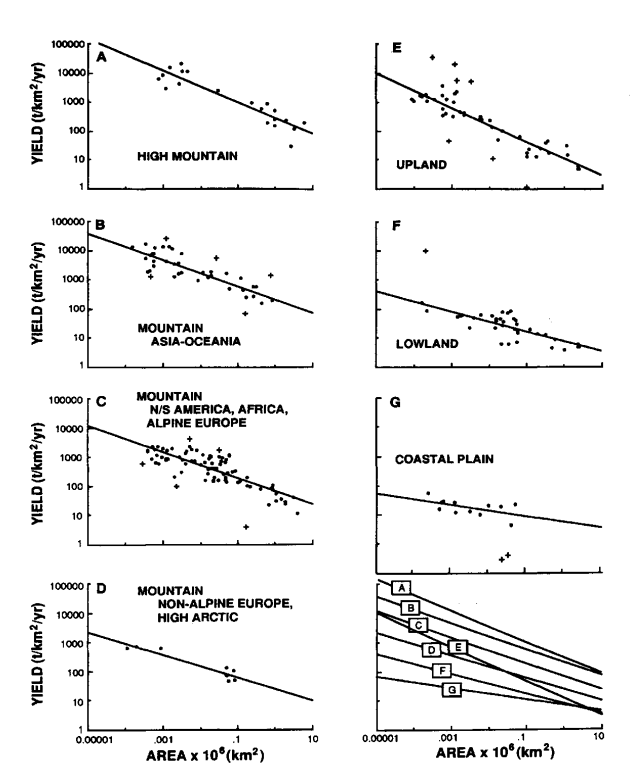
- *The correlation between sediment yield and basin size is stronger in the high mountains than in the coastal plain. All areas show higher sediment yields in smaller drainage basins.
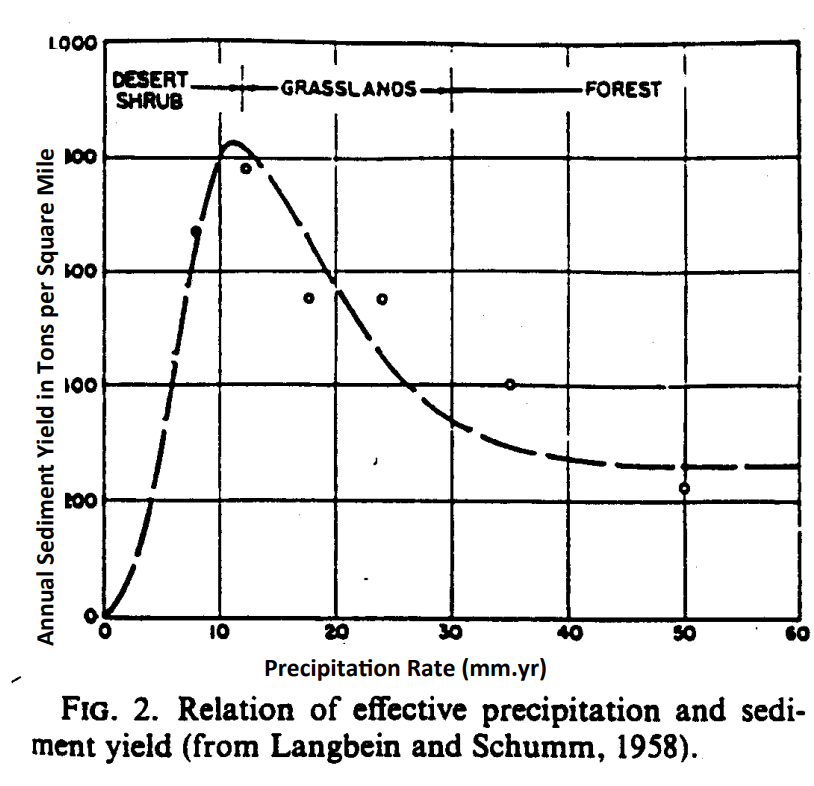
Sediment yield is not a simple function of rainfall because of the effects of vegetation.
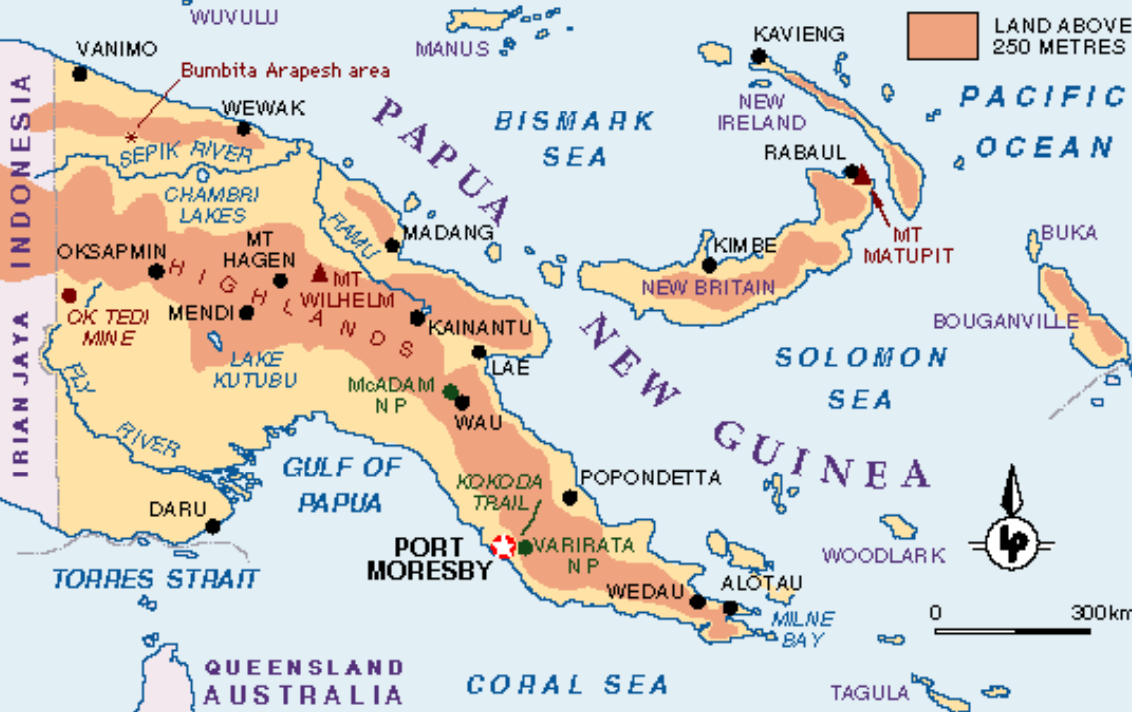
How does the island of New Guinea have an oceanic sediment discharge rate equal to the entire Amazon Basin? High relief, lots of rain, small basins with very high sediment yields.
- Waves
- Transmission of energy through air, water, solids
Definitions to know:
- Wave length- Distance from crest to crest
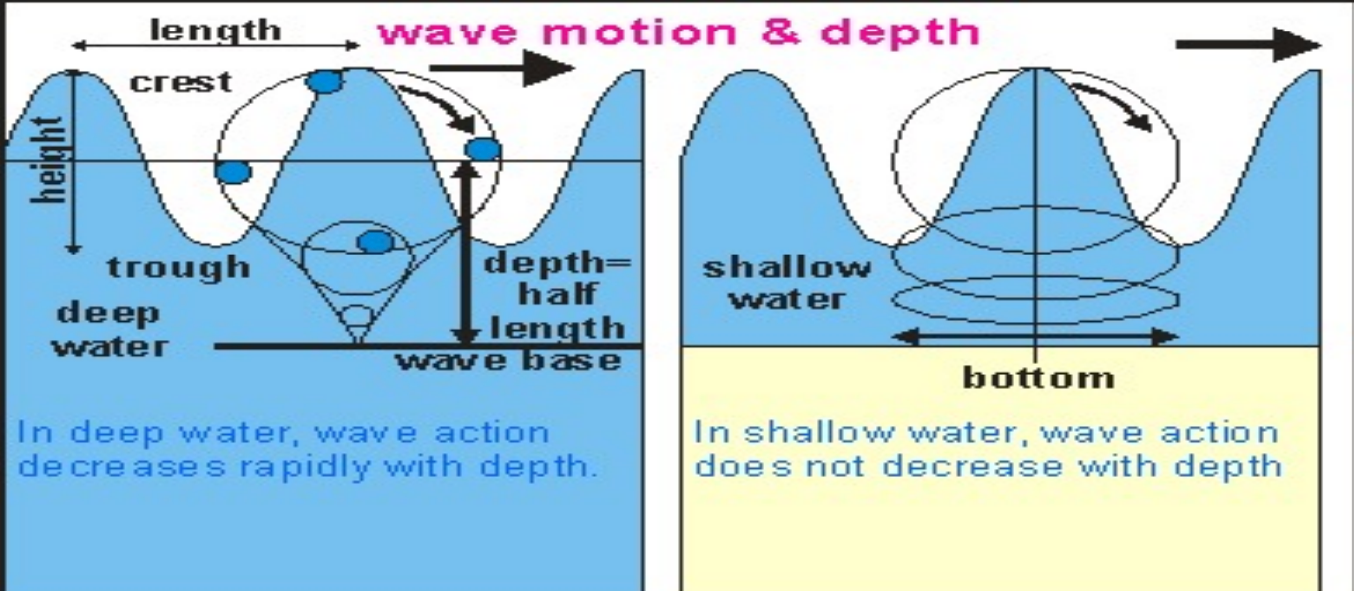
- Depth of wave(wave base)=½ of wavelength
- Wave height- Distance from trough to crest of wave
- Wave frequency- Number of waves that pass a certain point in a period of time. How many cycles in a period of time
- Orbital motion- Circular motion of water as wave movement passes through
- Wave length- Distance from crest to crest
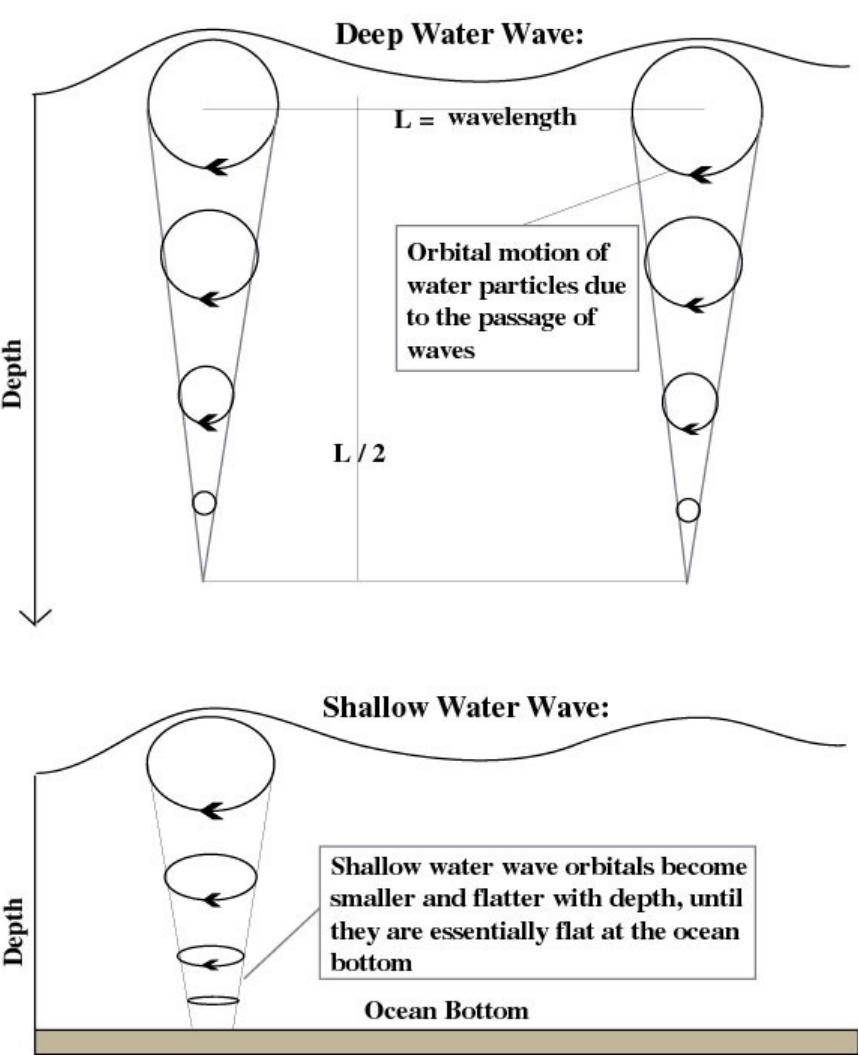
Deep water waves occur when water depth is >½ the wavelength
- In deep water, wave action decreases rapidly with depth
Shallow water waves occur when water depth is <½ the wavelength
- In shallow water, wave action does not increase with depth. Instead, wave orbitals become smaller and flatter with depth until they are essentially flat
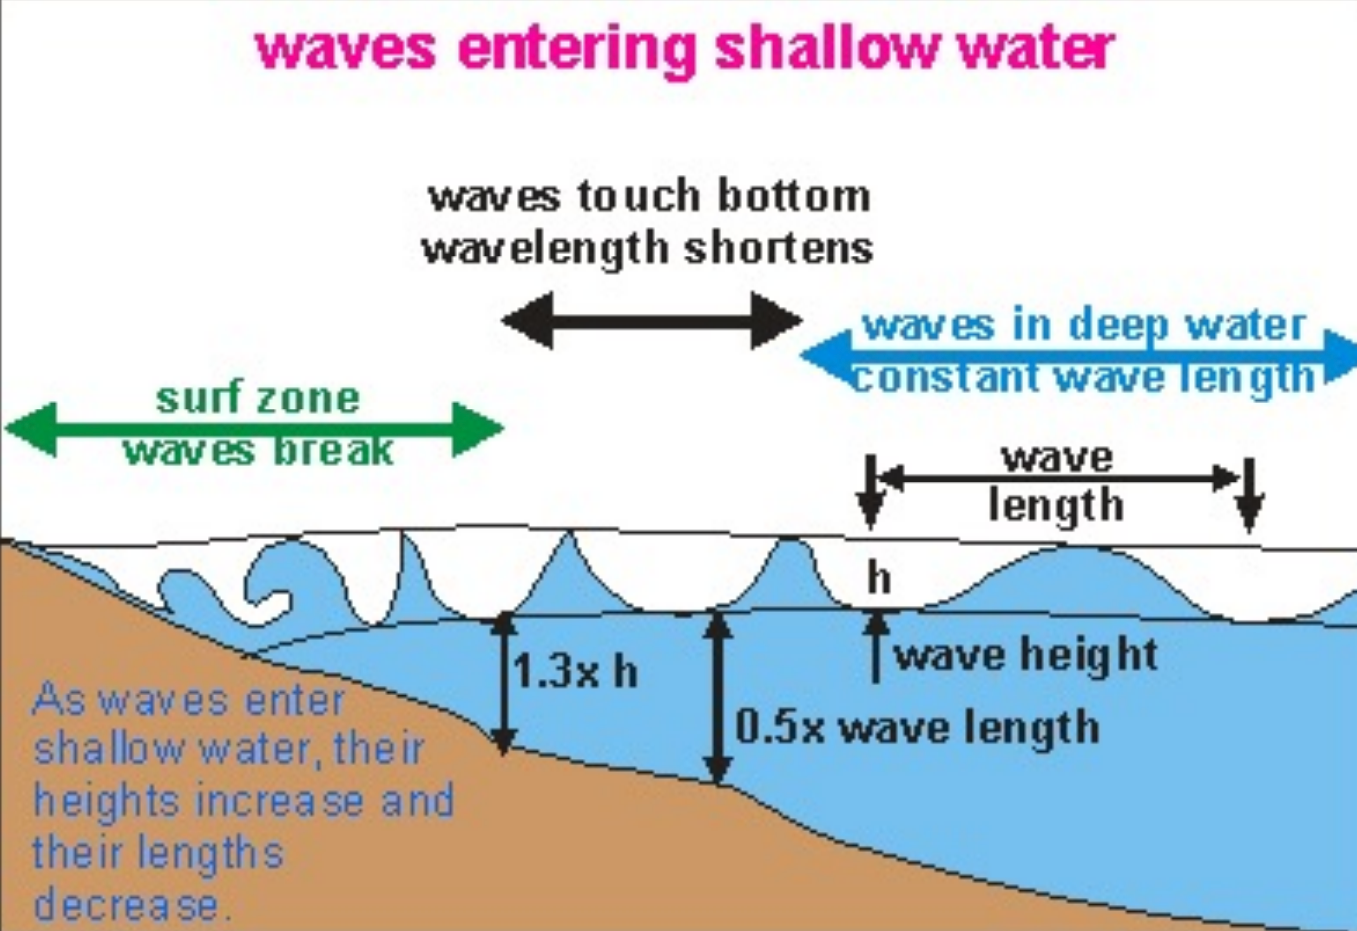
- Waves steepen when they approach the coast, breaking when their height to wavelength ratios are 1/7 or more.
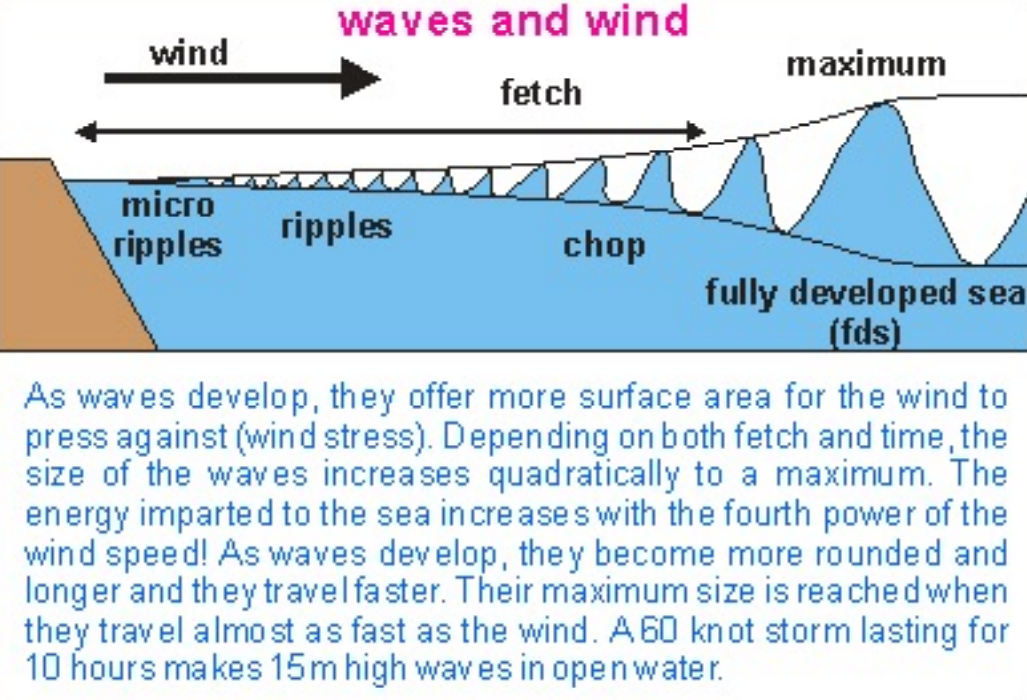
Wave sea state depends on 3 things:
- wind speed, wind duration, and fetch(distance traveled). A “fully developed sea” has reached the maximum wave height for a particular wind speed.
- Note that as wind speed increases, not only does wave height increase, but wavelength and period also increase.
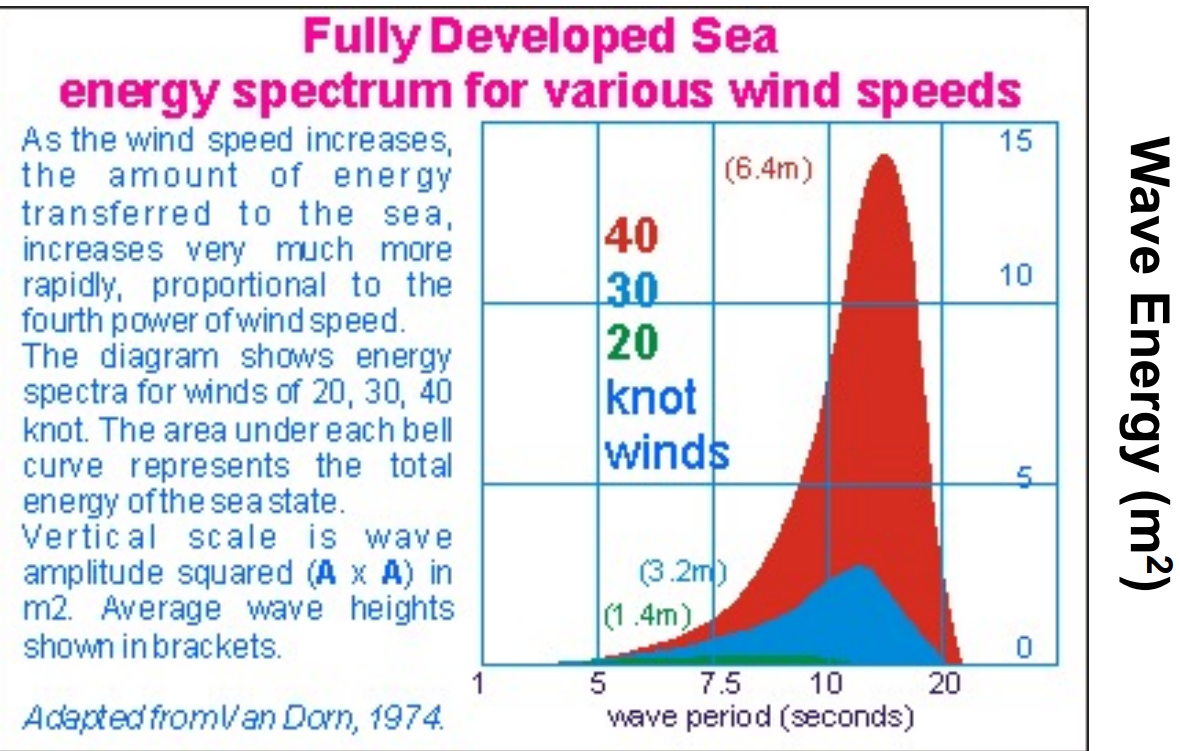
- Wave Energy a (Wind Speed)4
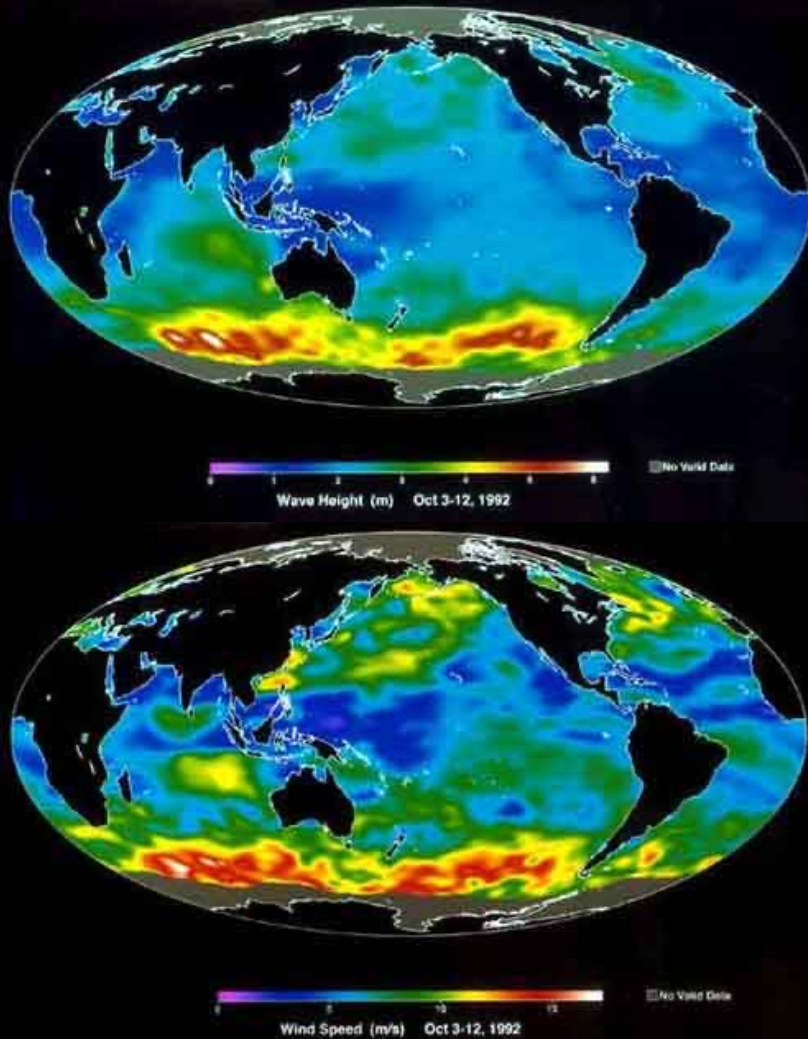
- In areas where mean wave height is high, mean wave speed is also high.
*Wave Refraction:
- Refraction
- Angled crest lines are rotated as they approach the shore
- Wave rays, lines perpendicular to crest lines
- Waves are refracted in shallow water
- Energy focused on headlands and cliffs
- Energy dispersed in bays
- Refraction
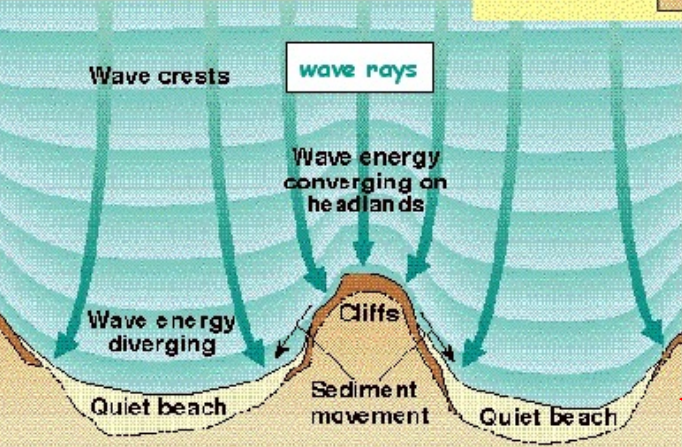
In this figure, it is assumed that the bathymetric contours follow the shape of the coastline.
- Wave Speed for a shallow-water wave = (gd)1/2 where g is the gravity constant and d is water depth.
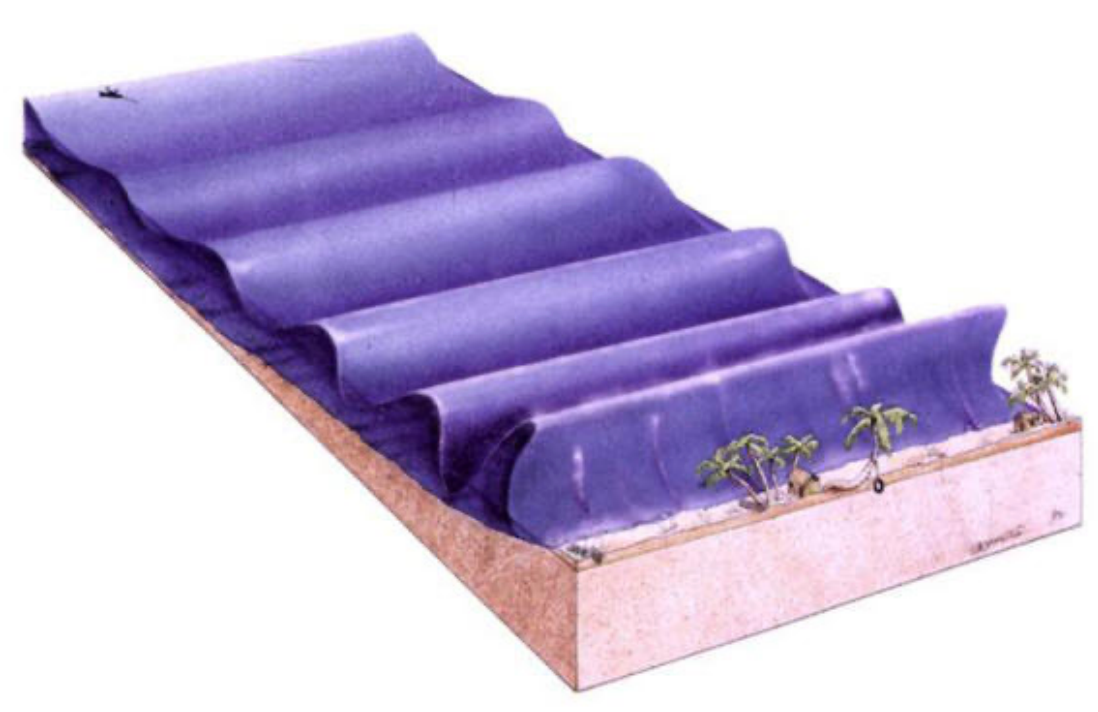
*Wave Diffraction:
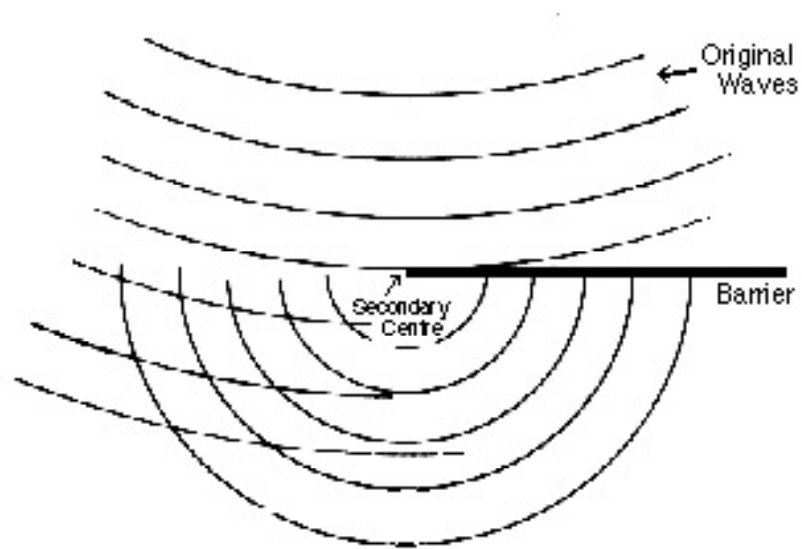
Note generation of waves behind barrier as a result of diffraction.
Wave Reflection
- Common at seawalls. Angle of incidence equals the angle of reflection (billiards law).
Facts about Tsunamis
- The wavelength of a tsunami wave is about 100 km
- In the open ocean, Tsunami wave heights are only 1 m.
- Consequently, tsunami waves are shallow water waves (water depth < wavelength/2)
- Wave speed = (gd)1/2 = 700 km/hr (430 mph)
- A wave loses its energy at a rate inversely proportional to its wavelength
- With a *huge wavelength of 100 km or more, tsunami waves can travel across large distances without losing much energy
- In the open ocean *tsunami wave heights are usually less than 1 meter, but when this long wavelength wave approaches the coast (feeling bottom), wave heights can be as much as 10-15m.
Tsunami development as the wave moves into the coastal zone
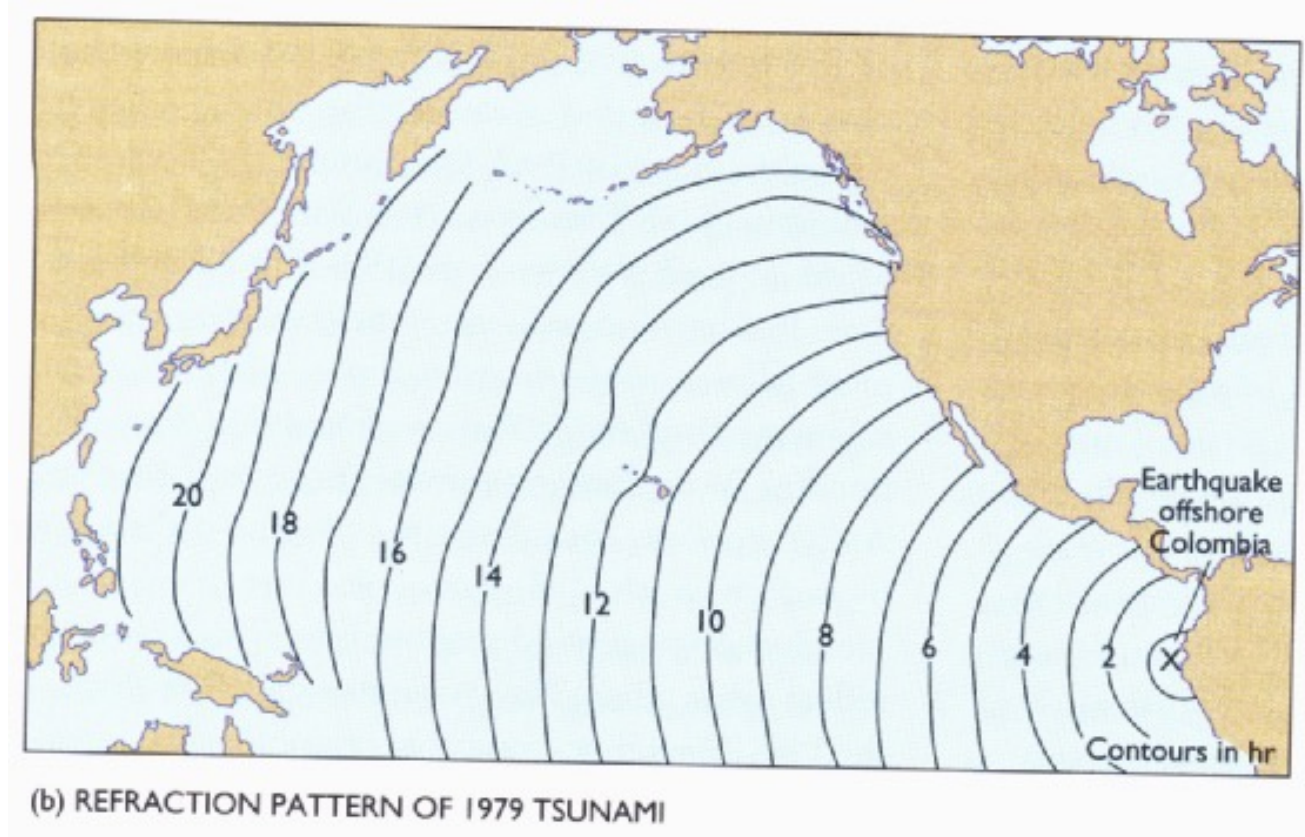
- Tsunamis travel at >400 mph so they can cross the entire Pacific Ocean in 20 hours. Note that the wave front is refracted by the ocean basins because tsunamis are shallow-water waves!
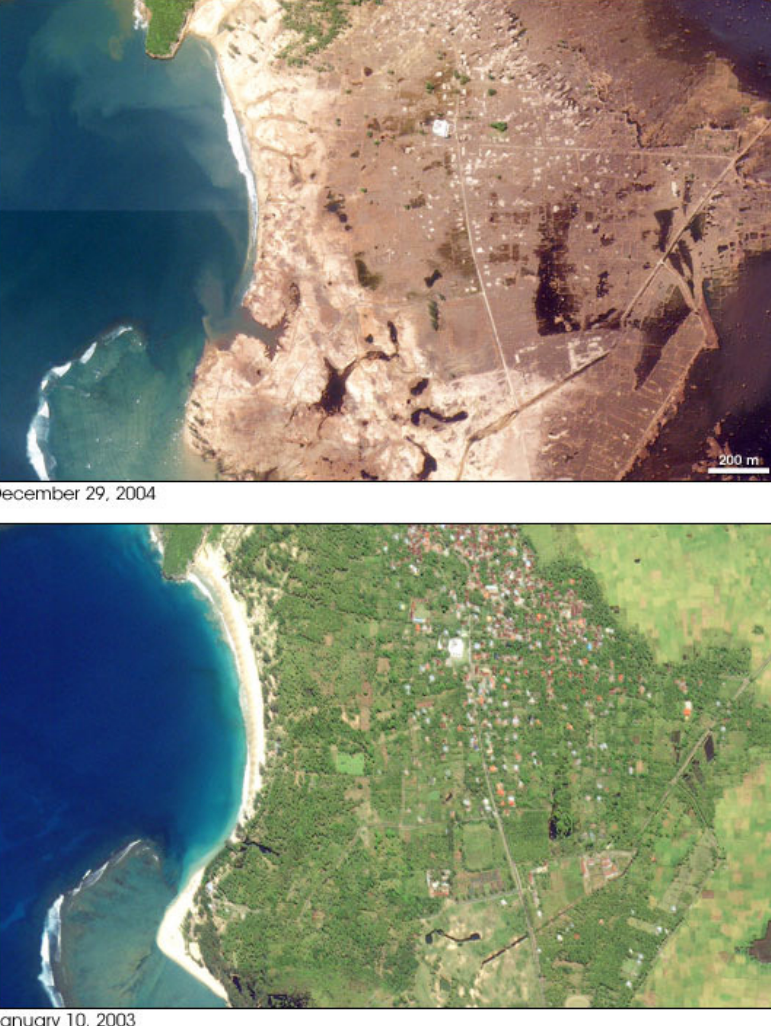
The Sumatra Tsunami
- At 7:58 a.m. (local time), on December 26, 2004, beneath the Indian Ocean west of Sumatra, Indonesia, pent-up energy from the compressional forces of one tectonic plate grinding under another found a weak spot in the overlying rock. The rock was thrust upward, and the Earth shook as a 9.0 magnitude earthquake sent its vibrations out into the ocean. Tsunamis spread out in all directions; the massive waves washed over islands and crashed against coastlines in Sri Lanka, Southern India, and even the east coast of Africa. More than 210,000 people were killed; millions are homeless.
- What happened?
- As the India Plate slides beneath the Burma Plate, it meets pockets of resistance, which causes compressional forces to build up. Weakened overlying rock gets forced upward. Based on the location of aftershocks, the United States Geological Survey reports that approximately 1,200 kilometers of the plate boundary probably slipped as a result of the quake. The initial rupture was likely more than 100 kilometers wide, and probably produced an average vertical displacement along the fault plane (the slope along which the two plates meet) of 15 meters.
- What plate movements occurred?
- Seismic measurements and computer models show that the Burma Plate slipped up to 20 meters (66 feet) at the location of the earthquake, 18 kilometers underground. The sea floor above moved less, up to 5 meters (16 feet) vertically and 11 meters (36 feet) horizontally.
- The maximum rise, along the subduction zone where the Burma Plate is moving over the India Plate, was over 5 meters (16 feet). Along the western edge of Sumatra, the calculations predict the land dropped a maximum of one meter (3.3 feet). This may have moved portions of the coastline permanently below sea level.
- How big were the waves?
- The coastline of Sumatra, near the fault boundary, received waves over 10 meters tall, while those farther away (Sri Lanka and Thailand) were caught by waves over 4 meters. On the other side of the Indian Ocean, Somalia and the Seychelles were struck by waves approaching 4 meters in height. Travel times (lower) ranged from minutes (Sumatra) to 8 hours (Somalia) or more.
- Longshore drift
- Develops when waves approach the beach at an angle.
- Rip Currents
- Caused by convergence of longshore currents and wave set up
- Rogue Waves
- At one time there are several storms producing their own characteristic wavelength. If these waves combine they can produce an unexpected giant rogue wave.
Physical Structure of Barrier
Barrier Types
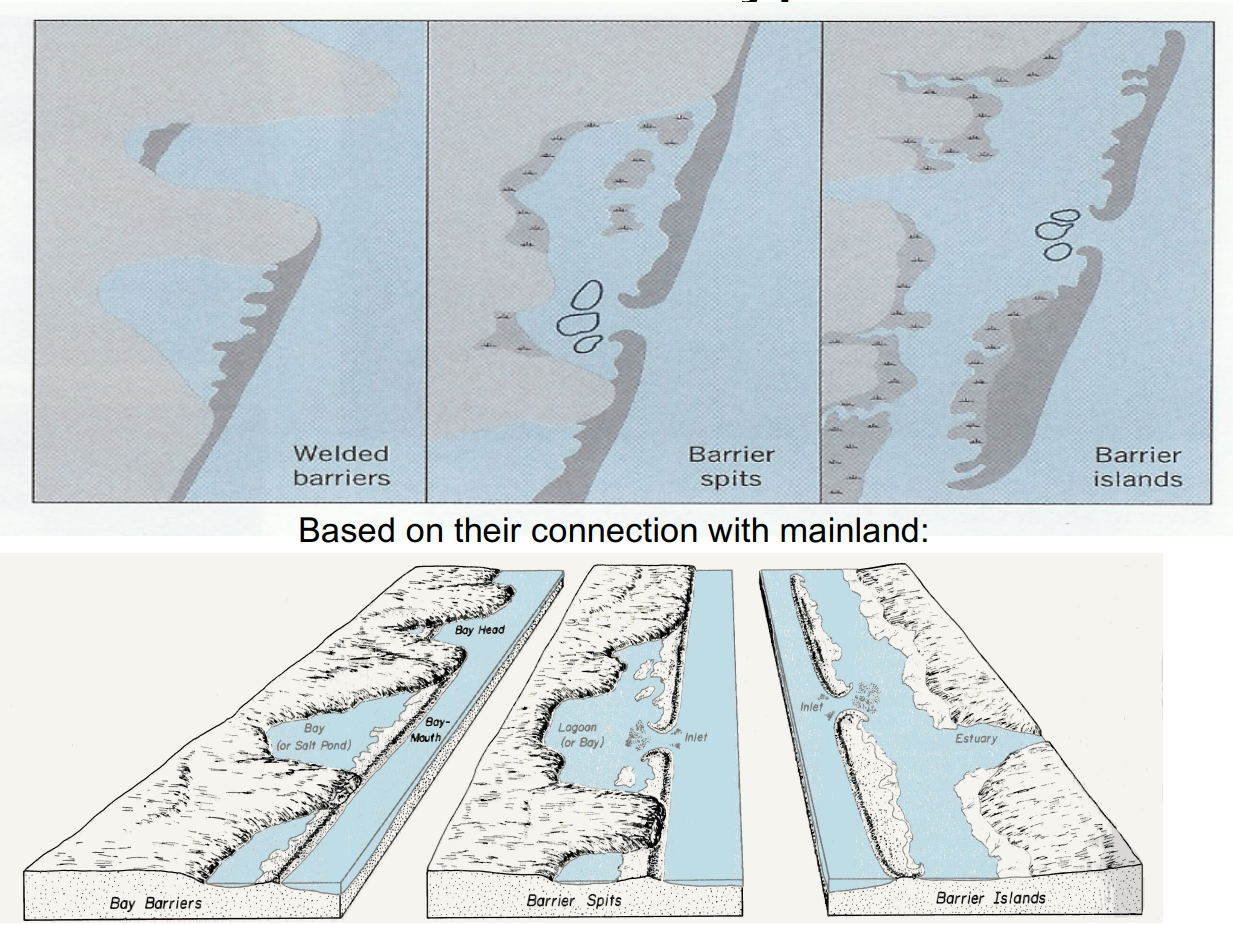
Welded barriers, barrier spits, barrier islands
*1. Barrier Spit Forms
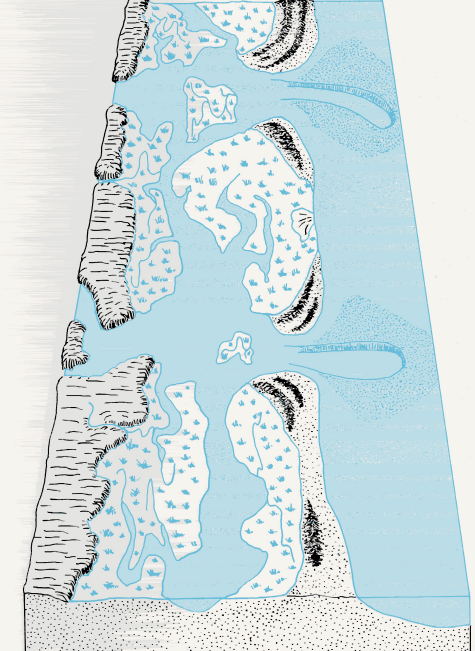
Recurved Barrier Spit
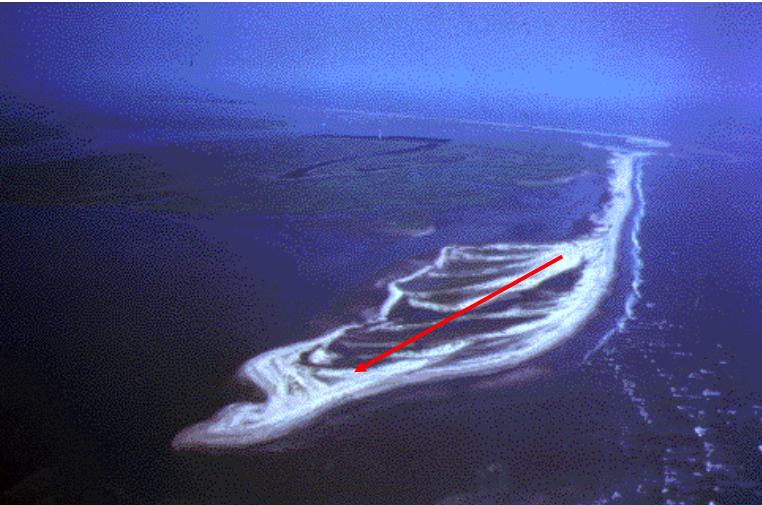
- Storm overwash and other processes have deposited sand in complex patterns along this South Carolina barrier spit.
Spit Accretion
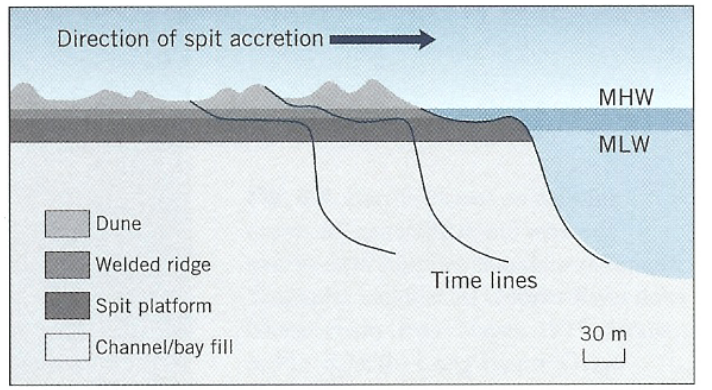
Spit Initiation
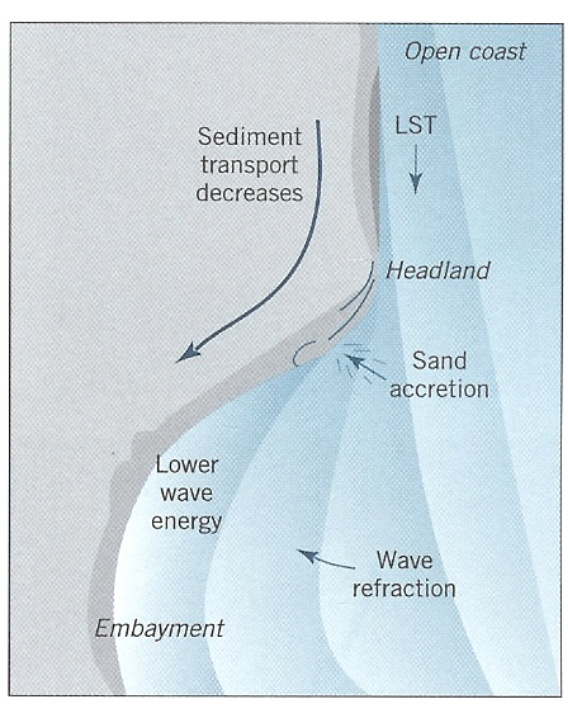
- The rate of sand movement is a function of wave height, more sand is transported along the exposed beach than inside the bay.
- With the sediment transport decreases some sediment must be deposited.
Other Spit Forms
*2. Welded/Baymouth Barrier
- Connect headlands at outer edge of embayment
- Headlands, typically highly erodible, serve as sediment source
- Common in microtidal environments
- Tidal range described height difference between low tide and high tide
- Tidal range in NC ~3ft. Classified as microtidal(0-2m).
- Mesotidal: 2-4m
- Macrotidal: 4-6m
Barrier Islands (microtidal)
- Transgressive barrier islands are highly changeable during significant storm events
- Sediments are abundant in regressive systems
- Microtidal regressive barrier islands typically exhibit multiple dune ridges
- Kiawah Island, SC and Galveston Island, TX are examples of regressive barriers
Barrier Islands (mesotidal)
- Ebb tidal channels and deltas are prominent
- Islands are common along South Carolina shore south of Myrtle Beach
*Microtidal vs Mesotidal Barrier Islands
- Microtidal (0-2m)
- Long, narrow and topographically low
- Few inlets, wave dominated
- Inlets migratory and ephemeral
- Oceanic overwash common
- Macrotidal (0-4m)
- Short and usually well developed
- Numerous stable inlets
- Inlets tide dominated
- Often “drumstick” shaped
- Typically exhibit marsh-filled lagoons
Three main hypotheses for the formation of barrier islands
- 1845-deBeaumont-Johnson concept of the emergence of submarine bars
- 1885-Gilbert-Fisher idea of spit growth and later breaching by inlets
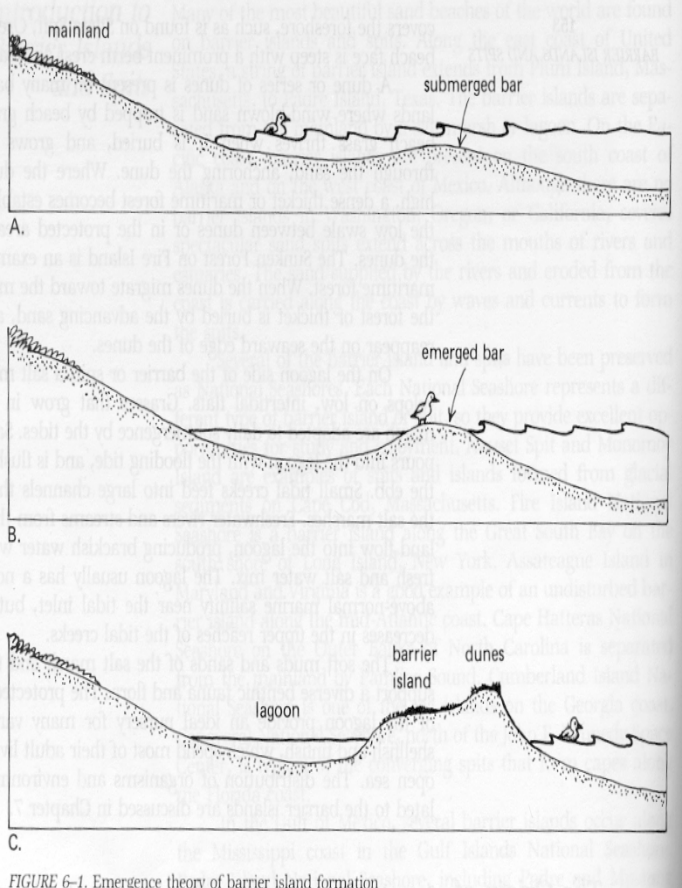
- 1890-McGee-Hoyt hypothesis of beach ridge submergence
- All three theories are possible, depending on beach structure and type of sediment
1. Emergence of submarine bars
- 1845-deBeaumont suggested that islands such as those found in the North Sea and the Gulf of Mexico were formed by what is known as bar emergence.
- Submarine bars are located offshore. When waves come into the shore, they sweep across the shallow bottom and pick up loose sand and deposit it on these bars. The bars grow in size and rise above sea level to become barrier islands.
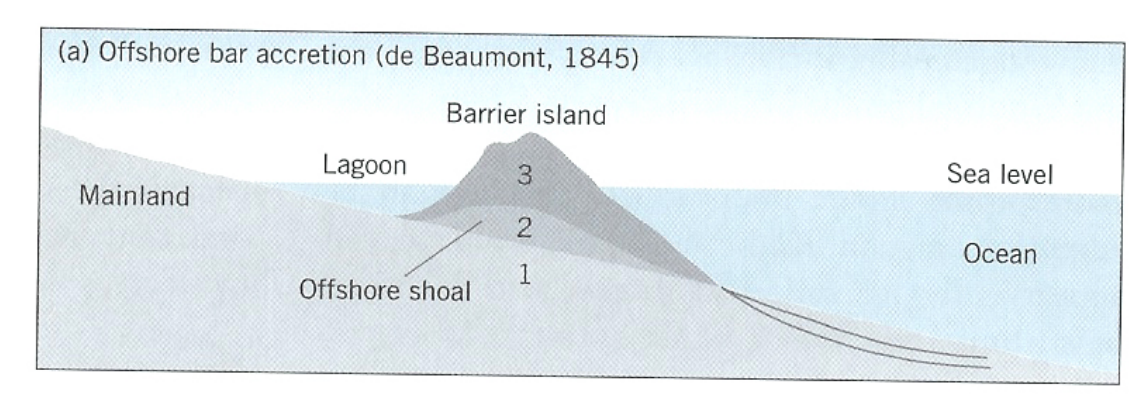
Emergence Theory
- Waves break over a submerged bar
- Bar emerges above sea level due to deposited sediment
- Bar develops into barrier island and lagoon
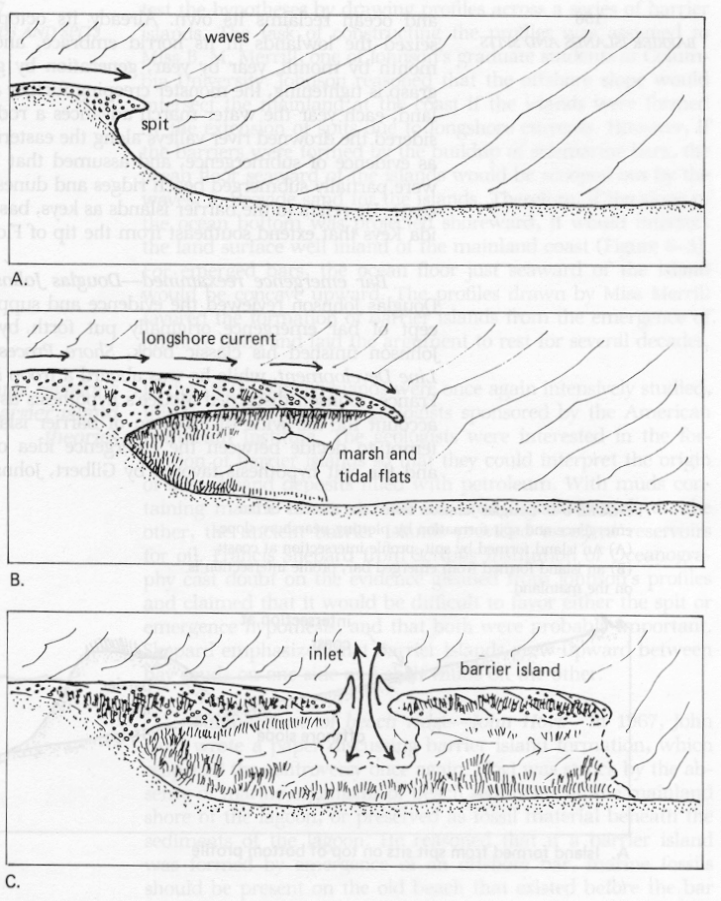
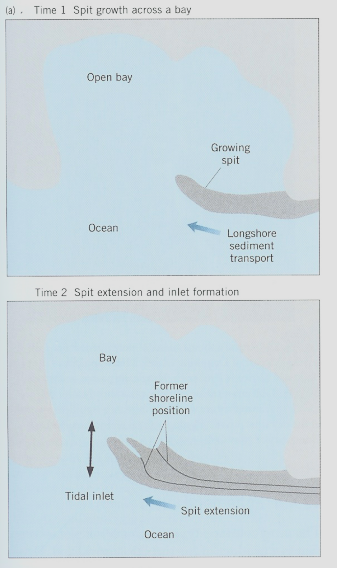
2. Spit Growth
- 1885-Gilbert proposed that barrier islands were formed from spits by currents flowing parallel to the coast-the longshore current. Individual islands were created when the spits were breached by waves during storms, creating inlets.
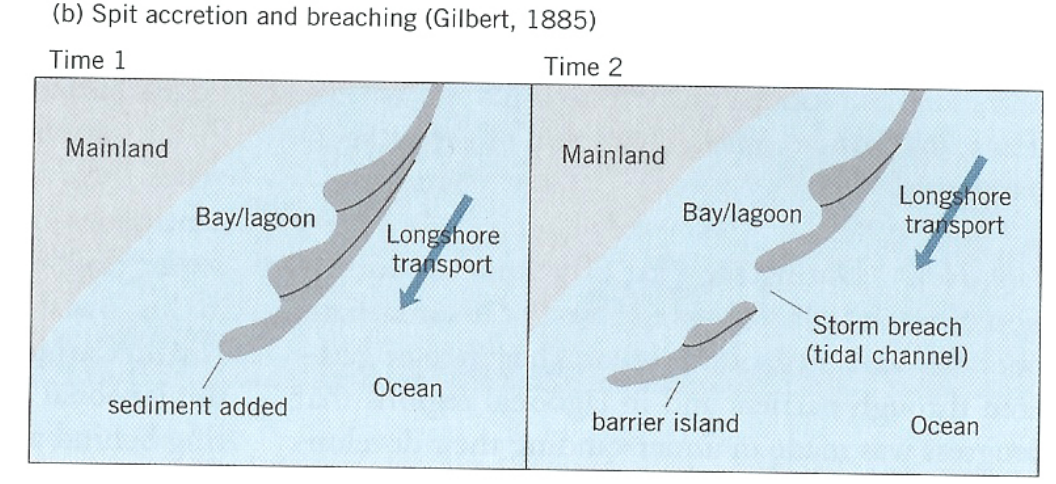
Spit Formation
- Spit starts to grow from point of land
- Spit is extended along the coast by longshore currents
- Spit is breached during a storm, forming a tidal inlet and barrier island
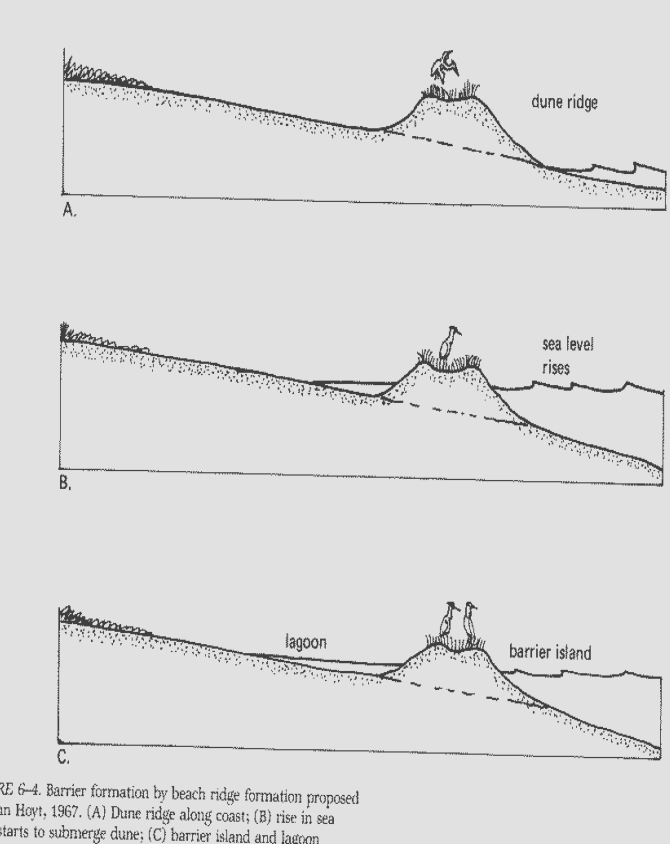
3. Dune-Ridge Submergence
- 1890-W.D. McGee suggested that barrier islands were produced by drowning of the coastal area during a rise in sea level
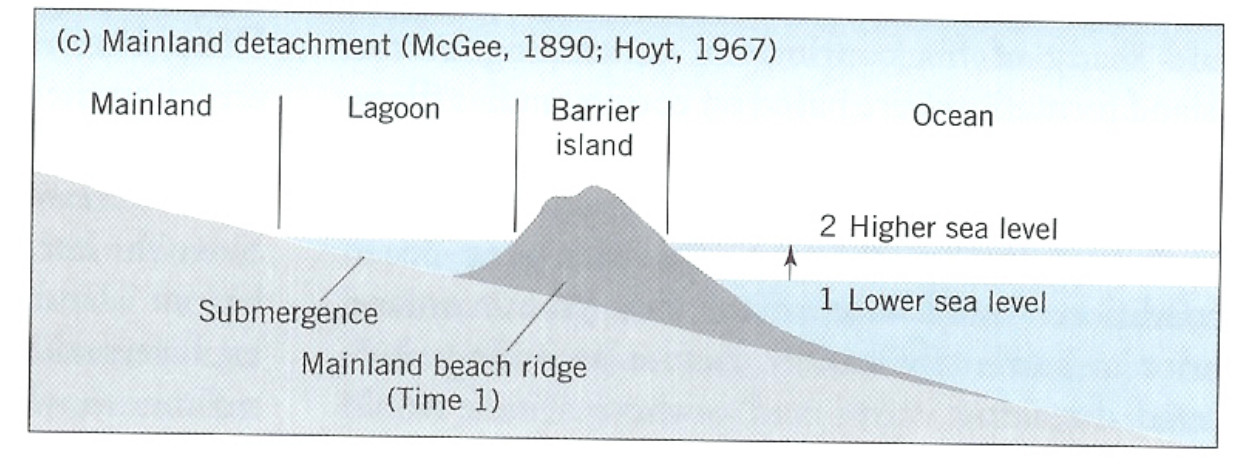
Beach Ridge Formation
- Dune ridge along the coast
- Rise in sea level starts to submerge dune
- Barrier island and lagoon formed from ridge
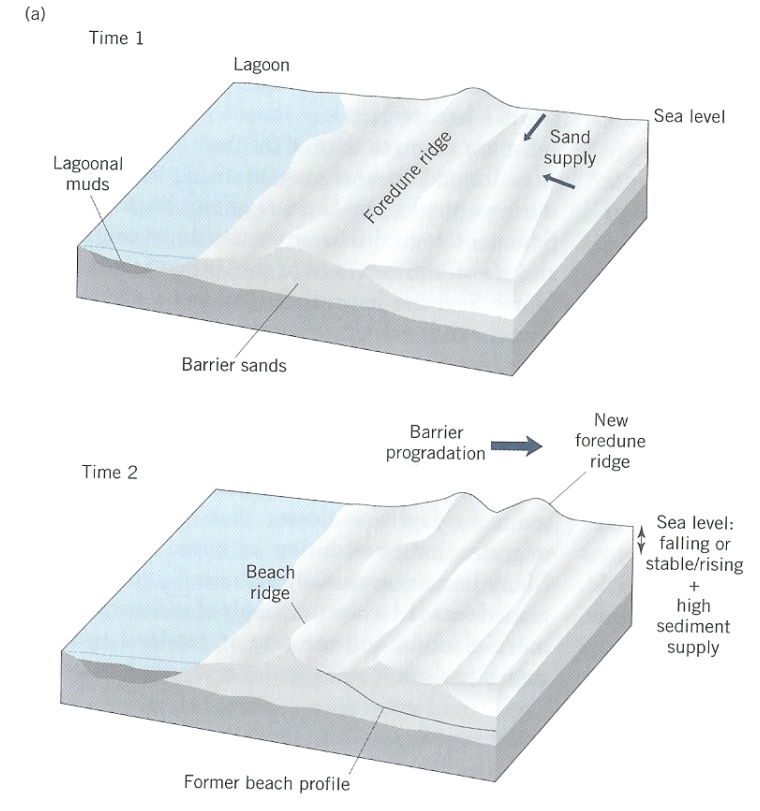
Prograding, retrograding and aggrading barrier
- Supply of sediment
- Rate of sea-level rise
- Storm cycle
- Topography of the shelf
- Oceanographic regime
Prograding Barriers
- Occurs when there is abundant sediment supply
- Barrier is moving forward(away from the land), or ‘prograding’, over time
Retrograding Barriers
- Occurs when the supply of sand is inadequate
- Barrier is moving back(towards the land), or ‘retrograding’, over time
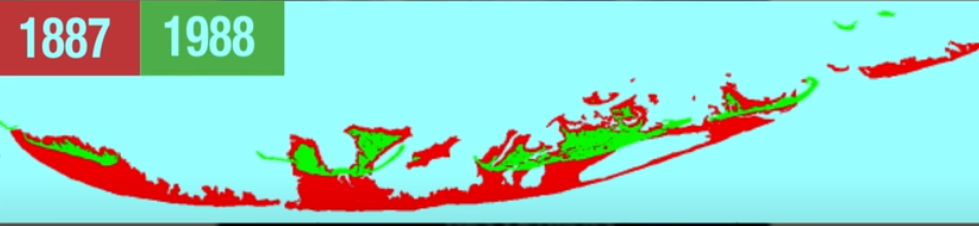
Shows the position of islands near New Orleans, 100 year difference
Example of islands near New Orleans retrograding and moving towards the mainland over time while also losing land mass
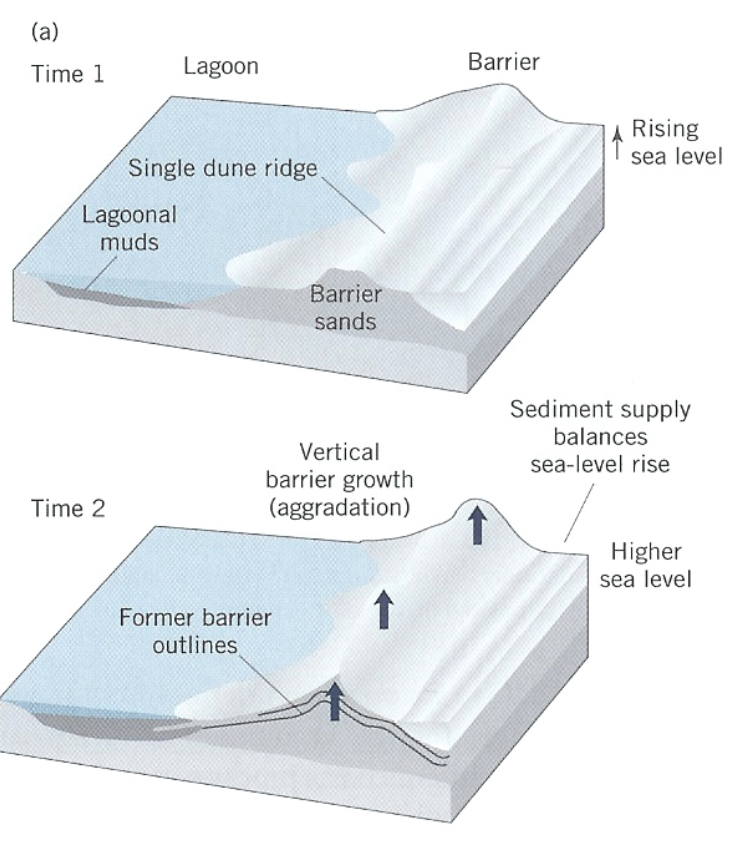
Aggrading Barrier
- When sand build upward due to rising sea level
(after this slide we did not talk about rest of slides and moved onto next slideshow)
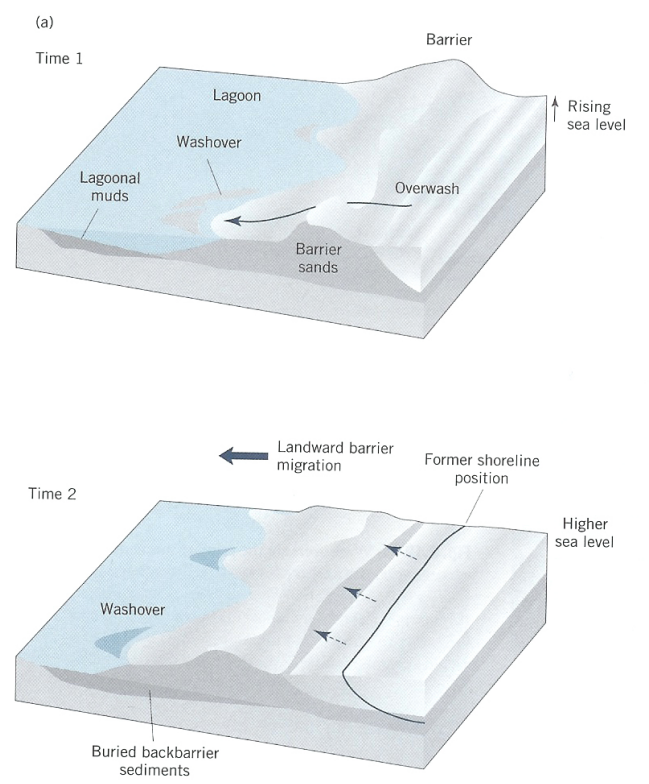
Chapter 5- Barrier Island and Overwash
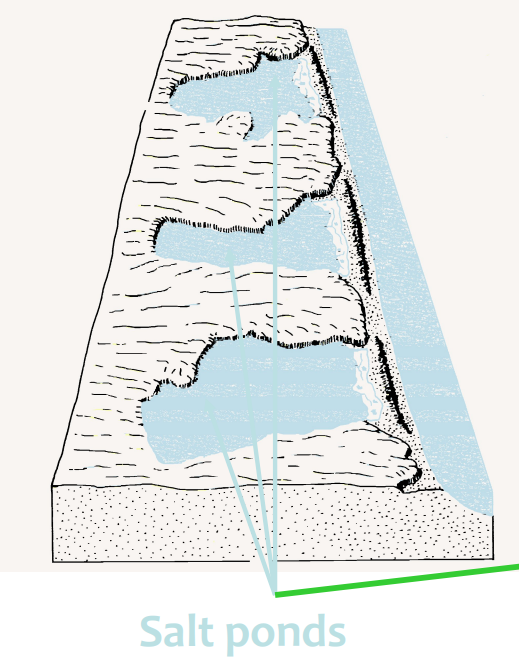
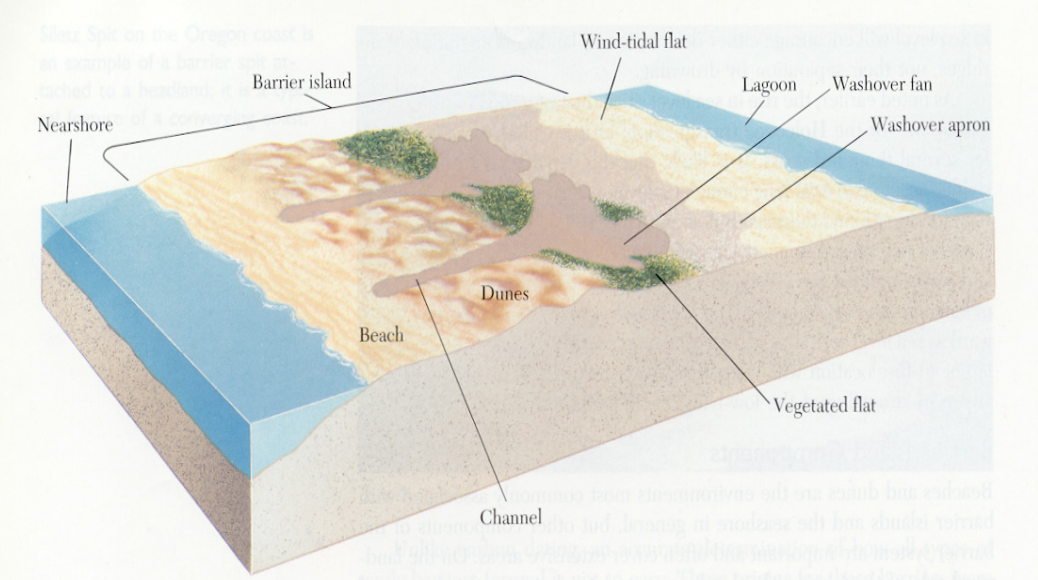
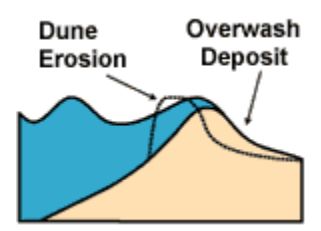
Oceanic Overwash
- The washover fan is a fan-shaped accumulation of sand and shell that is deposited in a thin layer during intense storm conditions when part or all of the beach-dune system is overtopped or breached by incoming waves and storm surges
- Fans may come together to form a washover apron
- Sediment accumulations may be a few tens of centimeters or up to 1 meter thick
- Sediment will cover vegetation on the back side of the island, but plants can grow up through the sediment, reworking the layering of the sediments
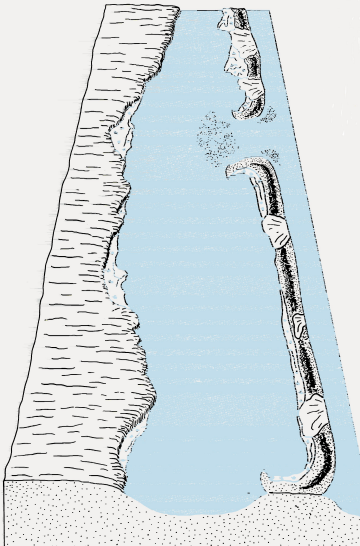
Overwash and Storms
- Strong wind and waves causes storm surges to wash over low dunes or create breaks in the dune system
- New inlets can be formed in low lying areas on the island
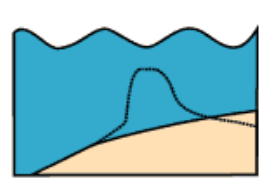
Overwash and Transgression
- Sediment is transferred to the back side of the island by overwash
- Sediment may bury marshland on the lagoon side, building up the back side of the island
- Overwash process erodes sediment from the front side and carries it to the back
- The combination of erosion on the front and buildup on the back of the island are factors that lead to island transgression
Man-made Interventions
- Groins- A shore protection structure built (usually perpendicular to the shoreline) to trap lateral drift or retard erosion of the shore
- Jetties- Structures intended to keep sand from flowing into a channel; intended to protect an inlet
- Sea walls- Rock or concrete structures built parallel to the shoreline; intended to protect buildings by repelling the sea
- Beach replenishment- Building up the beach system by depositing sand
Beach Replenishment
- Beach replenishment is used to add dredged sand or sediment from an inland source to the beach system.
- Procedure is expensive and not a permanent solution
- Some prefer this temporary fix to the more permanent structures that may cause more damage in the long run
Chapter 6- The Coast: Beaches and Shoreline Processes
Asked to draw coast profile from memory:
- Coastal region constantly changes
- Primarily due to waves
- Erosion
- Deposition
- Many people live in coastal regions
- 80% people in U.S. live within easy access of coast
- Shore= Foreshore + Backshore(berm)
- Coast= Starts at the end of backshore and goes inland
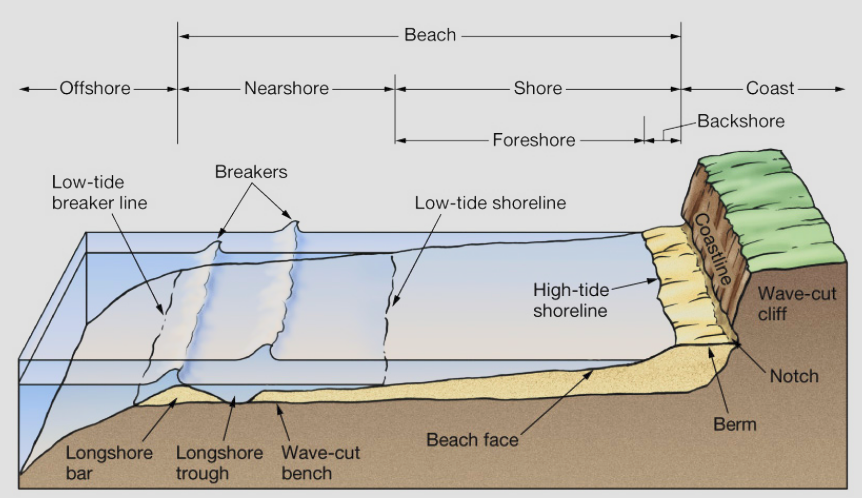
Beach Terminology
- Berm – above the normal high water mark to the coastline
- Foreshore - between low tide mark and normal high tide mark
- Backshore = berm
- Shore = foreshore + berm
- Nearshore – below low tide mark to low tide breaker zone (sub tidal always)
- Offshore – below low tide breaker zone
- Beach = nearshore + shore
Beach Profiles and Composition
Profile
- Beach is the work of waves
- Berm: dry relatively flat
- Beach face: dry at LW, sloping
- Longshore bars: sand bars that are parallel to the coast. Sometimes exposed at low tide
- Longshore trough: in between bars and beach face. Sometimes the site of strong longshore current
Composition
- Local available material
- May be coarse or fine
- Boulders from local rivers
- Sand from rivers
- Mud from rivers
- Significant biologic material at tropical beaches
- For instance, coral reef material and calcareous algae
- Material on beaches is constantly being reworked. Beaches are in motion.
Sand Movement along Beach
- Perpendicular to shoreline
- Swash and backwash
- Balance between swash and backwash determines if sediment is deposited or eroded from the berm
- Parallel to shoreline
- Longshore current
Swash and Backwash
- After wave breaks, swash on beach
- Sediment moves toward land
- Backwash
- Sediment moves away from shore
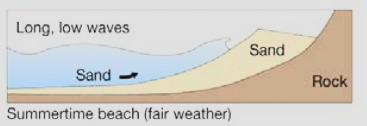
- Light wave activity
- Long wavelength waves from open oceans
- Swash dominates
- Fair weather
- Summertime beach
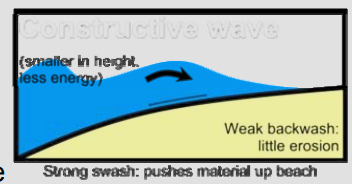
Swash dominated summer:
- Light waves with low energy
- Long period of waves
- Sand is transported shoreward and piles up on berm
- Steep beach face
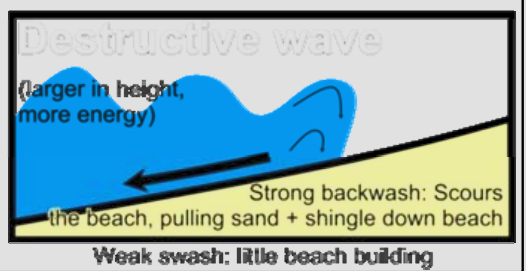
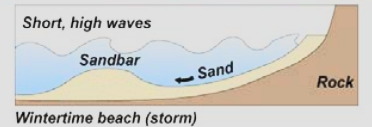
- Heavy wave activity
- Shorter and high energy waves
- Backwash dominates
- Sediment moves away from shore
- Narrower beach
- Sand forms offshore sand bars
- Local stormy weather
- Wintertime beach
Backwash dominated winter:
- High energy waves
- Flatter and rockier beach face
- Sand is stored as sandbar which will be swashed shoreward in summer
- Characteristics of beaches of light and heavy wave activity:
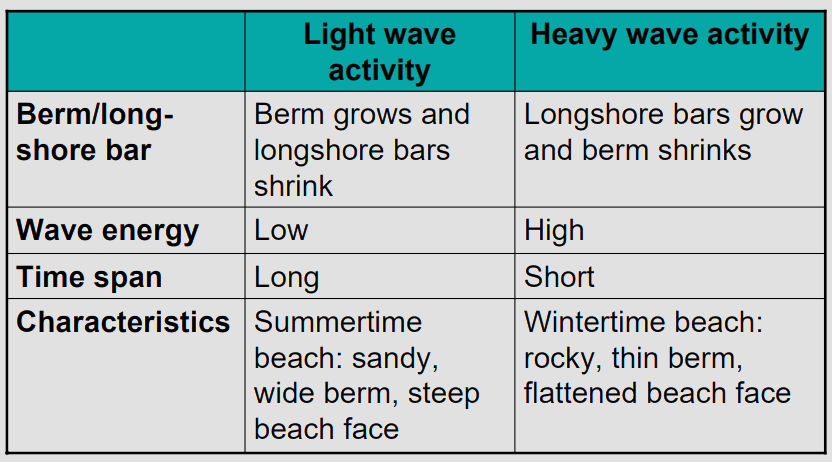
*know this table
Longshore Current
- Happens same time as perpendicular sediment transport
- *Wave refraction causes water and sand to move parallel to shore
- Zigzag motion in the surf zone due to waves hitting shore at an angle and backwash coming straight out from shore. Causes net movement, longshore drift, down the shore
- Longshore current
- Longshore transport
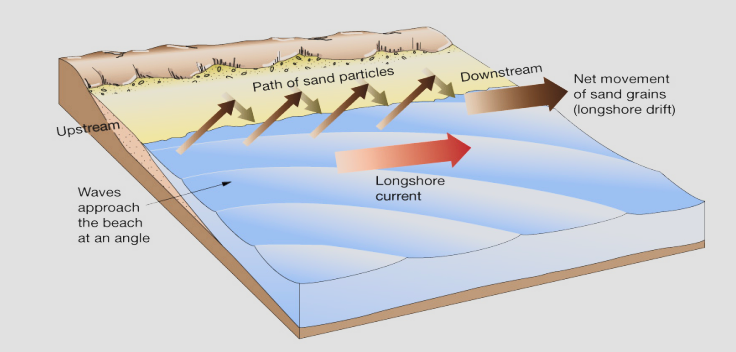
- Refraction is the culprit for longshore drift
- Refraction causes wave to bend and break nearly parallel to shore
- Wave strike (the swash) at a small angle
- The backwash is straight down the beach face
- Results in zigzag sediment movement along the shore
Longshore transport:
- Occurs only in the surf zone
- The total longshore drift depends on the balance between erosion and deposition, and the angle of wave approach
- Millions of tons of sediment moved yearly
- Direction of transport changes due to wave approach
- Generally southward transport along U.S east coast
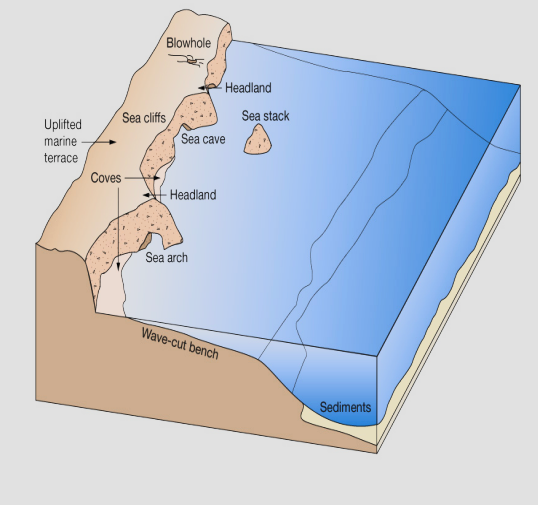
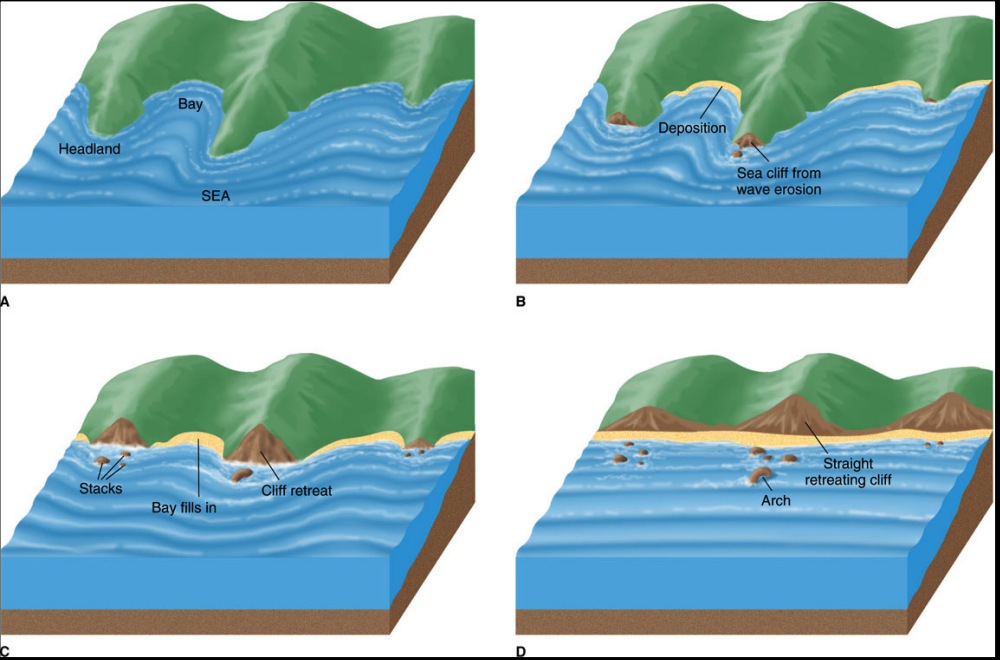
Erosional Shoreline
- Well-developed cliffs
- Recent tectonic activity
- Headlands
- Wave-cut cliff with sea cave
- Sea arches and sea stacks
- Marine terrace
- The wave cut bench that gets uplifted
- The marine terrace is above sea level
- Wave erosion increases with:
- More shore exposed to open ocean
- Smaller tidal range
- The wave energy is more focused on a narrow strip of cliff rather than distributed across a large area
- Weaker bedrock
- Features of erosion coast:
- Headland
- Wave-cut cliff
- Sea cave
- Sea arch
- Sea stack
- Marine terrace
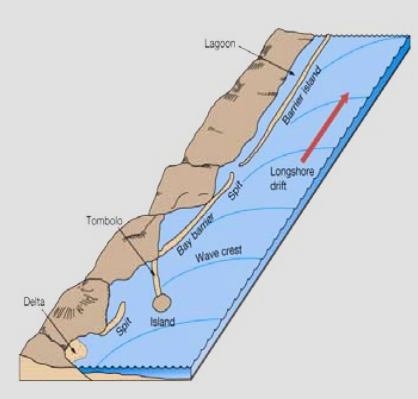
Depositional Shorelines
- Primarily deposited by longshore drift
- Beach
- Spit
- Ridge of sand pointing in the direction of the longshore drift.
- Bay barrier
- Sand extending from mainland
- Barrier island
- Like Outer Banks
- Delta
- Outwash from a river or stream
- Tombolo
- Connects island to island or island to mainland, perpendicular to incoming waves
- The berm crest is the break between a predominantly terrestrial and a predominantly marine habitat – it is the area of the highest high tide waves. The beach behind the berm crest, or landward, is called the backshore and is where the sand is dry, rarely exposed to any ocean water. Organisms found in the backshore area are generally terrestrial forms from nearby.
(skipped past the two slides with graphs)
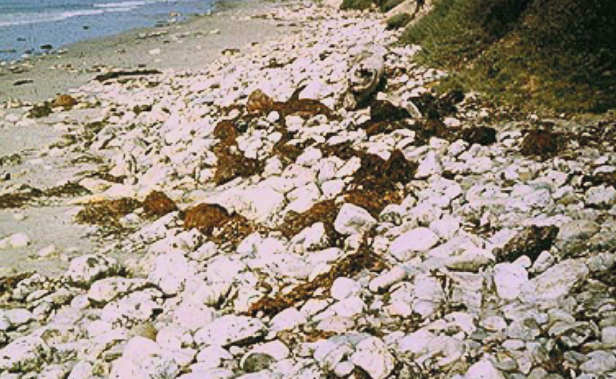
Large winter waves take away sand from a sandy beach. Although each year is different, a winter beach generally has much of the fine sand removed. In years with a succession of large waves during periods of high tides many of the beaches almost disappear. This picture shows a beach that has had a period of big waves that have removed most of the fine sand, leaving only rocks.
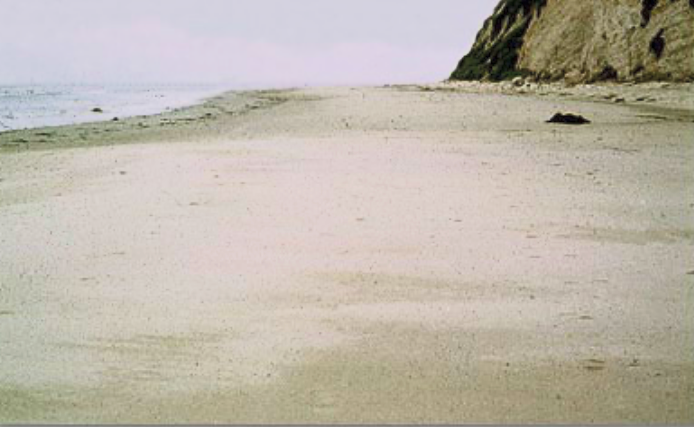
Small summer waves pile sand up on the beach. This picture is of the same beach shown in the previous picture but after a period of small waves for several months. This is the typical "summer beach" piled high with fine sand. Under all the sand is the layer of rocks remaining after winter storm erosion.
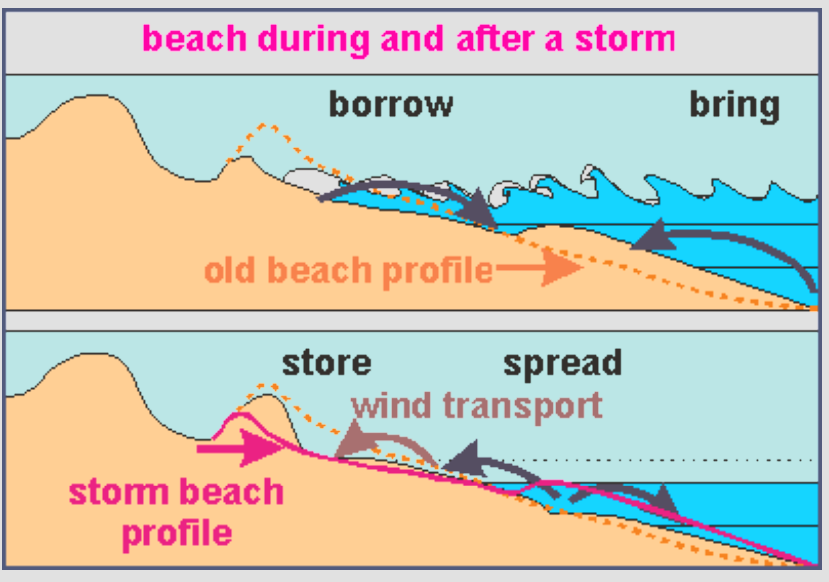
Graph showing when wave power increases the offshore profile becomes much steeper
- Storms tend to move water off of beaches
- Most of the sand moved seaward is stored offshore in sand bars ad may ne slowly returned by wave action
- Sand moved beyond the “depth of closure” is not returned
(watched video after this on how beach profiles are made)
Link: https://youtu.be/NaF7Pq2HkxA?si=Dbe0E1lxQtFMPNrI
What is a dune?
- Area made up of loose sand
Why are they so important?
- Dunes are critical to the health of a beach system.
- Storage of sand to replace beach sand lost during storm events.
- Essential havens for wildlife and plant species.
How dunes form:
- When a barrier slows the speed of the wind, it causes sand to accumulate on the sheltered side, sand accumulates on the exposed side, and eventually buries the barrier.
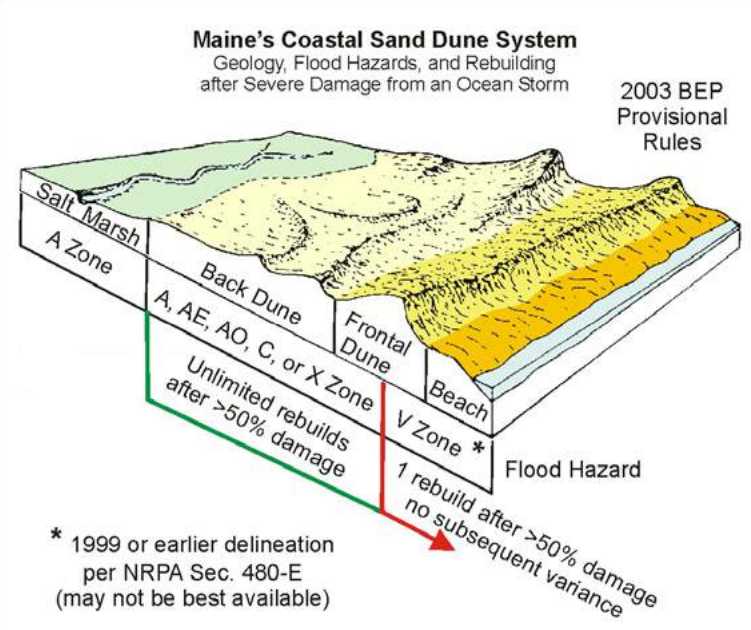
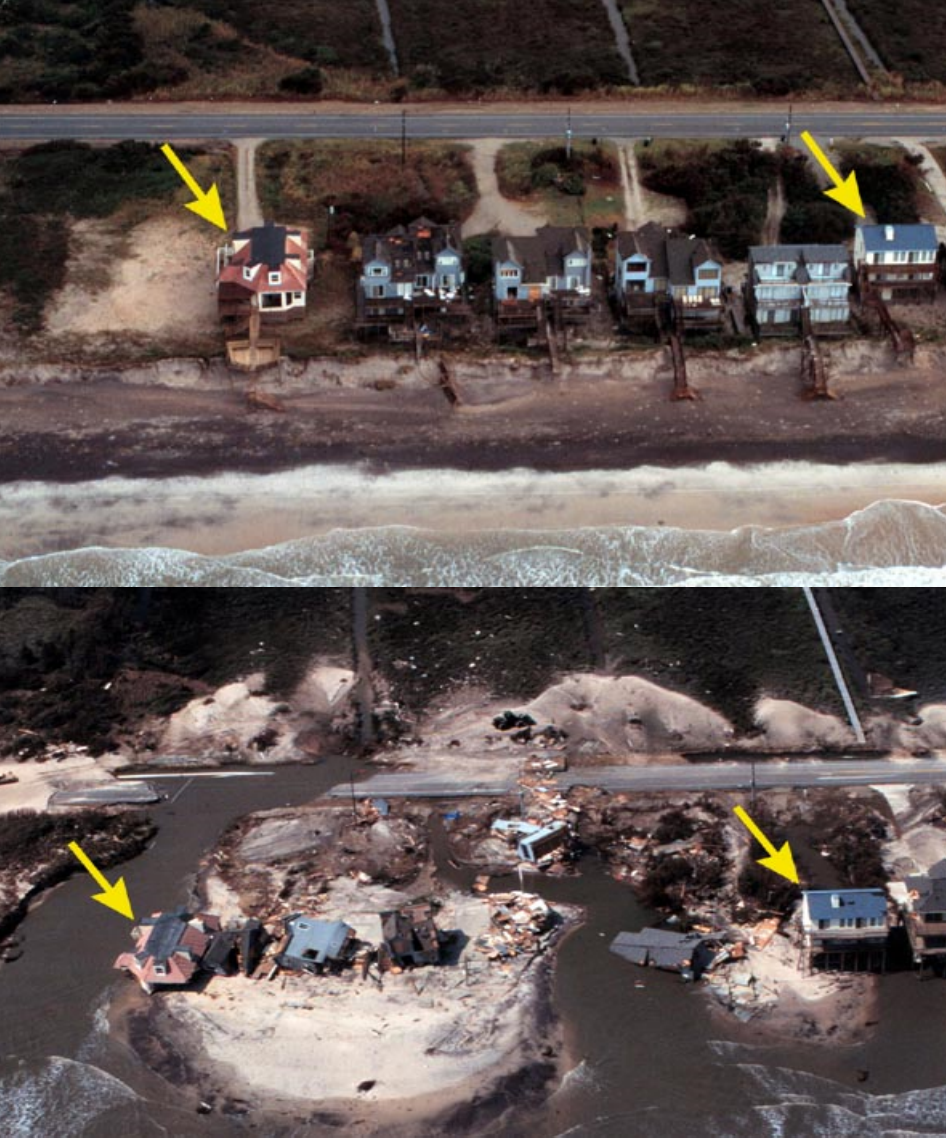
Destruction of Houses and Dunes Affect Rebuilding in Maine
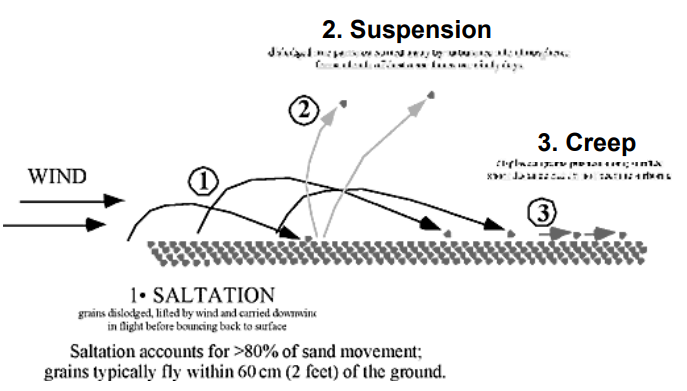
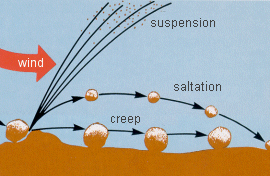
Movement of the sand by the wind:
- 1. Saltation, or jumping grains, on the windward side of sand dunes. 80% of sand movement.
- 2. Suspension
- 3. Creep
Sand Ripple Formation
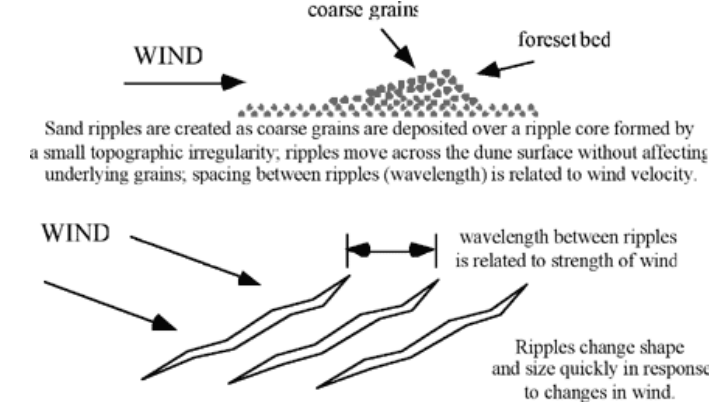
- Sand ripples are created as coarse grains are deposited over a ripple core formed by a small topographic irregularity
- Wavelength between ripples is related to strength of wind
- Note that the difference between ripples and dunes is that ripples are moving sand bedforms responding to wind; dunes are large enough features that they act on and alter wind to create conditions for deposition of sand.
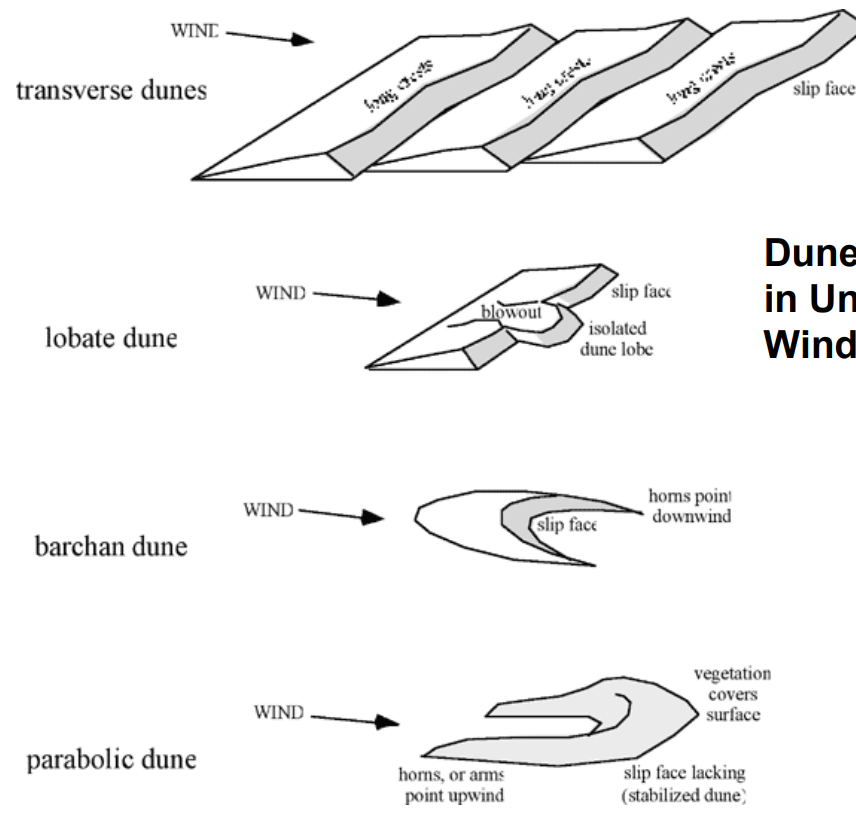
Types of Dunes
- Transverse Dunes: Elongated, asymmetrical dune. Form at a right-angle to the wind
- Lobate Dune: Have a single isolated dune lobe formed downward from a blowout
- Barchan Dune: Horn shaped dune pointing downwind. No vegetation
- Parabolic Dune: Vegetation covered horn-shaped dune pointing upwind
Dune bedding:
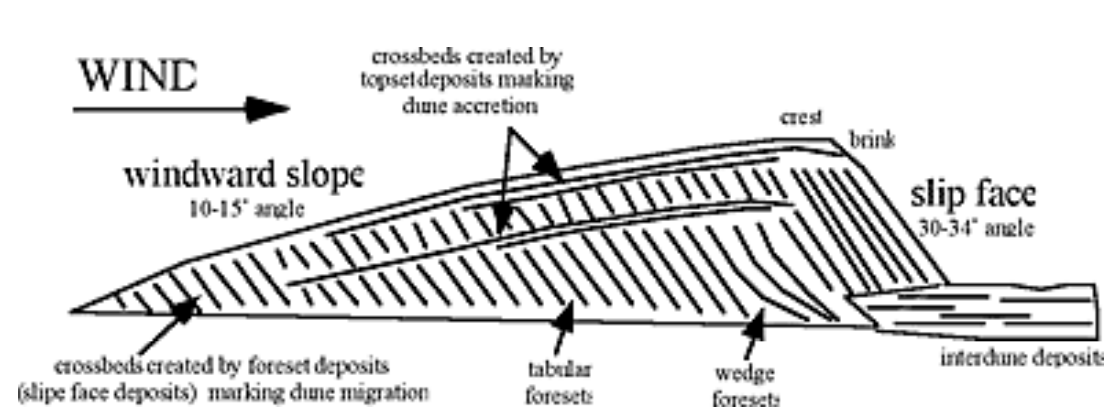
Slip face(30-34o angle) is away from direction wind comes from
Storm-Induced Changes on Dunes and Barrier Islands
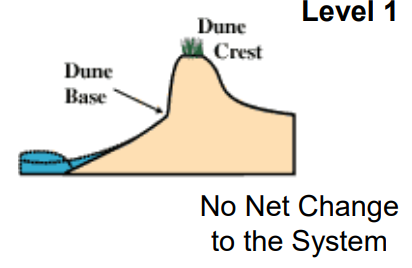
- Impact Level 1
- Swash Regime: During a storm, if wave runup is confined to the beach, the beach will typically erode and the sand will be stored offshore. However, over weeks to months following the storm, the sand naturally returns to the beach, restoring the beach to its original configuration.
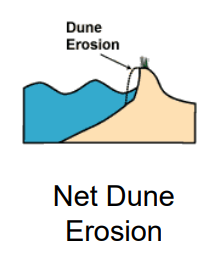
- Impact Level 2
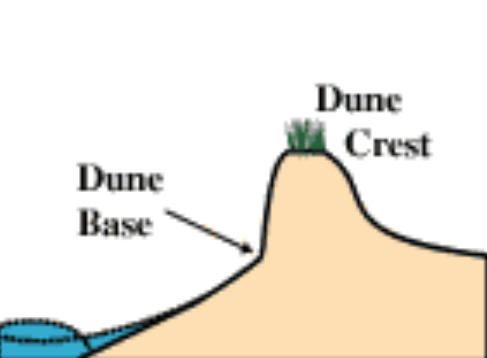
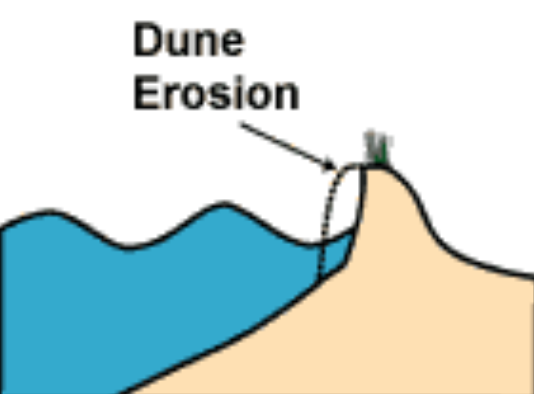
- Collision Regime: If wave runup exceeds the elevation of the base of the dune, the runup will collide with the dune causing erosion and dune retreat. Unlike the temporary changes of Level 1, this change is considered a net, or (semi-) permanent, change to the dune.
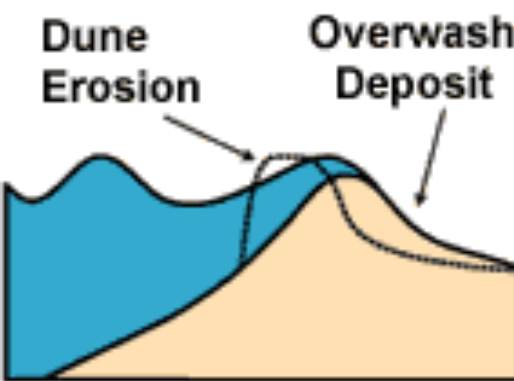
- Impact Level 3
- Overwash Regime: If wave runup exceeds the elevation of the dune, or in the absence of a dune, the beach berm, the system will be overtopped, transporting sand landward. This is a net change contributing to the migration of the barrier island landward.
- Impact Level 4
- Inundation Regime: If the storm surge is high and the elevation of the barrier island is low, the barrier can become completely subaqueous. Sand is transported landward over the island an order of magnitude farther than typical overwash of Level 3.
- Sand facts about Jockey’s Ridge dune in NC
- Jockey's Ridge is the tallest natural sand dune system (140 feet high) in the Eastern United States.
- The amount of sand making up the 420 acres of Jockey's Ridge is equal to about 6,000,000 dump truck loads!
- The Sand is mostly quartz rock which came from the mountains millions of years ago.
- The dunes never blow away because Northeast and Southwest winds blow the sand back and forth
- If there aren’t natural dunes and you want coastal houses, artificial dune construction can protect the coastal environment.
- Many of the dunes that we see in North Carolina today resulted from dune construction in the 1930’s.
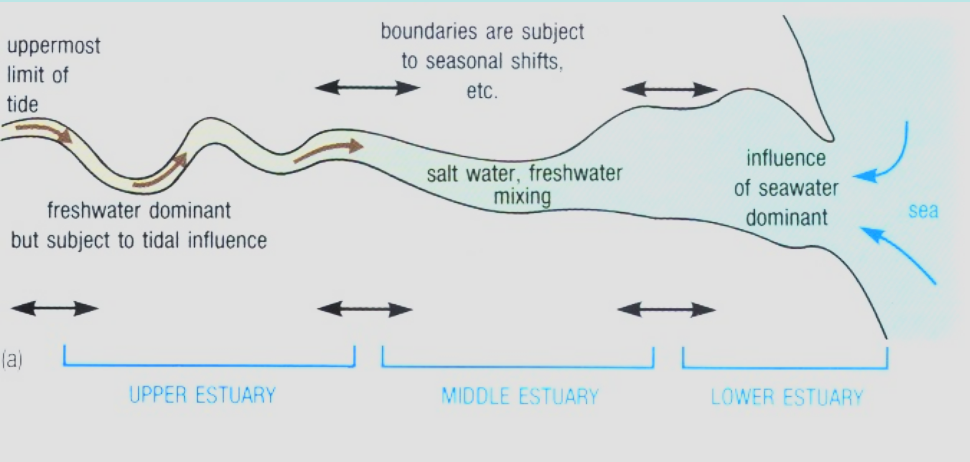
- Semi-enclosed and coastal body of water
- Free connection with open sea
- Within which sea water is measurably diluted with fresh water derived from land drainage
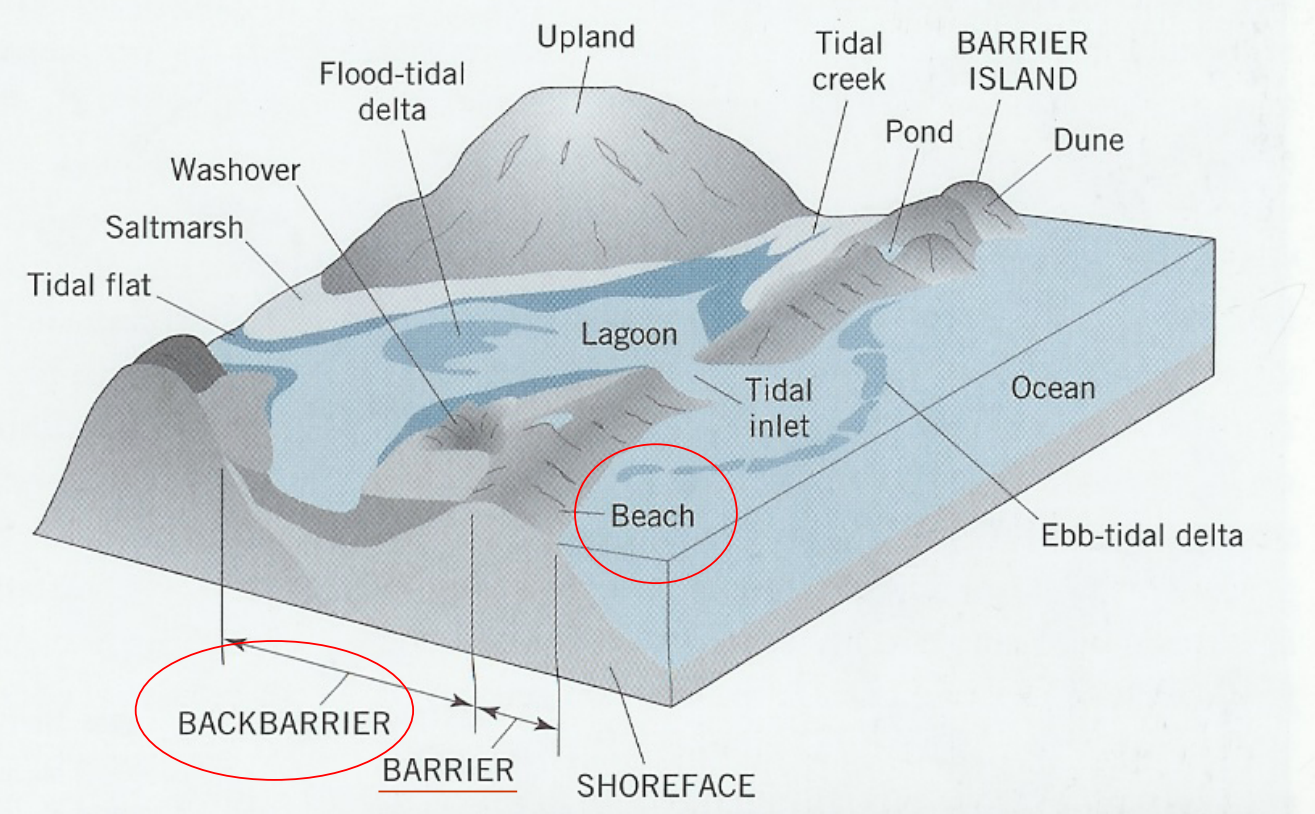
- Schematic of a Typical Estuary
Estuary Features and Landforms
- Each estuary includes a variety of habitats. Some may be bordered by marshes.
- Estuary features such as swamps or lagoons form behind barrier islands and beaches.
- Bays, harbors, sounds, and inlets are all estuaries.
- Bayous are formed by channels of slow moving water leading from a river or lake.
- Salt marshes form in estuaries in areas protected from high-energy waves.
- Tidal flats are part of many estuaries. Oysters and clams are harvested here.
- Mangrove forests surround wetland areas in southern estuaries.
- In mountainous areas, estuaries may be found in seaside fjords.
Life in Estuaries
- Many types of plants grow in estuaries. One of the most common is cordgrass.
- Eelgrass is another common plant that grows in brackish water.
- Many bivalves, such as oysters (above), and mussels (below), inhabit estuaries.
- Blue crabs are harvested to eat.
- Diamondback terrapins are the only turtle that lives in brackish water.
- Killifish thrive in estuaries.
- Alewives live in salt water but move through estuaries and into rivers to spawn. They are a favorite prey species for salmon and many other predators.
- Coho salmon migrate up rivers to spawn each year, returning to the area they were spawned.
- Great blue herons feed on fish and amphibians living in estuaries.
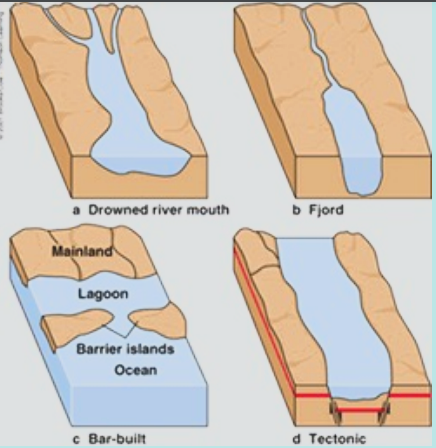
Four major classes of Estuaries
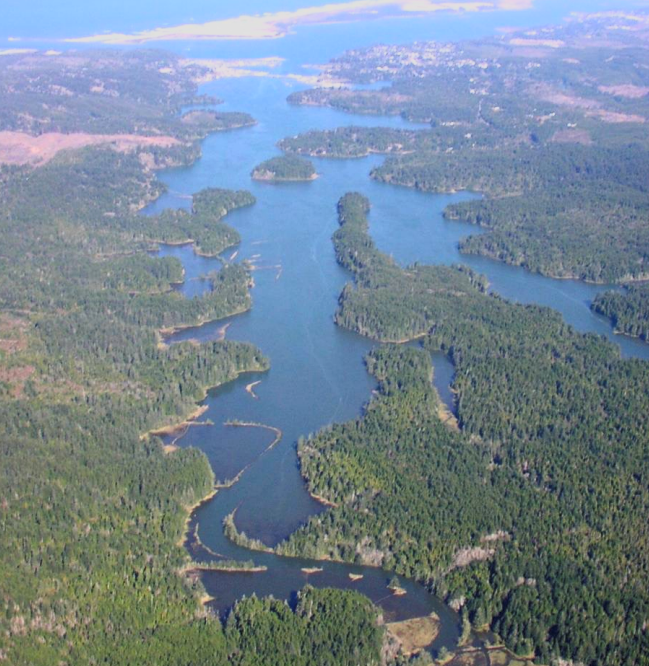
- *Coastal plain estuaries. These estuaries were formed at the end of the last ice age when rising seawater flooded (or "drowned") existing river valleys. The Chesapeake Bay is an example of this estuary.
- *Fjords. Fjords are glaciated, U-shaped valleys with steep walls. Usually, the glacial deposit pushed ahead by the advancing glaciers, creates a shallow sill near the ocean entrance. Fjords are common along Norwegian and Canadian coasts (Fig. 12-4)
- *Bar-built (or barrier island) estuaries. These most commonly are barrier islands that are separated from land by a shallow lagoon. They are formed by the creation of sand bars parallel with the shore, usually adjacent to slow flowing rivers that discharge freshwater into the coastal waters. Wave action plays a pivotal roll in the creation of these sand bars, but their existence also may be caused by some chemical interactions between the salt water and the fresh water that aid in the bonding (flocculation) of fine particles in the water that then fall to the seafloor. The Outer Banks of NC are an example of this estuary.
- *Tectonic estuaries. These are caused by earthquakes, where folding or faulting may create bays with narrow inlets to the sea. San Francisco Bay is an example of this estuary.
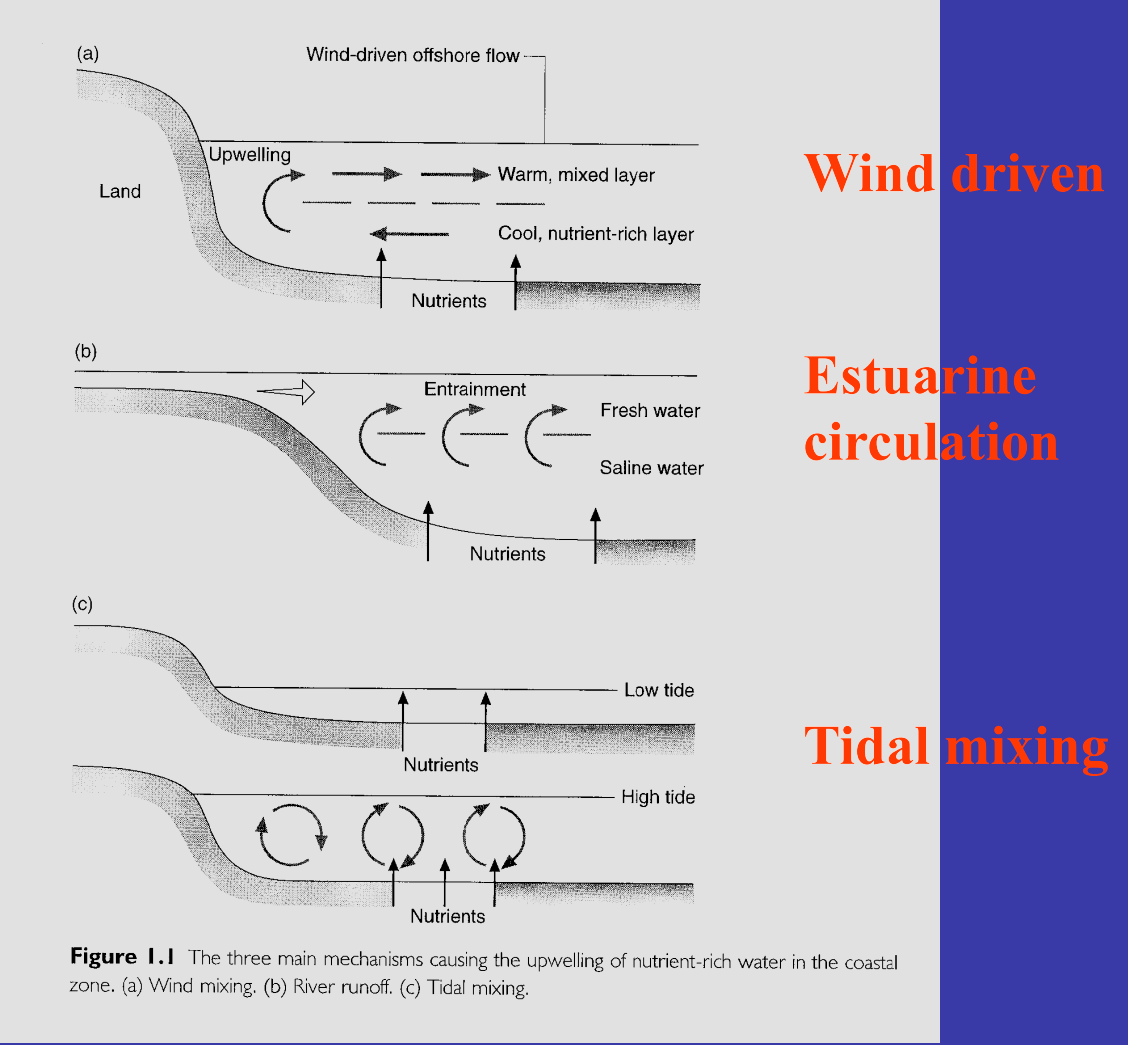
Estuarine Circulation
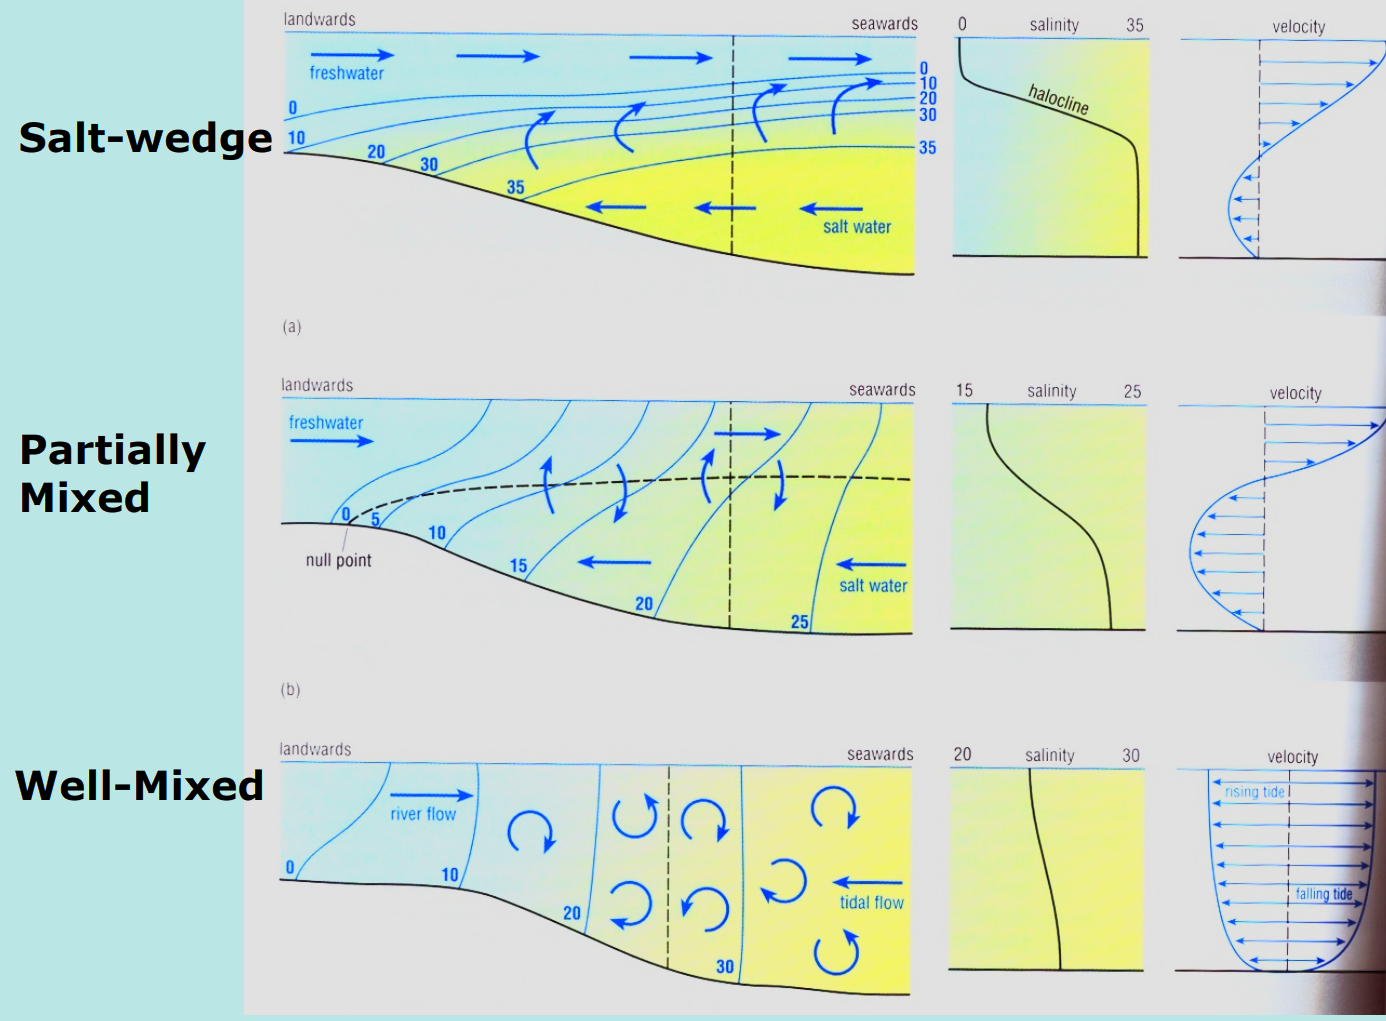
- Driving forces of circulation: Wind-driven, tidal mixing, estuarine circulation(salt water goes under freshwater and pushes it out away from land when salt water rises)
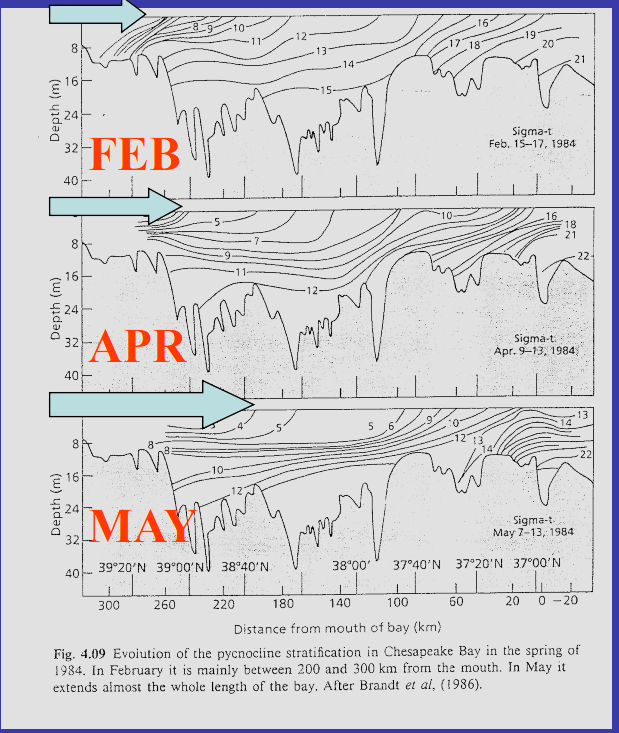
Estuarine circulation:
1. Freshwater Runoff
- a. runoff greater than tides
- strongly stratified(May)
- b. tides greater than runoff
- weakly stratified
- The balance may change seasonally, as shown in the figure.
- a. runoff greater than tides
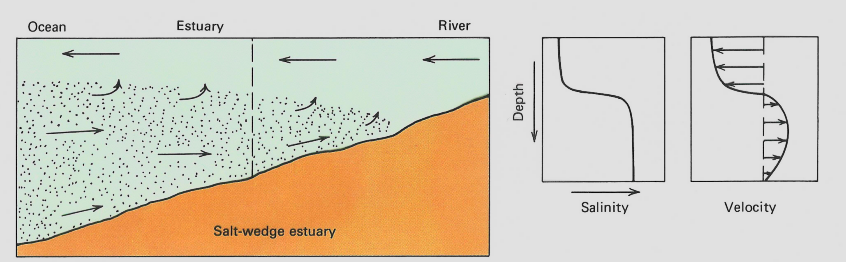
2. Interactions between Buoyancy and Mixing
- Salt-wedge, partially mixed, well-mixed
Estuarine Turbidity Maximum (ETM)
- 96% striped bass eggs and 59% of white perch larvae located up-estuary of front
- ETM is an important nursery area as these species use transport and retention within ETM
- Retention within ETM may place larvae in a zone of increased zooplankton biomass and production
Requirements for Photosynthesis in Estuaries
- Light (turbidity must be low so light can penetrate the water column)
- Time in estuary (where nutrients are high; governed by winds or circulation)
- Nutrients
- Source of bioavailable N (usually NH4+ or NO3-)
- Source of dissolved phosphate
- If by diatoms, need dissolved silicate
Characteristics of estuaries
- Most estuaries:
- strong tidal forcing
- large density difference between river and ocean
- complex topography
- Long and narrow – can often be approximated by 2-dimensional vertical/along-axis flow (relatively little across axis flow)
- Mathematically we have equations for salt, mass (volume) and momentum
- significant forces: friction (mixing), pressure, nonlinearity, acceleration (time variability)
- typically small: wind, Coriolis, longer that tidal period coastal sea level (tides are important)
- most common dynamic balance is between pressure and friction/mixing
- Mixing affects the salt balance …
- … which affects the pressure distribution and pressure gradient
- Can classify estuaries based on their physics (relative magnitude of different terms), or topography/geomorphology
Physics essentials
- Fresh river water encounters salty ocean water
- Fresh = light; salty = heavy
- Freshwater flows seaward at the surface
- Get landward flow of more dense, salty, water
- estuarine or gravitational or baroclinic circulation
- time scales of ~1 day … so Coriolis force is usually of secondary importance
- circulation is evident averaged over a few tidal cycles
- mixing and entrainment processes are central to details of the salt and volume transport balance
Bar-built and Lagoon Estuaries
- Drowned river valleys with high sedimentation rates
- Very shallow
- Often branch toward mouth into a system of shallow waterways (lagoons)
- Narrow connections to the ocean
- Sediment accumulates at mouth contributing to bar formation
- Shallow lagoons can be well-mixed by tides and winds
- Complex topography: channels, island and shoals
- Multiple sources of freshwater
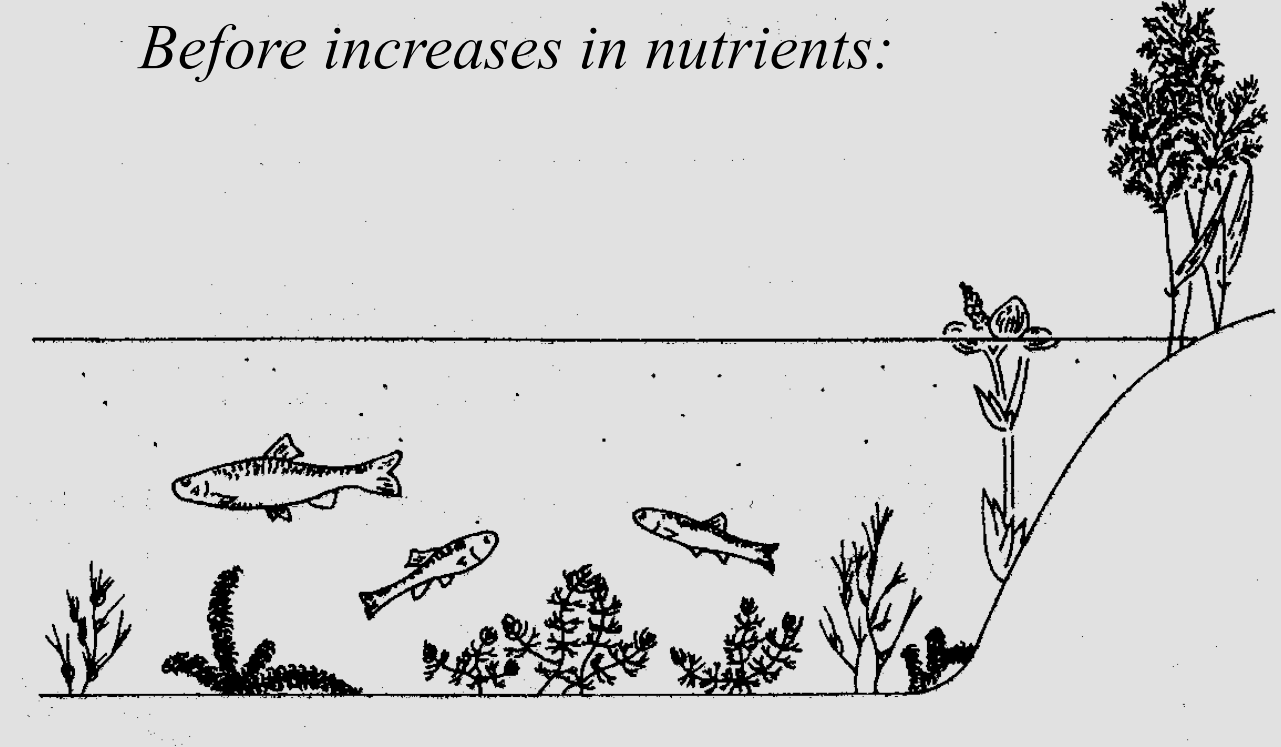
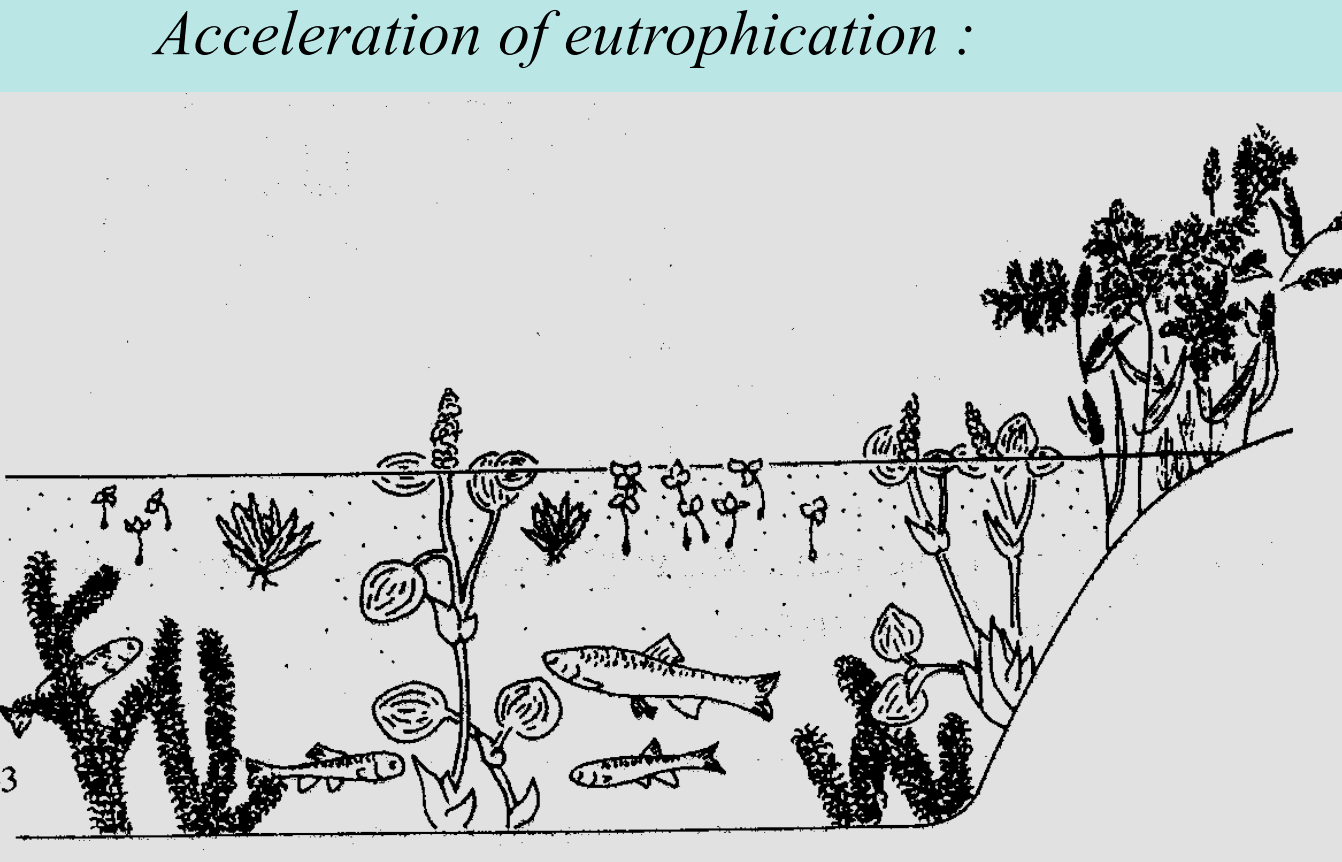
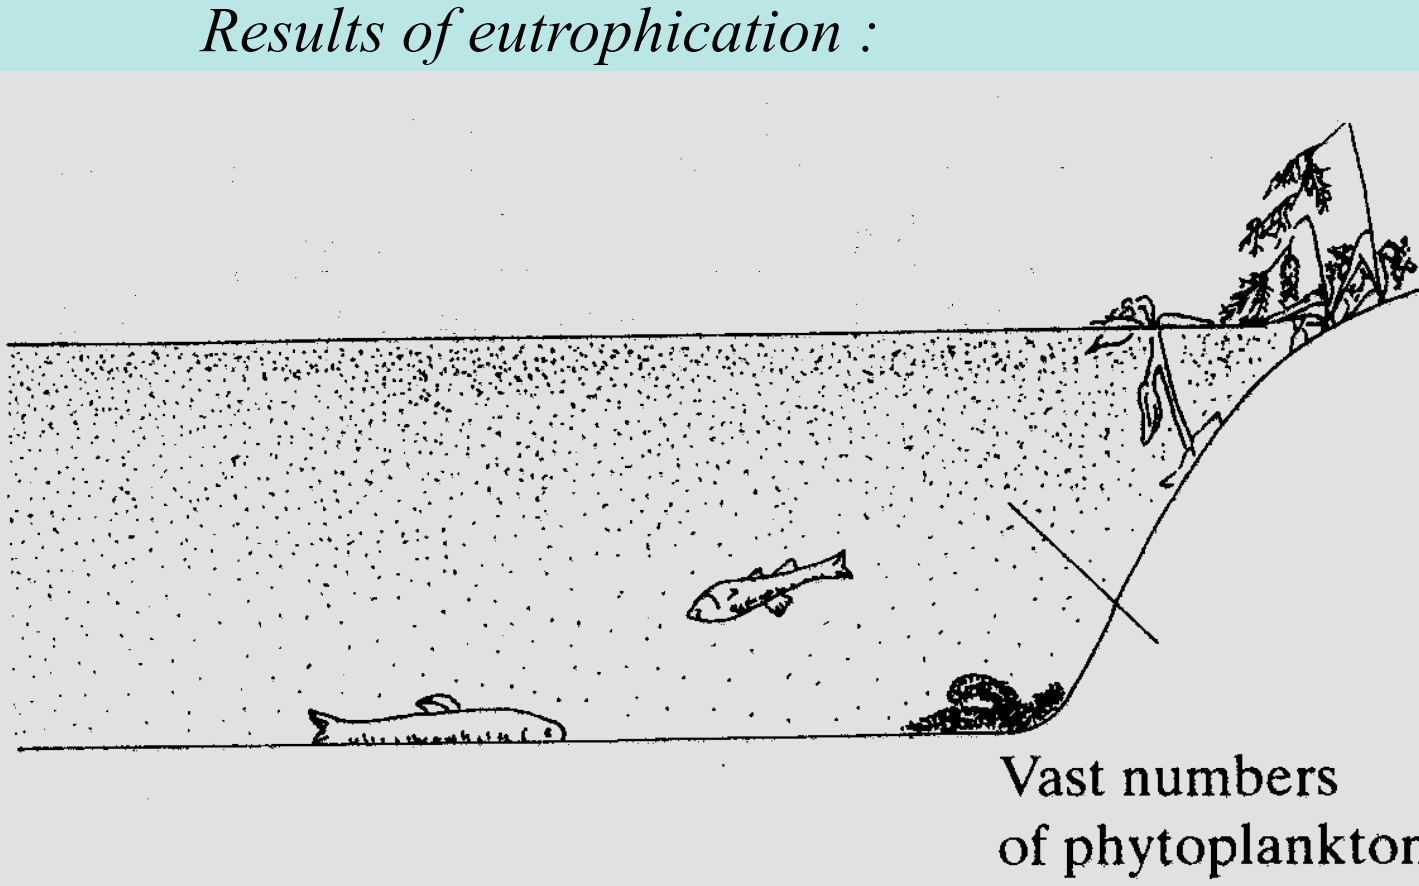
Eutrophication
- When lakes, streams and estuaries are over fertilized, excessive production of aquatic organic matter can become a water quality problem and as a result the eutrophication process can be enhanced!
- Humans in their everyday activities can exacerbate the process:
Point sources (can locate the cause)
- Sewage treatment plant discharges
- Storm sewer discharges
- Industrial discharges
Non-point sources (can’t locate the cause, it’s everywhere)
- Atmospheric deposition
- Agricultural runoff (fertilizer, soil erosion)
- Septic systems
- Eutrophication: a process by which a body of water progresses from its origin to its extinction. This process happens in stages.
Six stages of eutrophication:
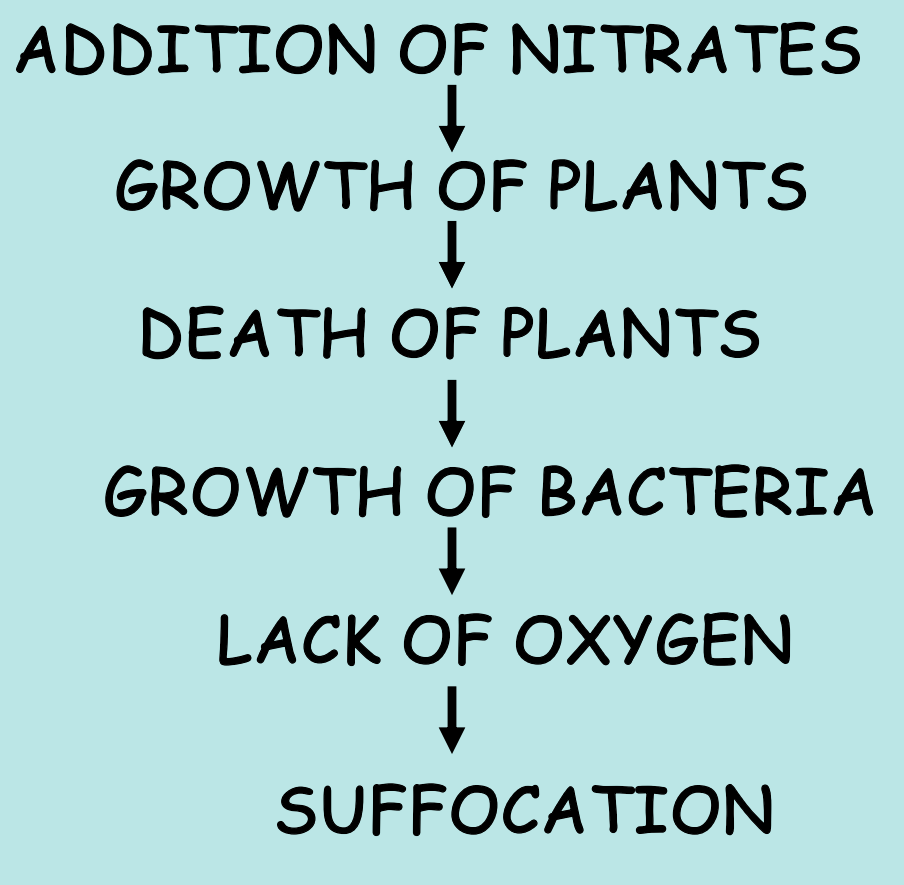
Biochemical Oxygen Demand (BOD)
- This measures the rate of oxygen consumption by a sample of water, and therefore gives a good indication of eutrophication. A high BOD means lots of organic material and aerobic microbes, i.e. eutrophication.
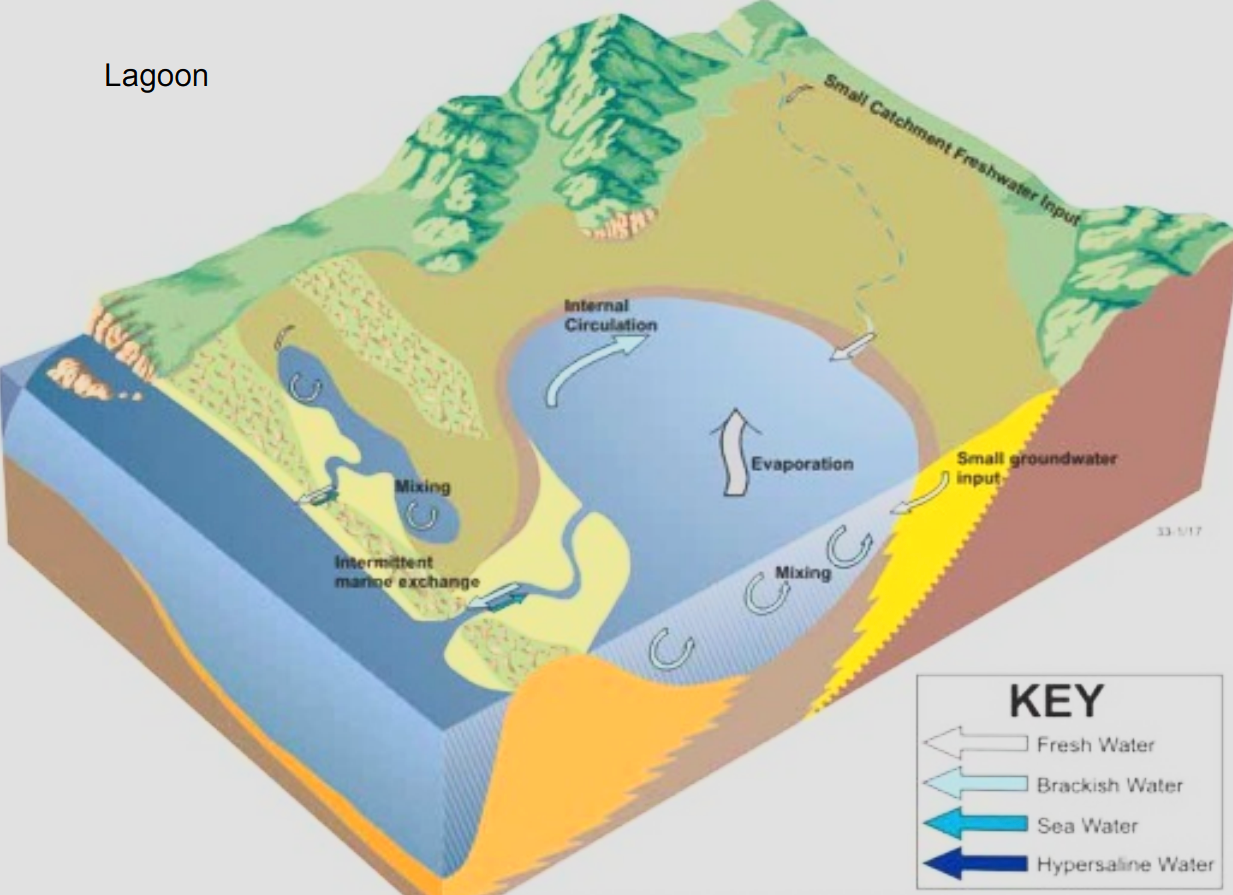
- Coastal lagoons are shallow water bodies separated from the ocean by a barrier, connected at least intermittently to the ocean by one or more restricted inlets, and usually oriented shore-parallel.
- Usually connected to the open ocean by inlets between barrier islands.
- Coastal lagoons form along gently sloping coasts where barrier islands or reefs can develop off-shore.
- Coastal lagoons do not form along speed or rocky coasts, or if the range of tides is more than meters.
- Coastal lagoons are shallow and are sensitive to changes in sea level and global warming.
- The difference between lagoons and estuaries is that lagoons have little or no interchange with the open ocean or with fresh water and high evaporation rates.
- Some lagoons can be entirely fresh if they have no connection to the open ocean and more freshwater input.
- Lagoons are very vulnerable to global, natural and societal changes
- In particular:
- Erosion-deposition
- Sea-level change
- Changes in the water and biogeochemical cycles
- Human settlement and exploitation of natural resources
Chapter 10- Sea Level Change (not ppt on moodle)
- *Within past 800,000 years CO2 concentrations fluctuate between 180 ppm and 280 ppm
- Warm period (interglacial)= higher CO2
- Ice age (glacial)= lower CO2
- Last Ice age ~20,000 years ago
- Currently in interglacial period
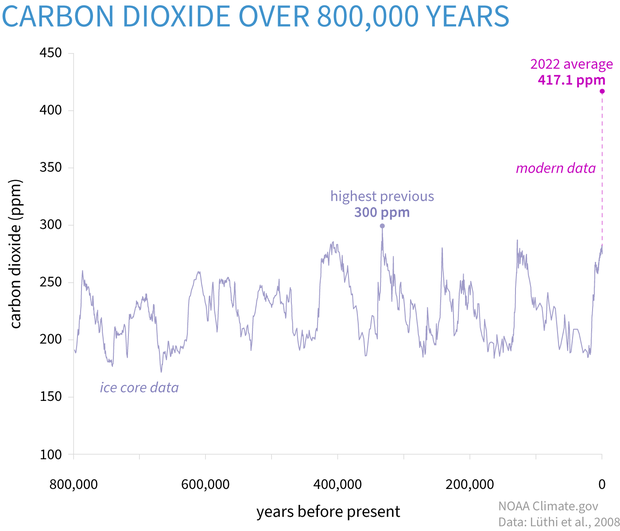
- Since 1910, CO2 concentrations have risen exponentially to over 400 ppm
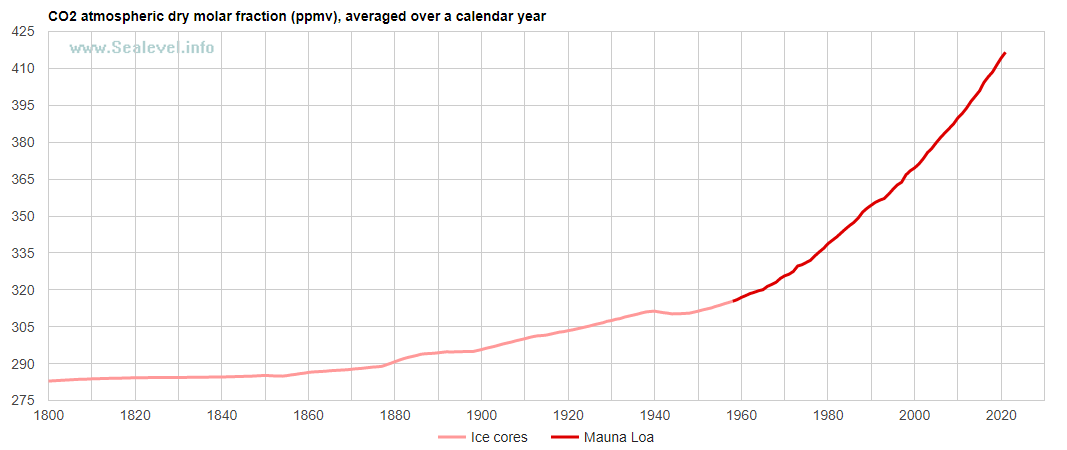
- Increase in CO2 and Methane levels have caused global warming which has caused melting of glaciers and large bodies of ice which cause a rise in sea level
Start of Moodle Slides
Causes of Sea-Level Change
- Thermal expansion
- Land based ice -
- Greenland
- Antarctica
- Glaciers and icecaps
- Changes in permafrost
- Effect of sediment deposition
- Long-term adjustment of icesheets
- Tectonic—changing the size and shape of ocean basins
- Local and regional changes
- Eustatic tectonic changes
- Volcanic eruption along the plate boundaries
- Local coastal uplift
- Subsidence
Halocline Rise in Sea-Level
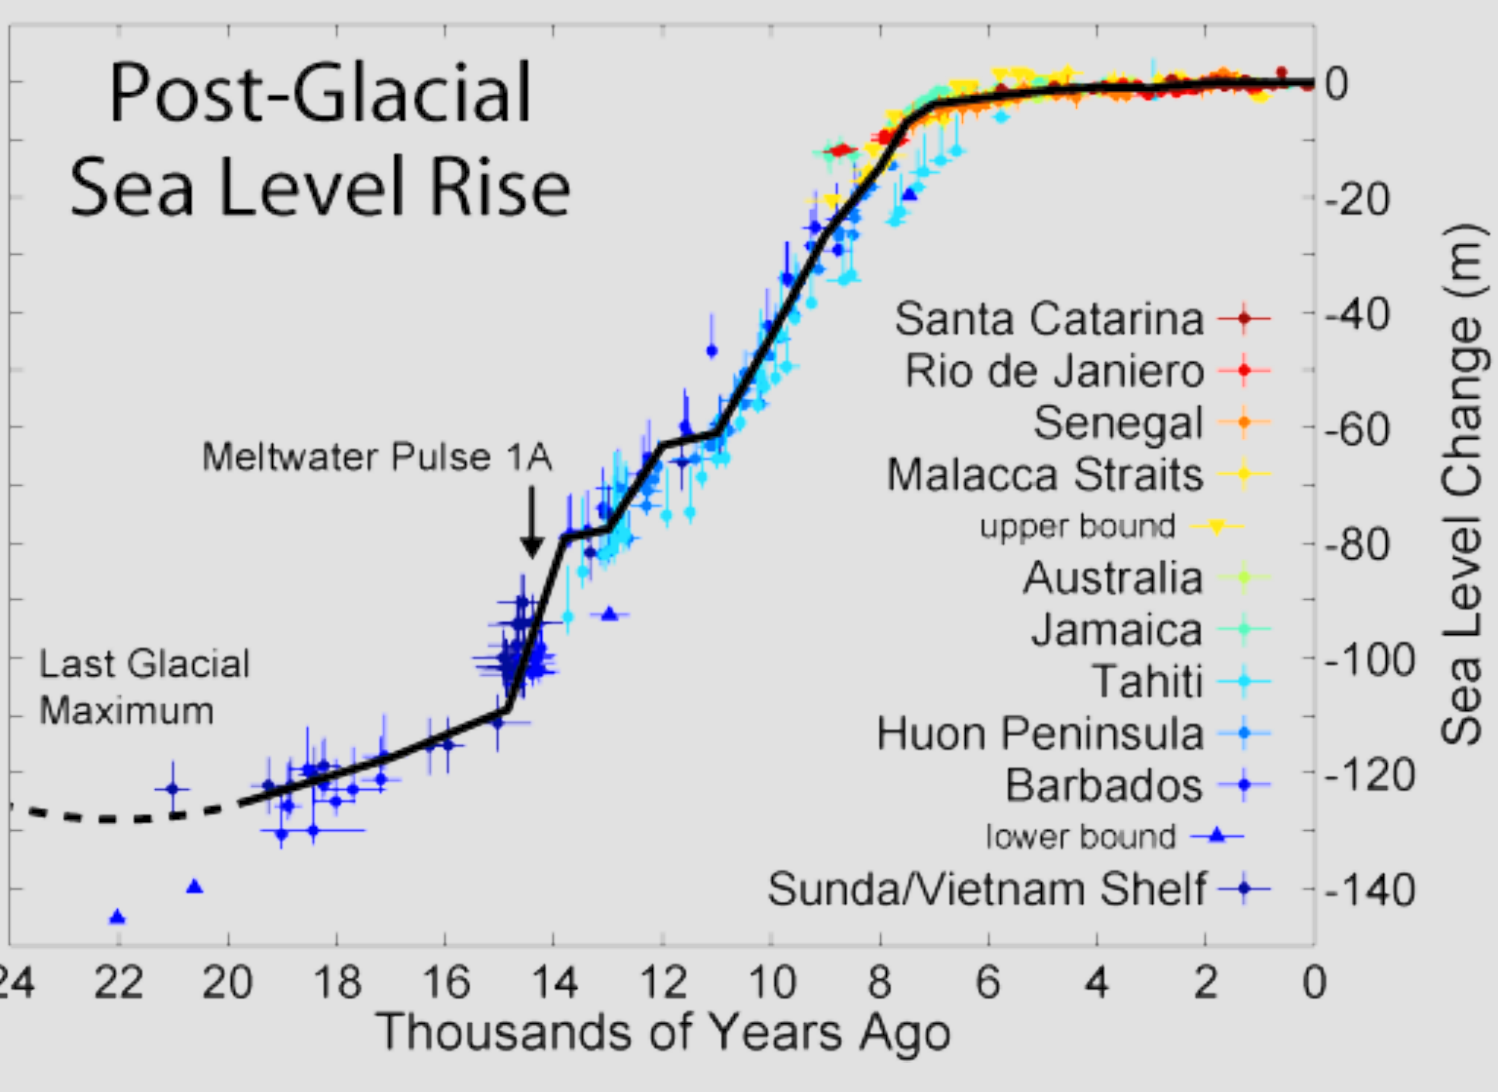
- Sea level was at its lowest position about 18,000 yrs ago at Last Glacial Maximum
- The lowest position of sea level is called the lowstand.
- Sea Level reached its present level at 6500-7000 years ago.
Chapter 11- Deltas
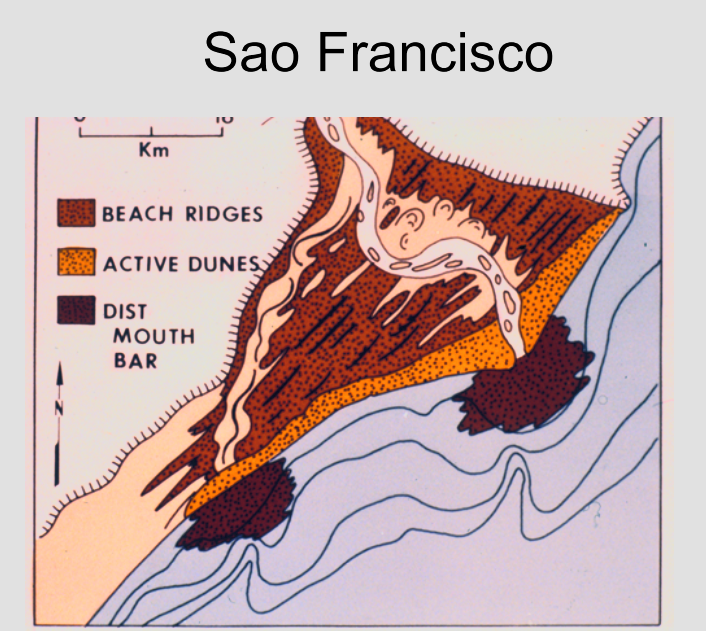
- Definition: A delta is a coastal accumulation of riverborne sediment extending both above and below sea-level close to a river mouth.
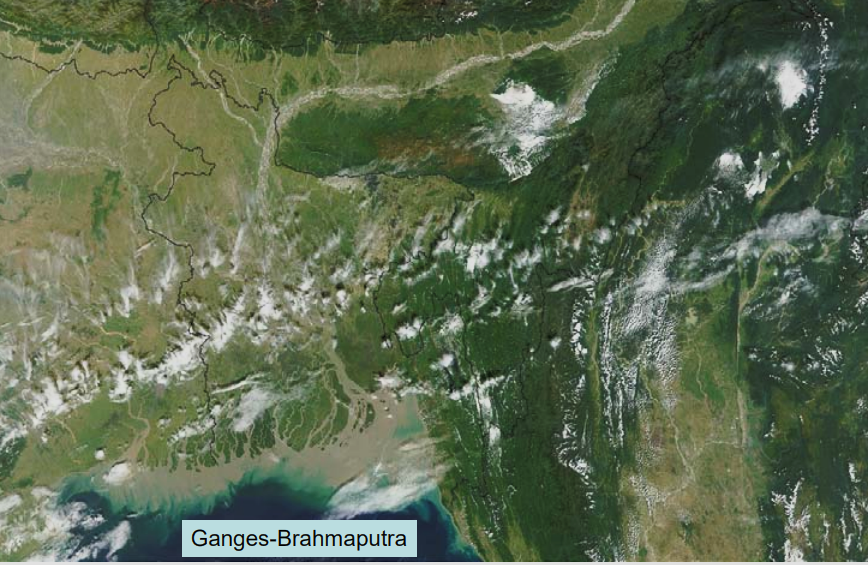
- Distribution of deltas
How do deltas develop?
- Discharge of sufficient sediment
- Geologic and bathymetric setting on the margin: have a place to accumulate the sediment and form a delta
- Plate tectonic history, regional geologic setting, and sea-level change: trailing edge or passive margins, not active margins, e.g. Mississippi & Amazon
- Marginal sea coasts: Yangtze, Yellow R. McKenzi, Rhone and Ebro
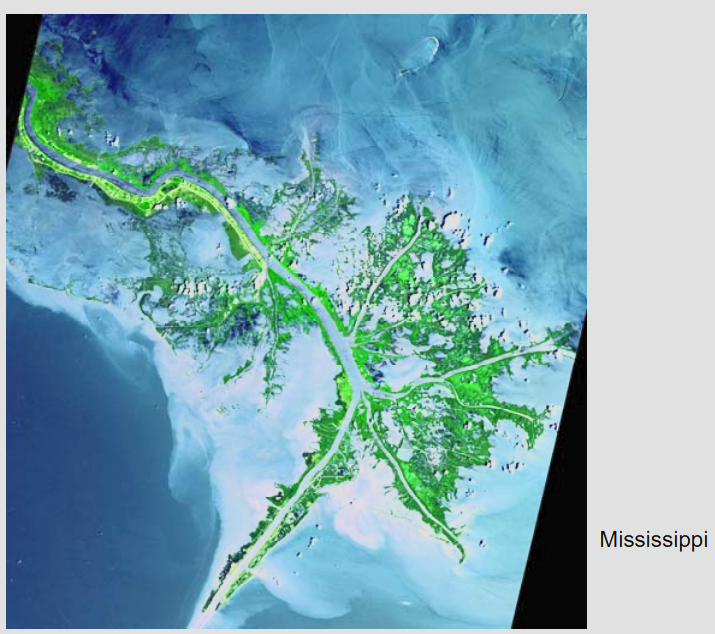
Mississippi River Basin
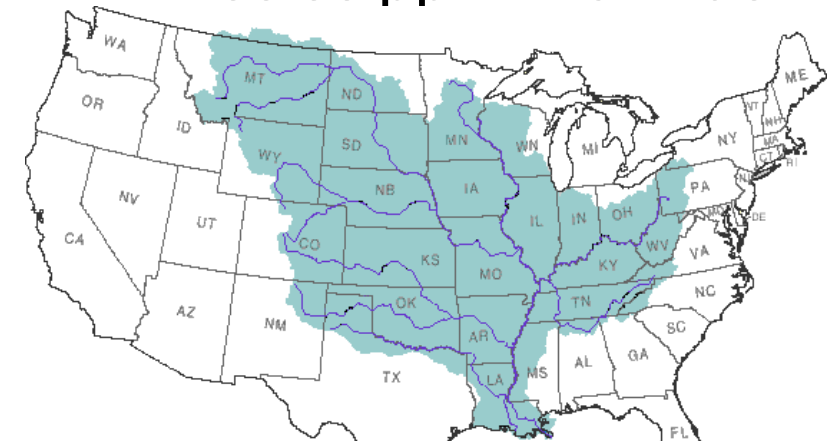
- Covers almost 50% of the mainland US
Amazon River Basin
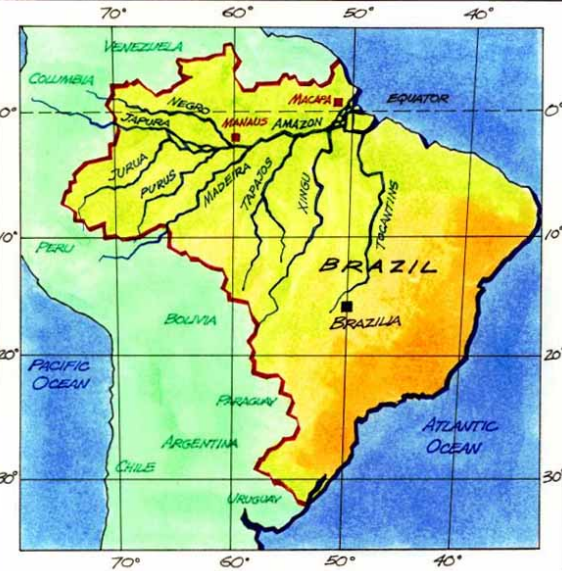
- The Amazon River flows from the Andean mountain range east across South America as an anastomosing river, with numerous fluvial islands and channel bars finally ending at the Atlantic Ocean.
Mackenzie River Basin
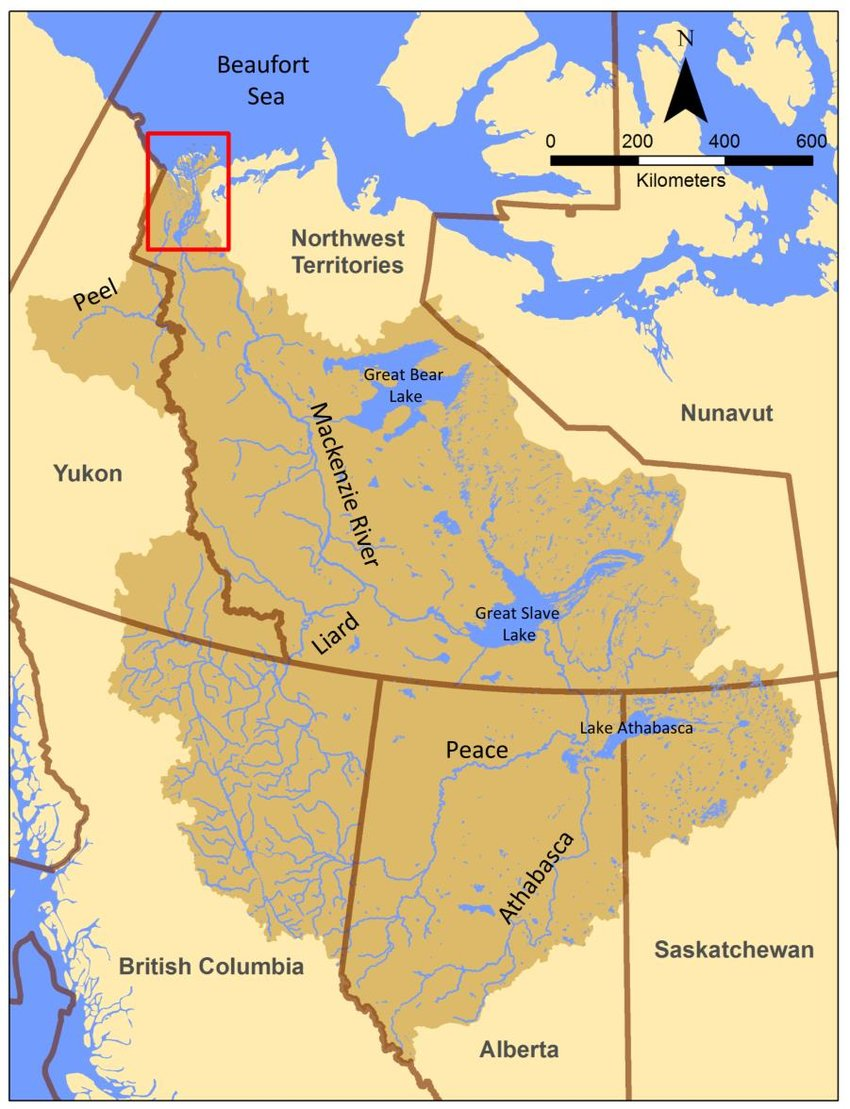
- Largest river basin in Canada
Why is there no Columbia River Delta?
- Because it is a smaller river than the Mississippi, absence of large drainage systems, thus it does not generate the amount of sediment that would be needed. Located at leading-edge, active margins, next to high relief, mountainous areas, no soils to be eroded.
- On leading edge/active margins, they are narrow and steep, lacking a proper site for sediment accumulation; many dams have been built which control the sediment flow along with the river, so no large amounts of sediments are being deposited where the river enters the ocean.
- In the case of the Columbia river, the large ocean waves and powerful currents quickly redistribute the material that is being deposited so it allows for no sediment to build up and form a delta rather it redistributes it.
Delta and Sea Level
- Mississippi river basin has changed position over time
- *Most deltas on Earth were formed around 6000-8000 years ago. This is because sea level decreased after the last interglacial period and the deltas only formed once the sea level change had stabilized in the last 6000-8000 years.
- *Ice sheet covering Canada during last interglacial maximum was ~3000 meters thick
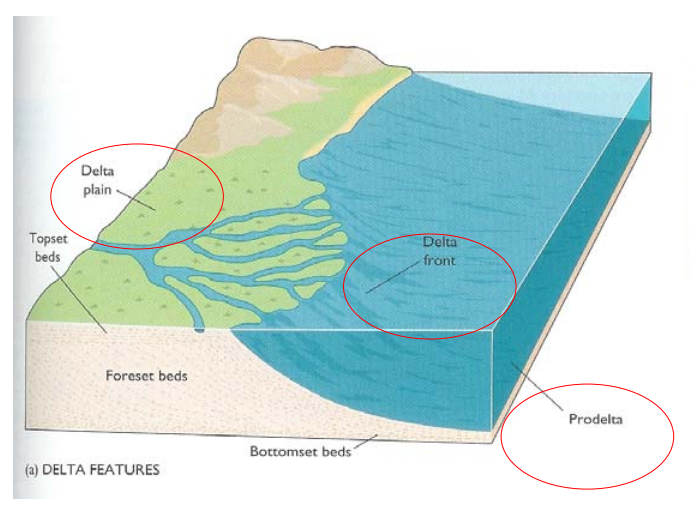
*circled features
Delta Plain
- Dominated by channels and their deposits and overbank environments (over flooding deposits)
- Distributary channels: point bars, oxbow lakes; meander channel…
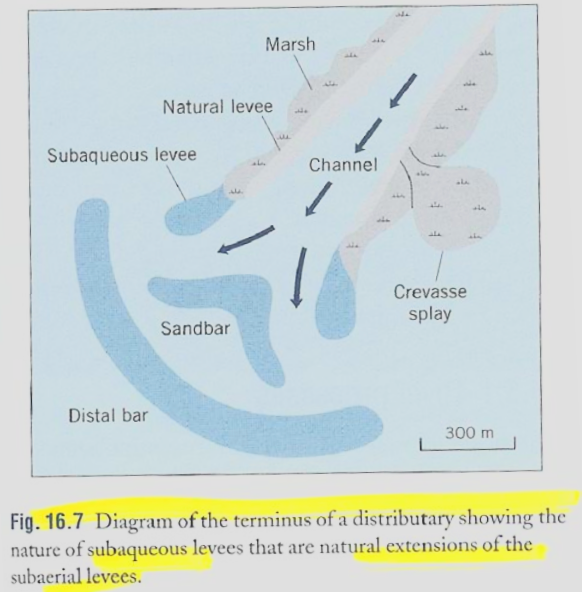
Natural levees
- Produced during flooding when river overtops its banks and immediately deposits Much of its sediment load!
River-Dominated Deltas
- High water and sediment discharge, with small waves and low tidal ranges;
- A broad gently sloping continental shelf;
- Trailing edge and marginal sea, tectonically stable coasts
Tide-Dominated Deltas
- Strong tidal currents
- Without substantial wave climate and strong river influence
Wave-Dominated Deltas
- Don’t really like a delta
- Relatively small
- Depends on longshore current patterns
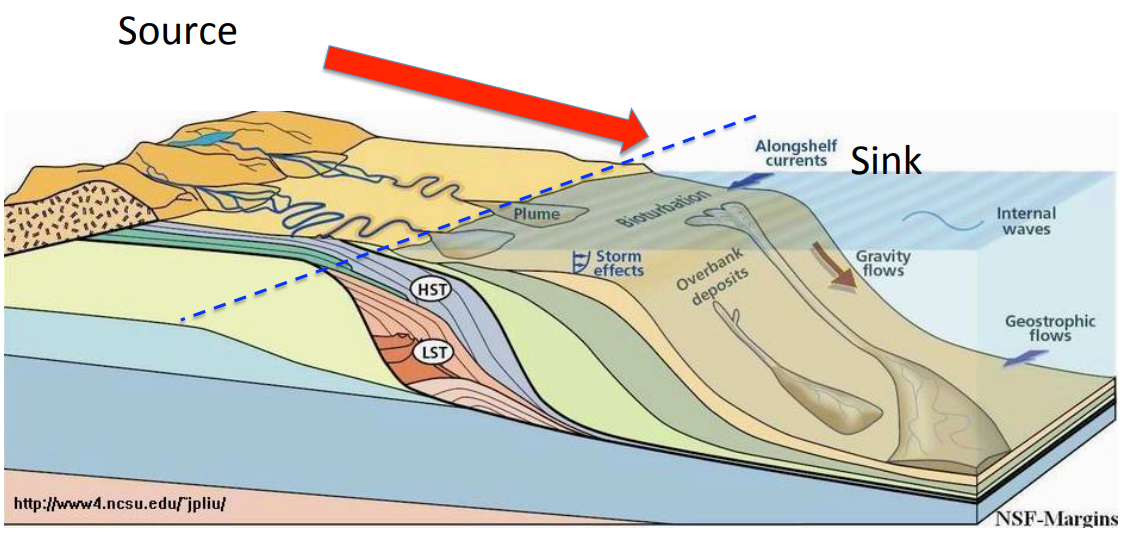
Fates of World Major River-Derived Sediments to the Sea
- Source to sink
- How much comes down? Flux
- Historical changes
- Natural vs human impacts
- Where do they go? Fate
- Cross-shelf vs longshore
Cross-Shelf Transport
Chapter 12- Tides
- Tide - The vertical rise and fall of the surface of a body of water caused primarily by the differences in gravitational attraction of the moon, and to a lesser extent of the sun, upon different parts of the earth.
- Wave has a higher frequency
- Tides have a lower frequency
- Newton’s Law of Universal Gravitation:
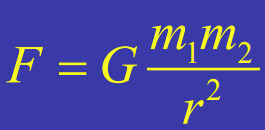
- Where the gravitational constant G = 6.67·10-11 N m2/kg2 and r is the distance between the objects with masses m1 and m2.
- Newton’s law of gravitation for the Solar System:
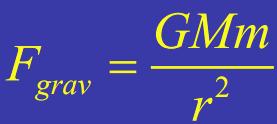
- M is the mass of the Sun, m is the mass of a planet (i.e., Earth), and r is the distance between them.
- The sun has 46% of the control on the tides compared to the moon.
- Tide producing force(Ft):

Centrifugal
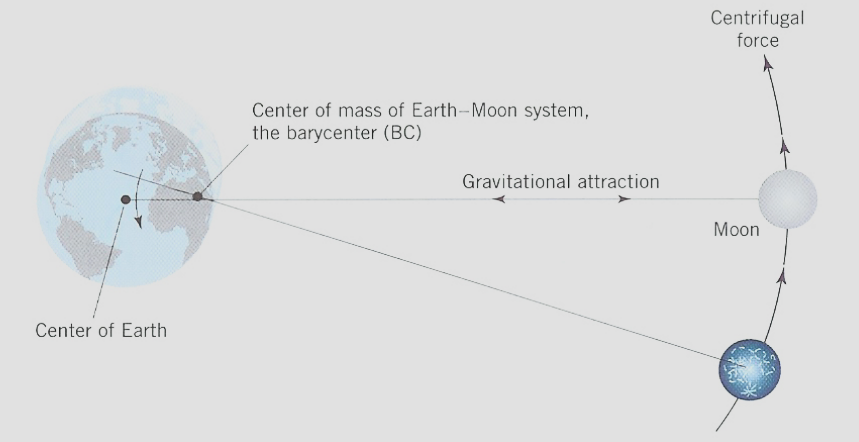
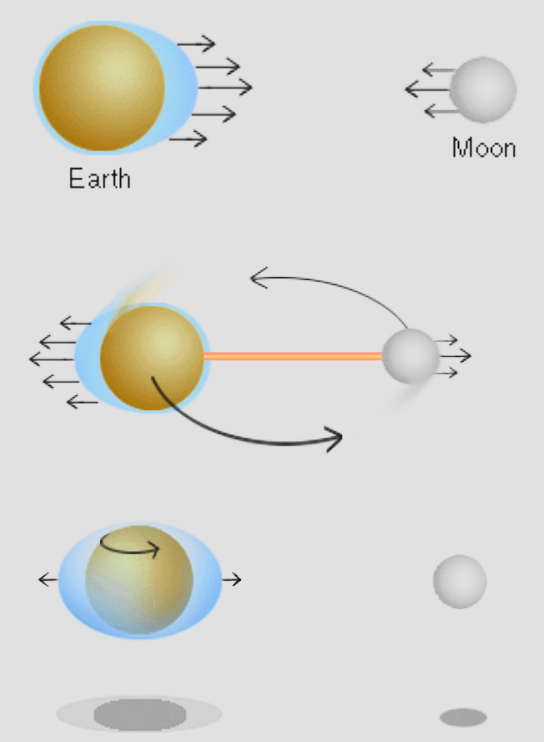
- Gravitational force causes water to bulge towards the moon
- Centrifugal force causes water to be bulge away from the center of mass of the earth-moon system when the earth-moon system rotates(middle picture)
- These two forces combined cause the bottom photo, a bulge of water on both sides of earth
Tidal Cycle
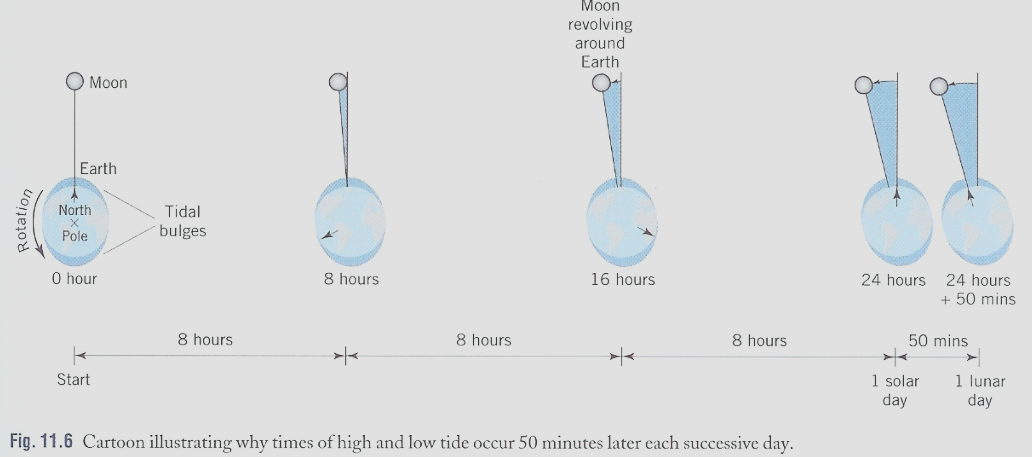
- *Moon’s period: 27.3 days. Every 24 hour, Moon has traveled 13.2o
- After 24 hours, the moon has moved so the same spot on the earth would not be facing the moon exactly. This is why high tide in the same location occurs 50 minutes later each day, because it takes 50 minutes for the earth to rotate and catch up with the 13.2o that the moon has moved from its initial position at the beginning of the 24 hours
- Due to
- 1) Highly variable basin geometries
- 2) Modification of tidal wave, and other factors
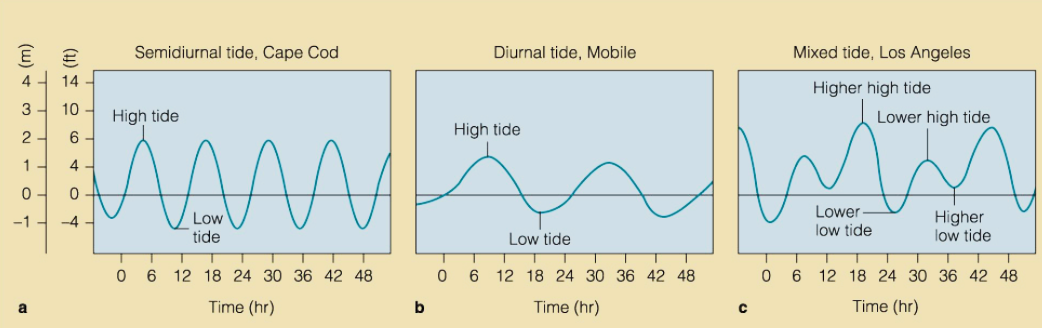
- Semi-diurnal tides: two tidal cycles daily with a period 12 hours 25 minutes. Common in majority of the world
- Diurnal tides: one tidal cycle daily, with a single high and low tide, period: 24hrs, 50min
- Mix: during a lunar cycle: a small semi-diurnal inequality and a very pronounced one
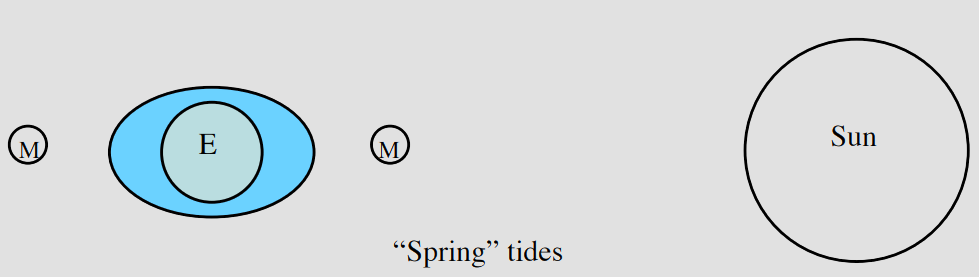
Spring Tides
- The tidal effects of the sun and the moon act in concert twice a month. Once near the time of the new moon when the moon is on the same side of the earth as the sun, and again near the time of the full moon, when it is at the opposite side of the earth from the sun. Tides at these times are abnormally high and unusually low.
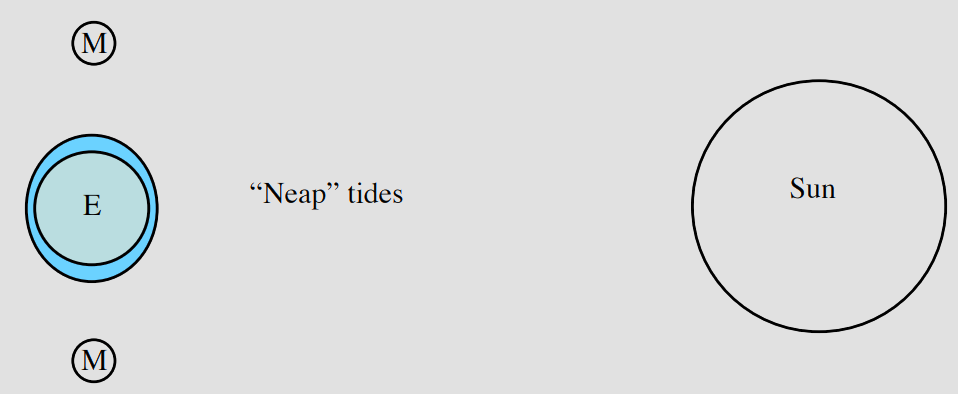
Neap Tides
- The tidal effects of the sun and the moon are in opposition to one another when the moon is at quadrature - the first and last quarter - at which times the moon is located at right angles to the earth-sun line. At these times, high tides are lower and low tides are higher than usual.
Tidal Terminology
- Sounding datum - An arbitrary reference plane to which both heights of tides and water depths expressed as soundings are referenced on a chart.
- High tide or high water - The highest level normally attained by an ascending tide during a given tide cycle.
- Height expressed in feet or meters relative to the sounding datum.
- Low tide or low water - The lowest level usually attained by a descending tide during a tide cycle.
- Height is expressed in feet or meters relative to the sounding datum.
Tidal Datum: References Planes
- Coriolis force- tendency of objects(wind, water) to move to the right in the northern hemisphere and to the left in the southern hemisphere. This causes ekman transport
- Standard reference planes are necessary in order to make measurements used by the navigator meaningful.
- In general, heights and elevations are given on a chart with reference to a standard high-water reference plane, and heights of tide and charted depths are given with respect to a standard low-water reference plane.
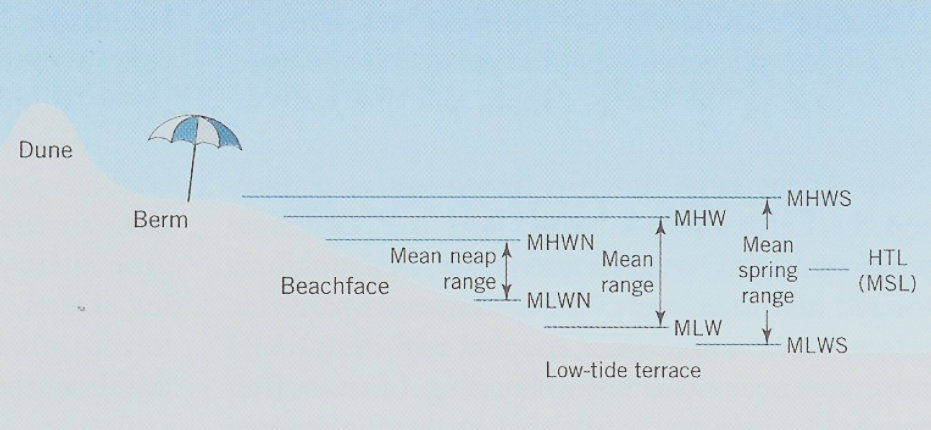
- Mean High Water Springs (MHWS)
- Average height of all spring tide high-water levels
- Mean Higher High Water (MHHW)
- The average of the higher of the high-water levels each tidal day at a
- Mean High Water (MHW)
- Average of all high-tide water levels, 19-year period
- The high-water reference plane used on most charts produced by the United States for the basis of the measurement of heights, elevations, and bridge clearances
- Mean High Water Neaps (MHWN)
- Average recorded height of all neap tide high-water levels
- Mean Low Water Neaps (MLWN)
- Average recorded height of the all neap tide low-water water levels
- Mean Low Water (MLW)
- Average height of all low-tide water levels, 19-year period
- Mean Lower Low Water (MLLW)
- Average of the lower of the low-water levels each tidal day, 19-year period
- The low-water reference plane used for charts of the U.S. Pacific, U.S. Atlantic, and Gulf coasts as a basis for measurement of charted depth and height of tide
- Mean Low Water Springs (MLWS)
- Average of all spring tide low-water levels
- The sounding depth on which most water
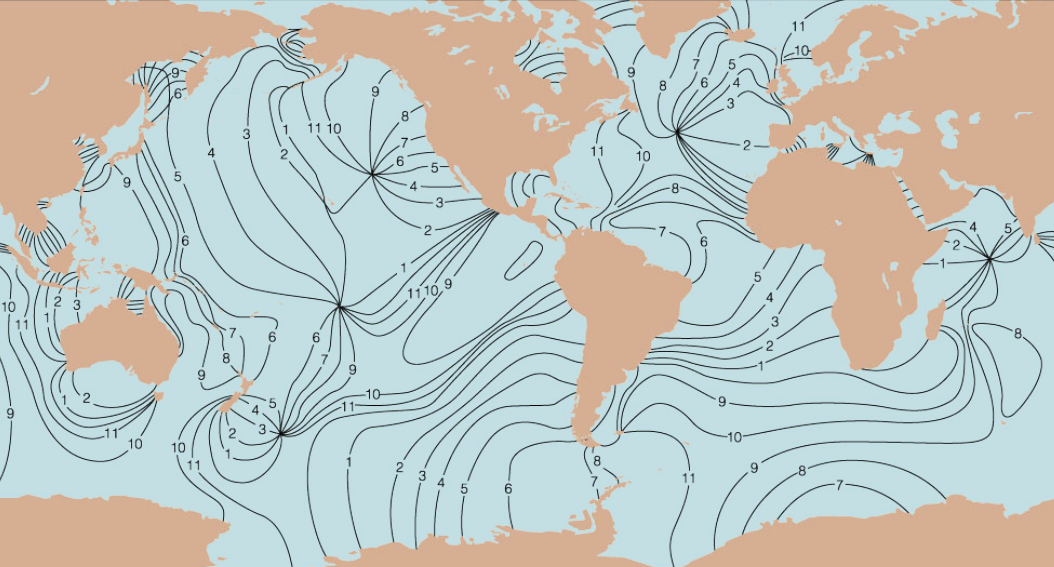
An amphidromic point
- An amphidromic point is a point within a tidal system where the tidal range is almost zero, and around which the tidal crest rotates through one tidal cycle.
- Amphidromic points occur because of resonance within oceanic basins and bays creating a standing wave pattern which rotates around the amphidromic (nodal) point. At the amphidromic point, there is almost no vertical movement, but further away there may be magnified tidal range, such as in the Bay of Fundy in Nova Scotia, Canada, where resonance between the tidal frequency and the natural frequency of the bay create extreme tides of up to 15 meters at its northernmost extremity.
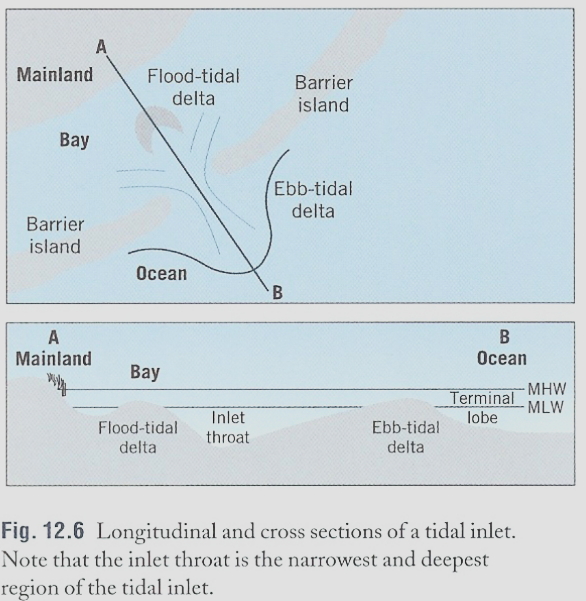
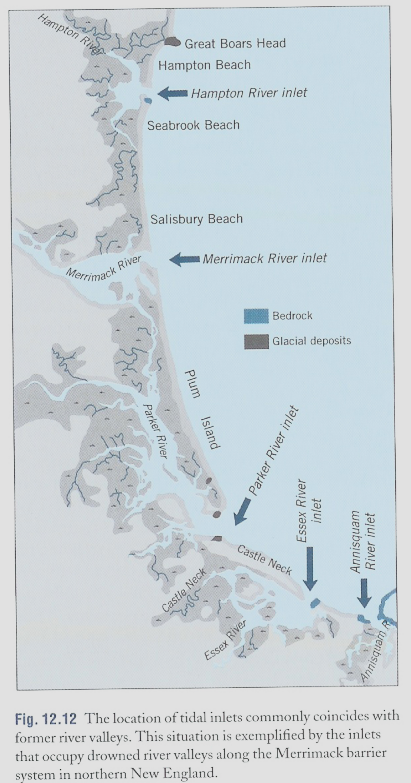
Chapter 13- Tidal Inlets
- Definition:
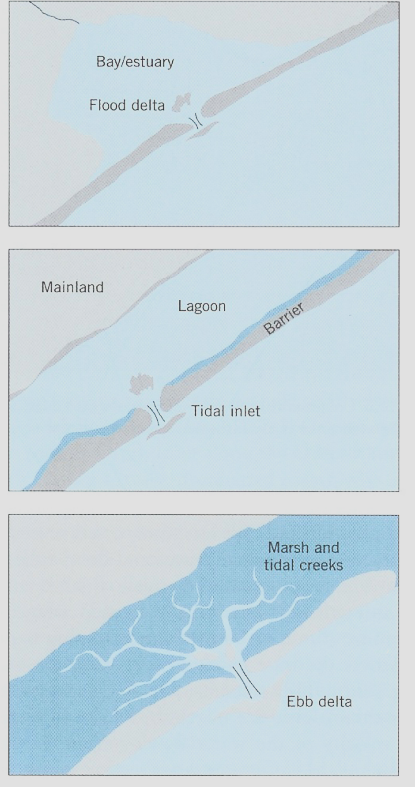
- Tidal inlets are the openings along barrier shorelines.
- They allow the exchange of tidal waters between the ocean and backbarrier, which consists of bays, lagoons, and marsh and tidal creeks.
- They are fronted by ebb-tidal deltas and backed by flood-tidal deltas.
- Tidal channels or passageways alone are not “tidal inlets”, they must have:
- 1) Tidal current, and 2) Occur along sandy or sand and gravel barrier coastlines
- Due to the rise and fall of the tides:
- 1. During rising tide, the water level of the ocean rises at a faster rate than that inside the inlet.
- The land water flowing water is called a Flood-tidal current
- 2. During the falling tide, the water level Of the ocean drops ahead of that of the Bay inside the inlet.
- The seaward sloping water surface Produces ebb-tidal currents.
- 1. During rising tide, the water level of the ocean rises at a faster rate than that inside the inlet.
Tidal Prism
- The total volume of water moving past a fixed cross section of the estuary during each flood tide or ebb tide is referred to as the tidal prism.
- The larger the tidal range within the estuary and the greater the dimensions of the estuary, the larger the tidal prism.
- On average, the ebb and flood tidal prisms are equal
Inlet morphology
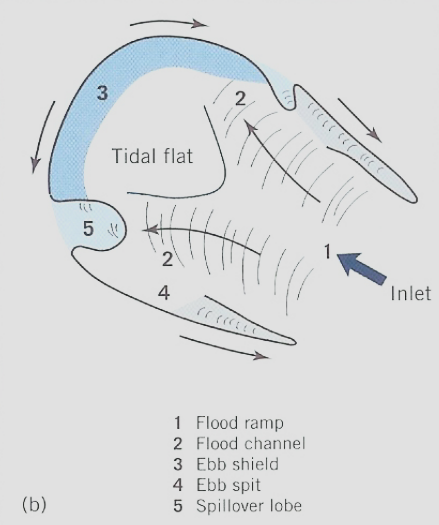
Flood-Tidal Deltas
- A flood tidal delta is an accumulation of sand on the shoreward side of an inlet. These deltas are initially formed during storm surges and maintained by flood currents.
- Flood tidal deltas become stabilized when salt marshes establish on them.
- Salt-marsh grasses cause the land to be built up to hightide level and new land is added to the island
- In mesotidal systems, flood tidal deltas transform into marshland causing the inlet to migrate to a new position. New tidal deltas are created along the entire area of inlet migration
- The presence or absence, size, and development of flood-tidal deltas are related to a region’s tidal range, wave energy, sediment supply, and backbarrier setting
- Model of flood-tide delta
- 1. Flood ramp: dominated by strong flood-tidal currents and landward sand transport;
- 2. Flood channel: dominated by flood-tidal currents and flood-oriented sand waves.
- 3. Ebb shield: the highest and most landward part of the flood delta, maybe covered by marsh vegetation -> protects the delta
- 4. Ebb spits: extend from ebb shield
- 5. Spillover lobes: formed by ebb current
Ebb-Tidal Deltas
- An ebb tidal delta is an accumulation of sand on the seaward side of an inlet formed by the ebb tidal current.
- Weak tidal currents relative to wave activity inhibits the formation of ebb tidal deltas along microtidal coasts. Macrotidal coasts typically lack shore-parallel barriers, hence inlets and their deltas.
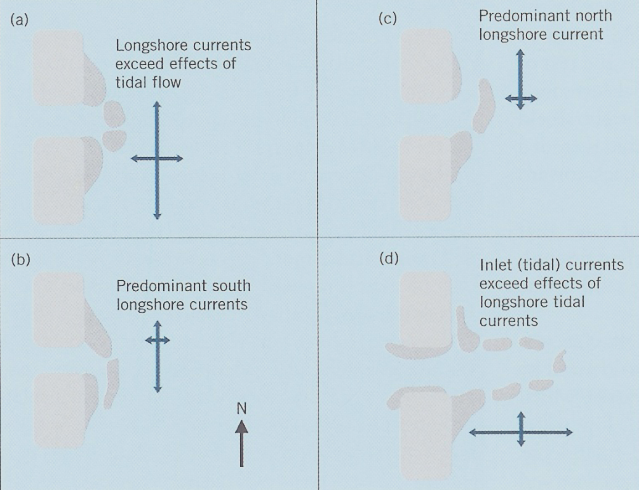
- Ebb tidal deltas most commonly occur in front of mesotidal (or mixed energy) inlets where they interact with waves and longshore drift. Barriers are often drumstick-shaped with down drift offsets. Think: Why?
- The length (degree of protrusion) of an ebb tidal delta reflects the relative strengths of tidal flow and longshore current. The asymmetry, or lean, of the delta is determined by the direction of longshore transport.
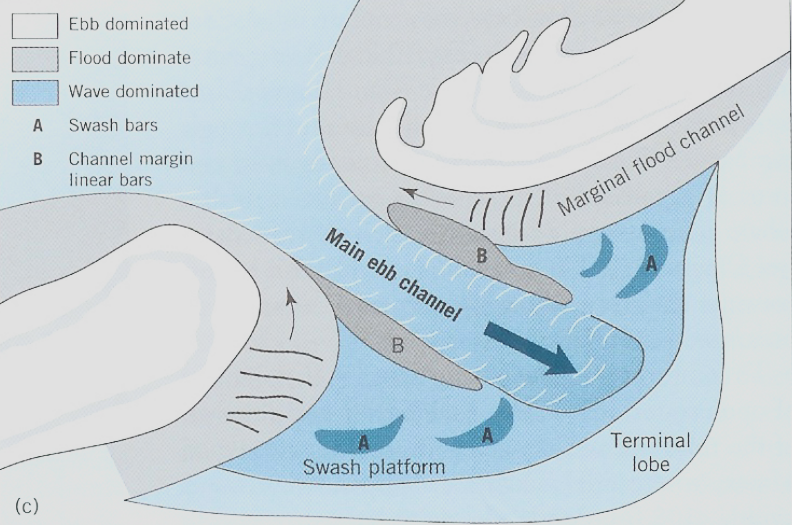
- Model of ebb-tidal delta
- 1. Main ebb channel: seaward-shallowing channel, dominated by ebb-tidal currents
- 2. Terminal lobe: deposits of ebb currents transported sand, well defined by breaking waves
- 3. Swash platform: on both sides of main ebb channel, a broad shallow sand
- 4. Channel margin linear bars: border the main ebb channel, sit atop the swash platform.
- 5. Swash bar: on swash platform, waves breaking over the terminal lobe.
- 6. Marginal-flood channels: shallow channel, dominated by flood-tidal current.
Ebb-tidal delta morphology
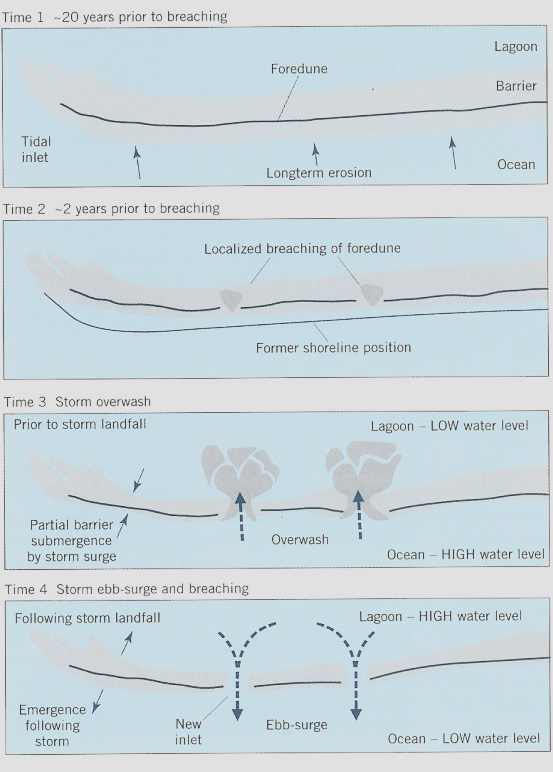
Tidal Inlet Formation
- Requires the presence of an embayment and the development of barriers
1. Breaching
- a. Occur during storms after waves have destroyed the foredune ridge and storm waves have overwashed the Barrier, depositing sand aprons along the backside of the barrier.
- b. In most cases, the breaching is the result of the storm surge heightening waters in the back barrier bay, when the level of ocean tidal falls, the elevated water flow across the barrier and cutting a channel.
2. Spit building
3. Drowned river valleys
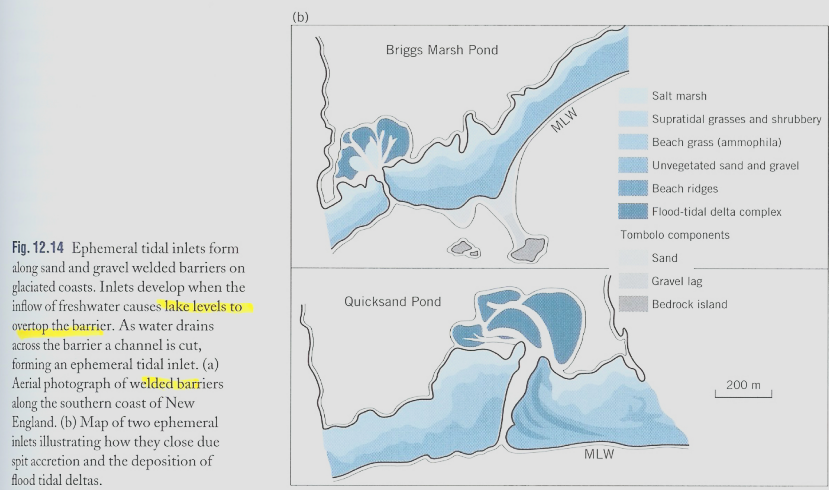
4. Ephemeral inlets
Chapter 14- Intertidal flats
- Intertidal mud flats are unvegetated, generally low gradient, and low energy environments consisting of poorly- to moderately- sorted sandy mud and muddy sand, around the margin of most coastal embayments and open coasts.
- Gravel may be present in moderate concentration at the base of shallow drainage channels, and coarser sediments typically occur closer to the low tide mark.
- Carbonate concentrations are moderate (reflecting shelly material in the sediments) and the concentration of organic material is variable, but generally high.
- Intertidal flats are wider and more extensive in macrotidal systems.
- Surfaces tend to occur from mean low water spring to mean high water spring elevations and are usually flat and not vegetated, but may be dissected by shallow (and often vegetated by saltmarsh species) drainage channels.
- Biological activity consists of both high and low tide visitors, as well as permanent
Morphology of Tidal flats
- Gently sloping and fairly broad surface of unconsolidated sediment.
- Alternately inundated and
- Different types of flats
- Wide, gently sloping tidal flats
- Narrow, steep tidal flats
- Tidal channels serve as the main pathways for tidal flux into and out of intertidal areas. Some can be several meters deep and contain significant water even at low tide.
Sediment
- Sand and mud with some scattered shells.
- The highest energy occurs at the base of the intertidal zone.
- Grain size decrease landward and upward across the intertidal flat, thus, the mud at the top and most landward.
Organisms
- Vagrant organisms such as snails, worms, and amphipods.
- Snails graze over tidal flats and ingest fine sediment, then digest the organic material that it contains and excrete the rest in the form of pellets.
Benthic Organisms
- Oysters, mussels
- Tend to occur in clusters, filter feeders, produce many pellets -> part of sediment
- Crabs
- Detritus feeders(dead organisms)
Algal Mats
- Algal or cyanobacterial mats that are composed of a network of filamentous organisms. These microscopic organisms are woven in a thin mat that can stabilize the upper part of the intertidal zone.
Bioturbation
- The disturbance of sedimentary deposits by living organisms
- Common in adjacent estuarine environments
- Ex: lugworm, Arenicola, which is a burrowing worm that can stir up sediment
Sedimentary Structures
- Ripples and megaripples, which are typical of tidal flats. These bedforms can migrate and change both orientation and direction with flooding.
- Mudcracks: result of significant exposure in high places on tidal flats. Between neap and spring high tide.
- Tidal channels. Caused by the transport of very large volumes of water during the tidal cycle.
- Neap conditions produce thinner layer than spring conditions in tidal bedding
Tidal Flat Processes
- Spring tides have much greater influence than neap tides on the tidal flat processes
Tidal Bundle
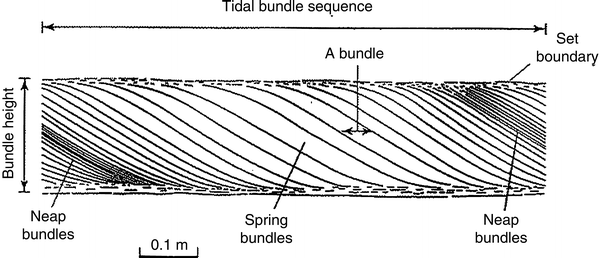
- Diagram of tidal bundles showing spring and neap cycles.
- Shows larger impact of spring tides
Tidal Drainage
- Tidal flats have small drainage channels that are carved out by the water which drain the water back to the estuary
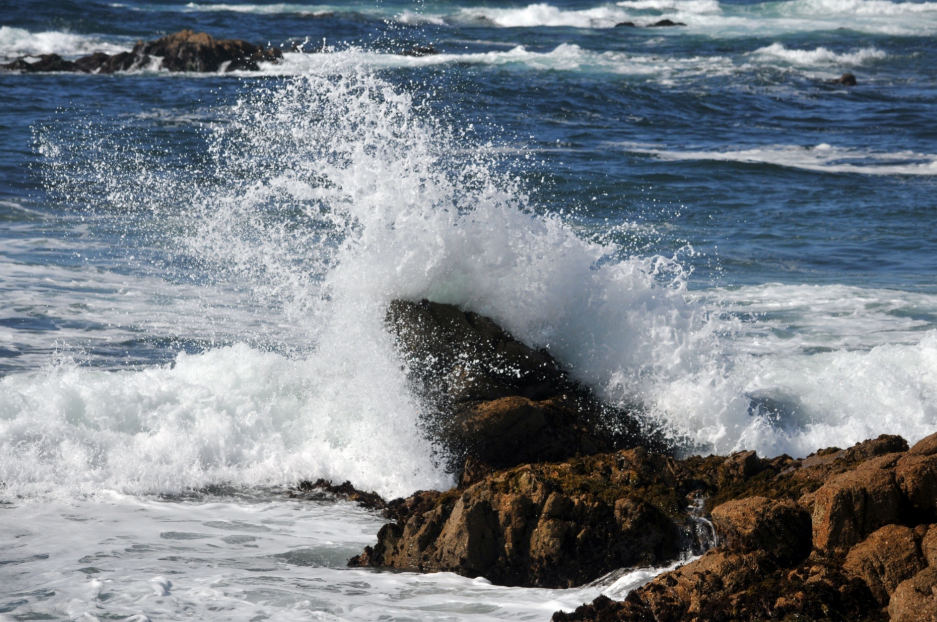
Chapter 15- Rocky Coasts
- High wave activity
Types and Distribution
- 75% of the world’s shorelines are rocky!
- More common along tectonically active coasts than on passive margins;
- West coasts of North/South America,
- Also along the passive margin: south Africa, Argentina and Brazil, eastern Canada, South Australia, and northwest Europe.
- Lack of sediment;
- Erosion
- Mountainous regions and glaciated areas
Tectonic Controls
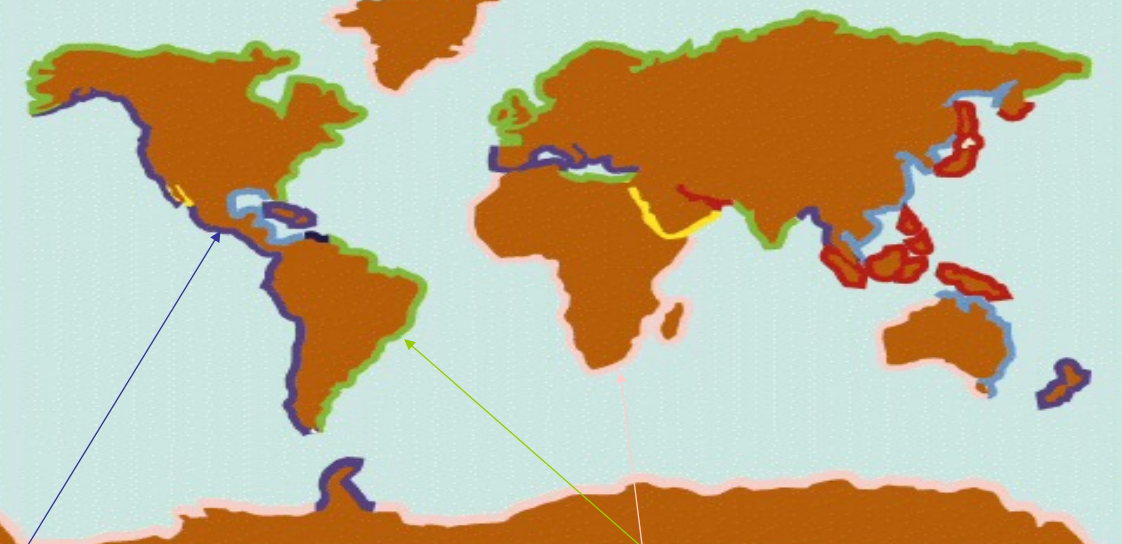
- 1. Collision/Active Coast
- Blue-Continental, Red-Island Arc
- 2. Trailing Edge Coast
- Yellow-Neo-trailing, Pink-Afro-trailing, Green-Amero-trailing
- 3. Light Blue-Marginal Sea Coast
Active/Convergence Margins
- High-relief, continental borderlands: Andes mountains along Peru and Chile or North American Cordillera;
- The high mountain chains act as dams and prevent larger rivers from delivering sediment to the coast.
- Only have small rivers with small watershed
- Waves tend to be large because of the deep and narrow margins and canyons.
- Young trailing edge are also rugged and mostly rocky– Red Sea
Rocky Coasts
- Characteristic of emergent coastlines
- Numerous features
- Central California
Bedrock Coasts
- Glaciated regions form bedrock coasts due to the large masses of ice sliding off land and creating a bedrock coast
- Volcanic island chains such as the Hawaiian islands form extensive rocky coasts. Rapid physical and chemical breakdown of volcanic rock and nearby coral reefs produces sediment that forms pocket beaches.
Beachrock
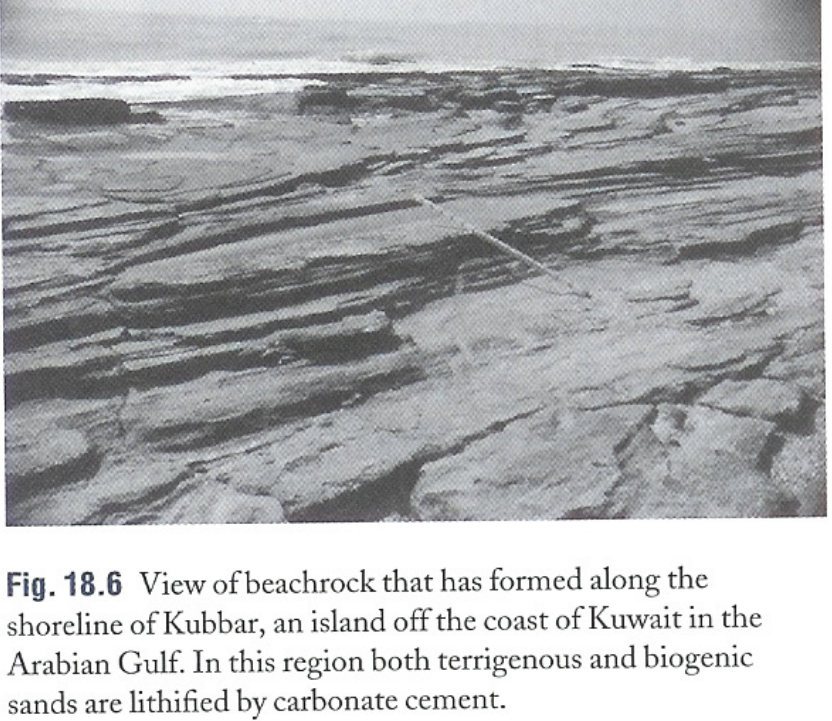
- High evaporation
Erosional Processes
- Unlike sandy shorelines, changes along rocky coast occur very slowly;
- It is the product of physical, chemical, and biological processes, over thousands years
- The rate is a function of rock type and its structure, wave intensity, vegetation, climate, and other factors
- Physical processes operate over a large scale and at a faster rate.
Physical Processes
Wave-induced erosion
- Wave hammer
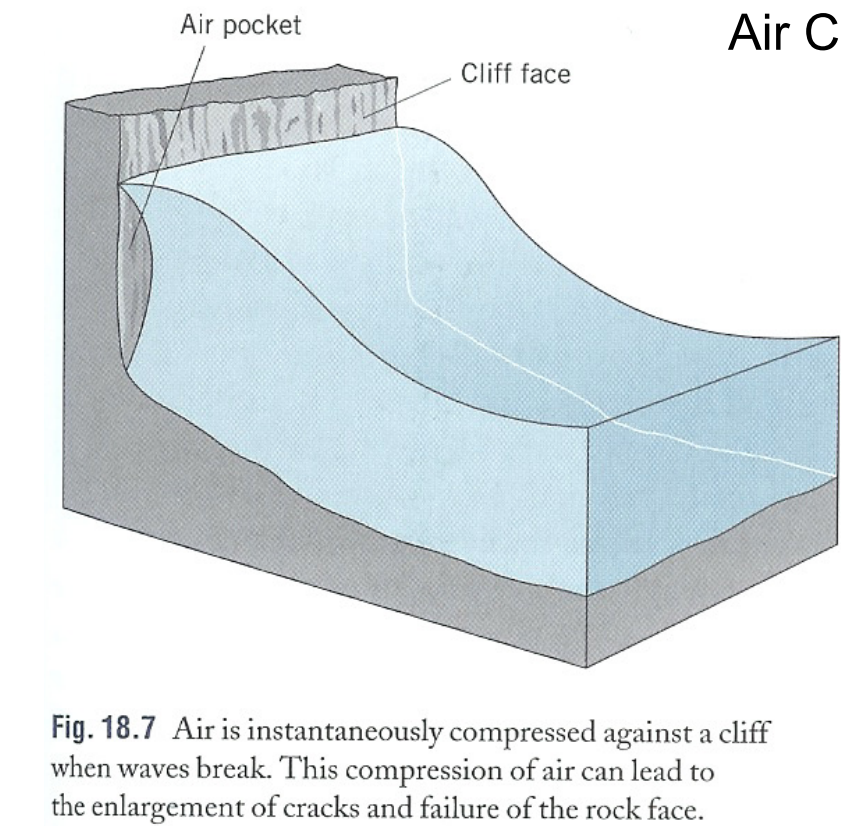
- Air compression
- Quarrying/Plucking
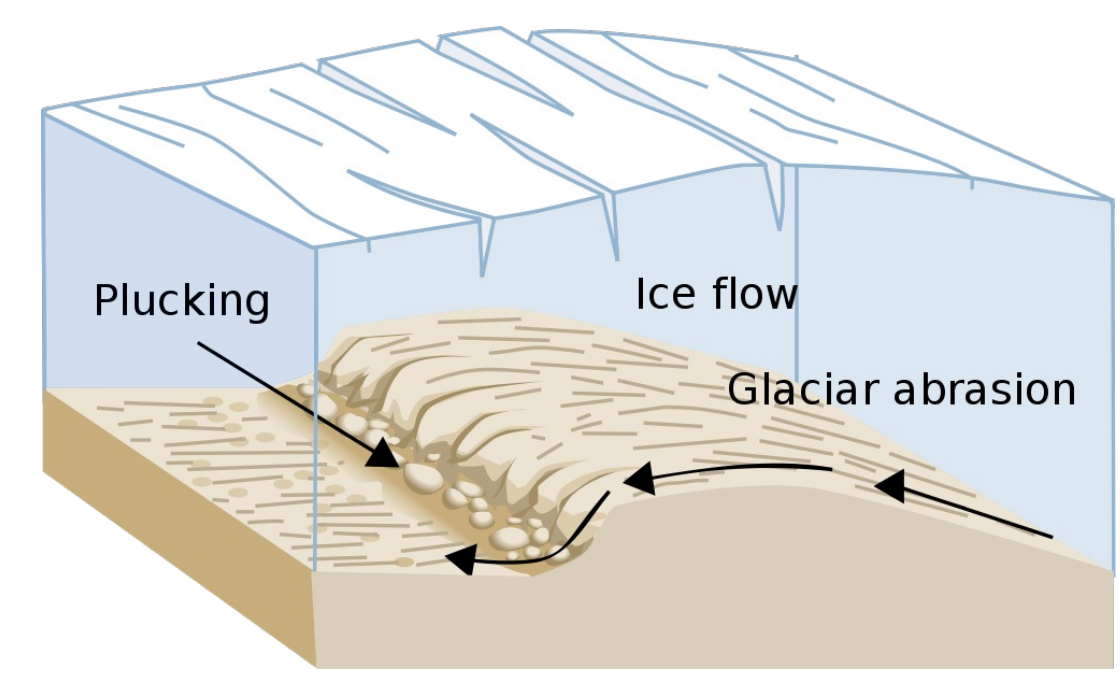
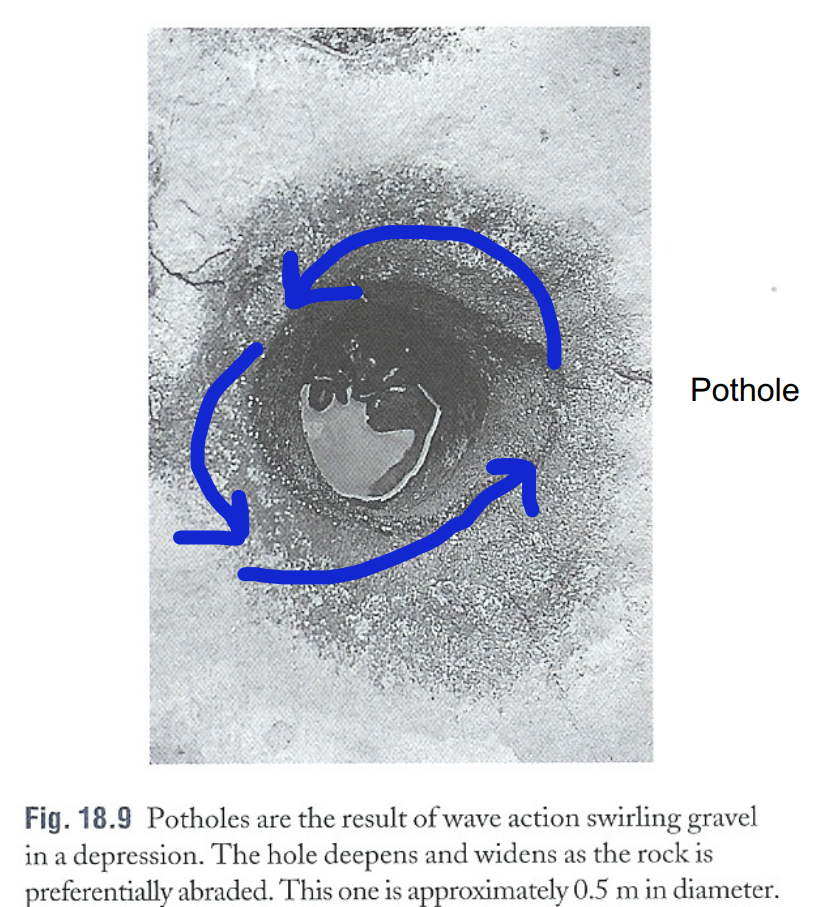
- Abrasion
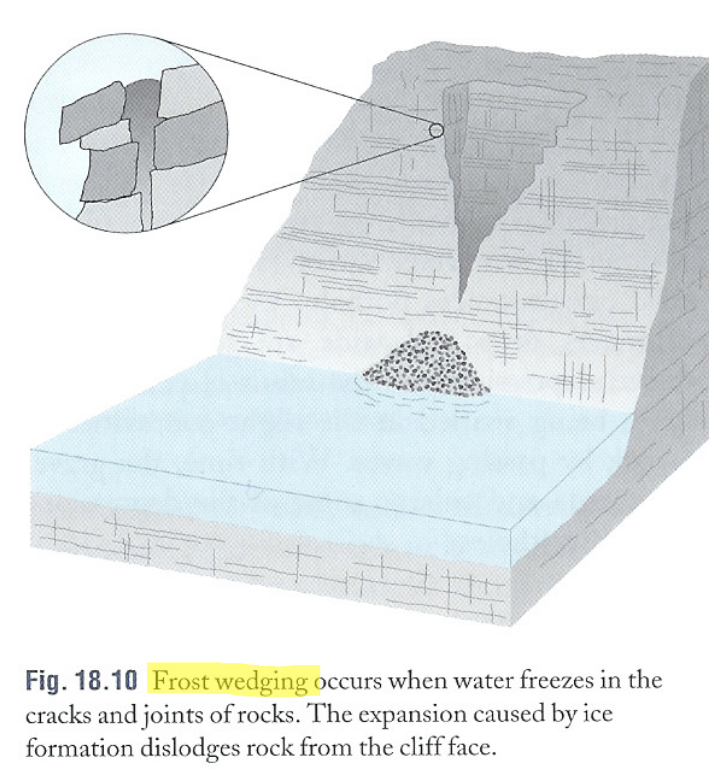
- Effects of Freeze and Thaw
Biological Processes
- Bio-eroders (blue-green algae) penetrate into rock
- Marine invertebrates (snail, limpets, sea urchins and chitons, etc)
Chemical Processes
- Very slow
- Varies with climate and rock type
- Acid Rain -> pollution
- pH changes in water
Factors affecting rates of erosion
- Rock type
- Degree of fracturing
- Wave energy
- Tidal range
- Climate
- Relative sea level
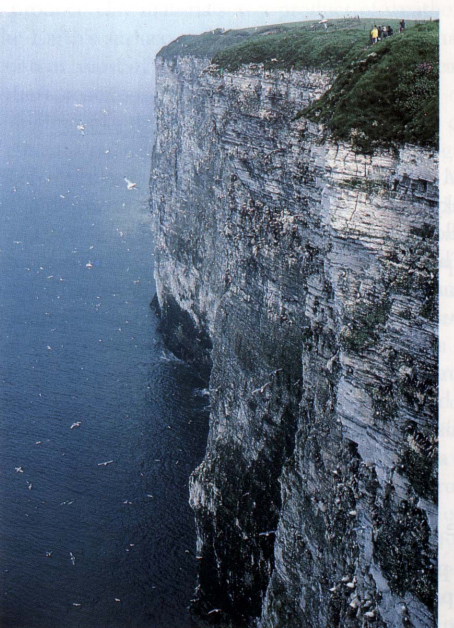
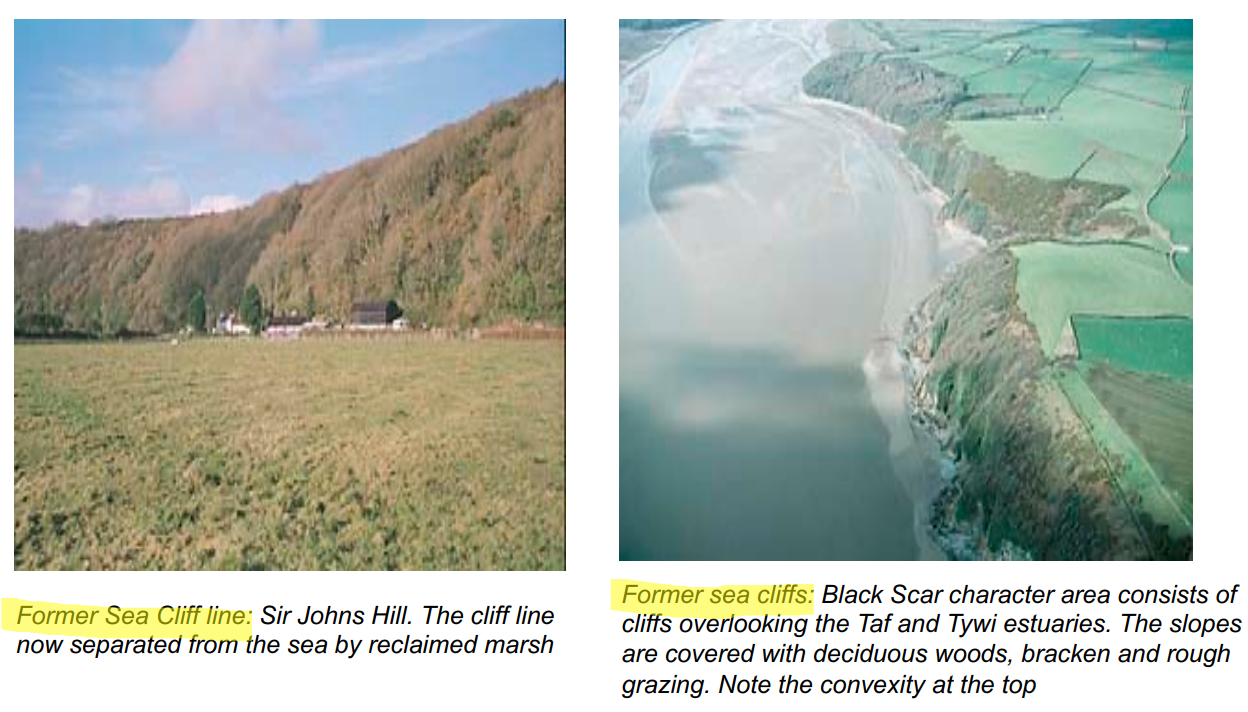
Morphology
- Sea cliffs
- Horizontal erosional landforms
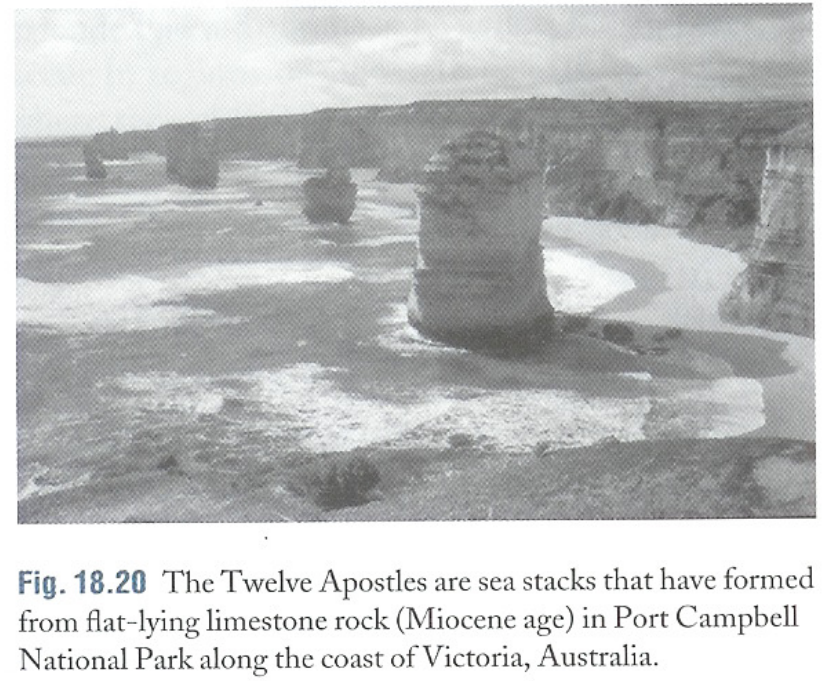
- Sea stacks
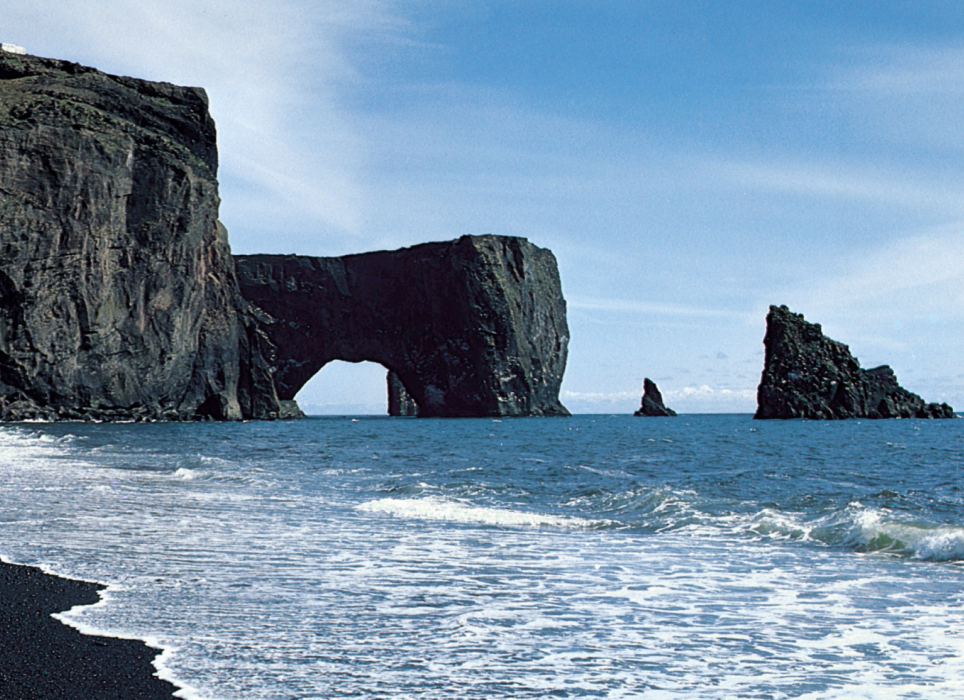
- Arches
- Erosional features
Rocky Cliff Coast:
Unconsolidated Cliff Coast:
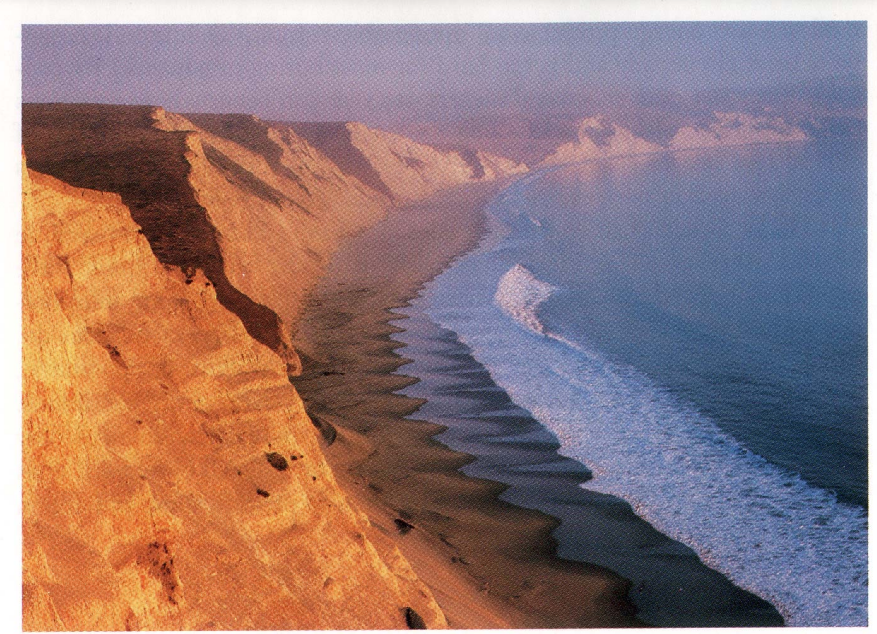
Marine Terraces:
Sea Cliff Stages:
Sea Stacks:
Arches:
Nature Likes Smooth Shorelines:
Chapter 16- Coastal Wetlands
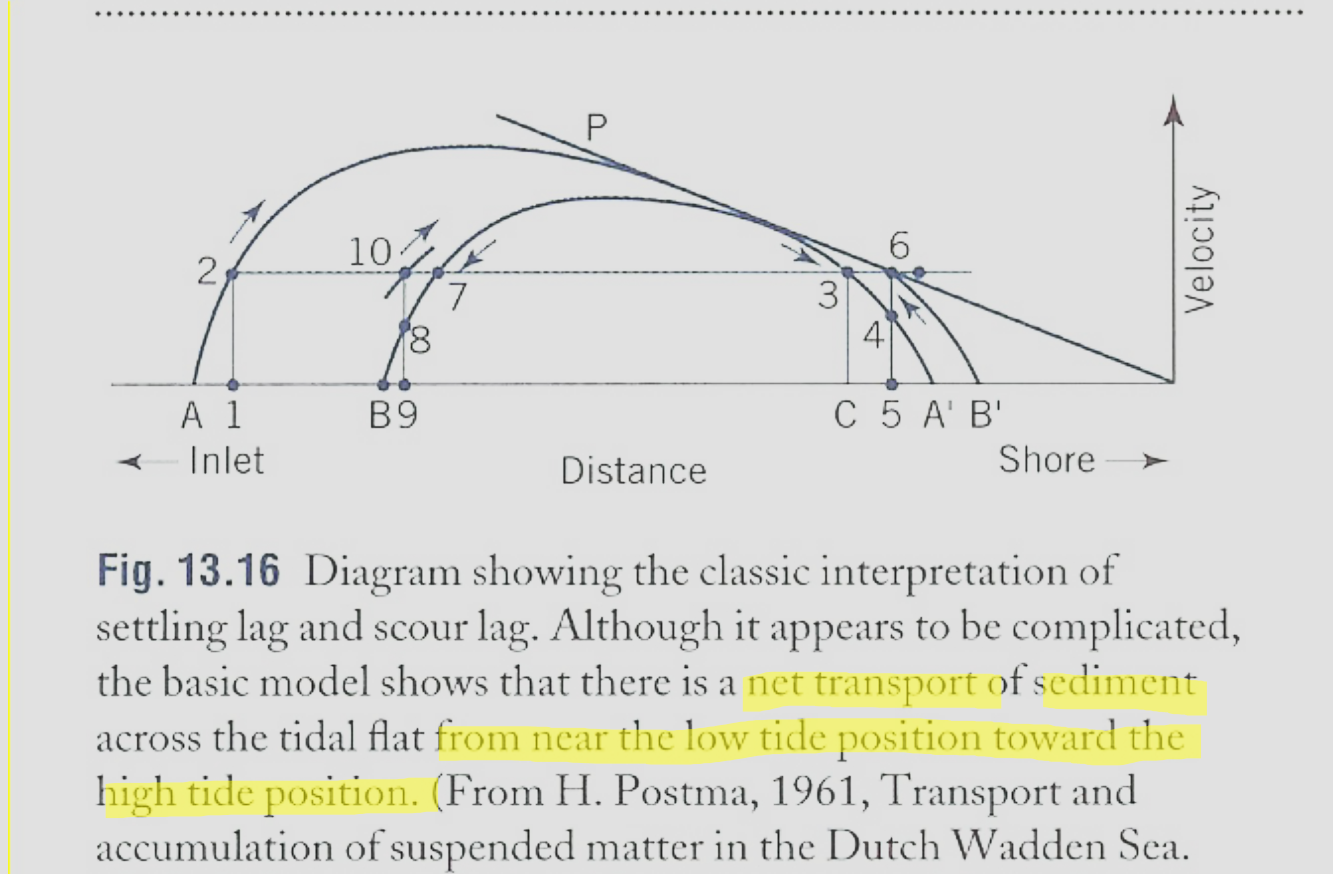
*Tide-Driven Settling of Particles
Coastal Wetlands
- Wetlands are areas that are periodically or permanently inundated by surface or groundwater and support vegetation adapted for life in saturated soil.
- A portion of the inner, protected margin of an estuary or a low-energy open coast;
- Covered by a vegetated intertidal environment;
- Normal marine in salinity or range from brackish to freshwater;
- If covered with grass or grasslike vegetation---> marsh;
- If covered by with woody shrubs and trees---> mangroves;---> swamp, or, mangal;
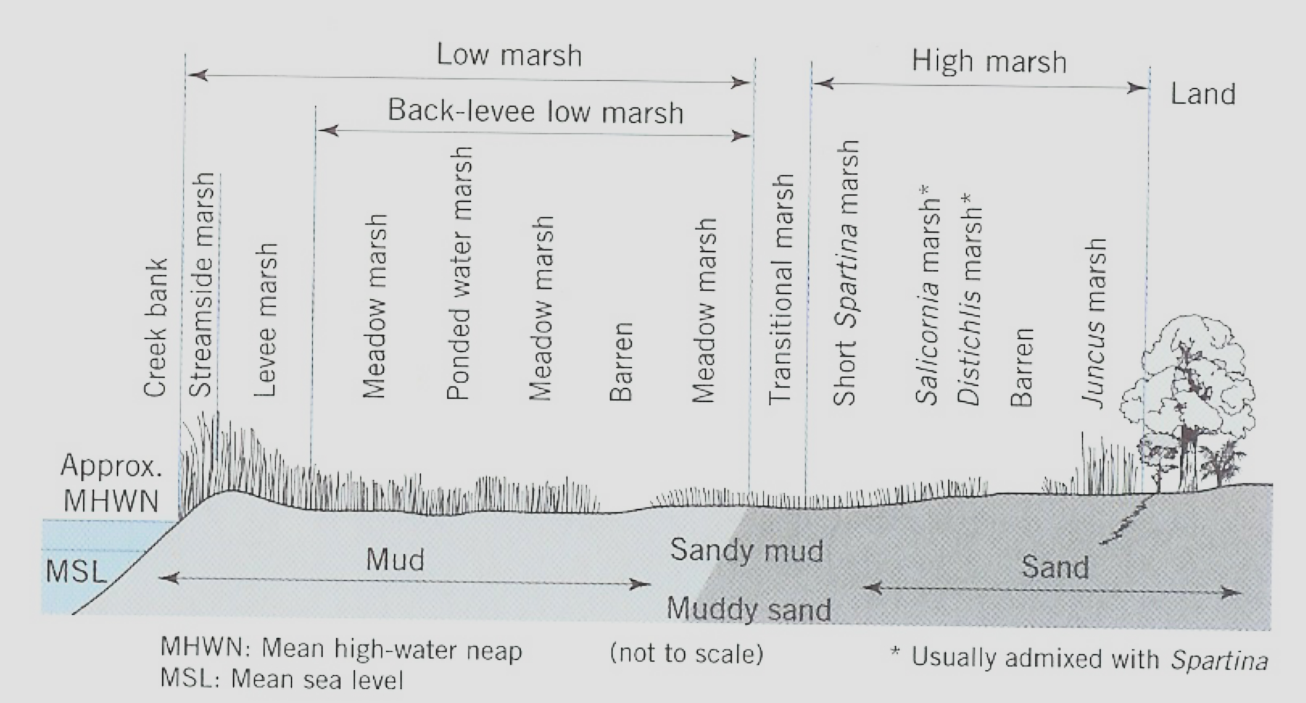
Characteristics of Salt Marshes
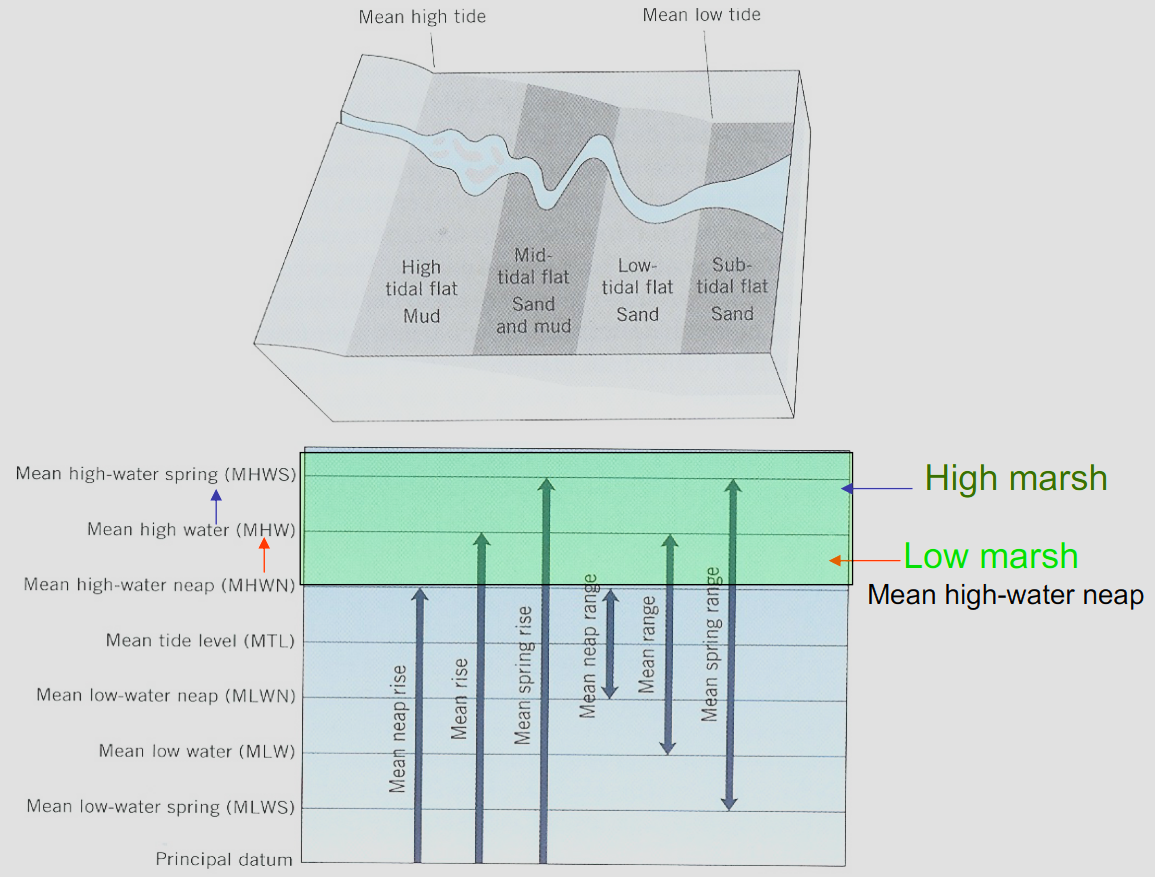
Low vs High Marsh
- Low marsh is flooded twice daily by tidal action
- High marsh is flooded irregularly by above-average tides
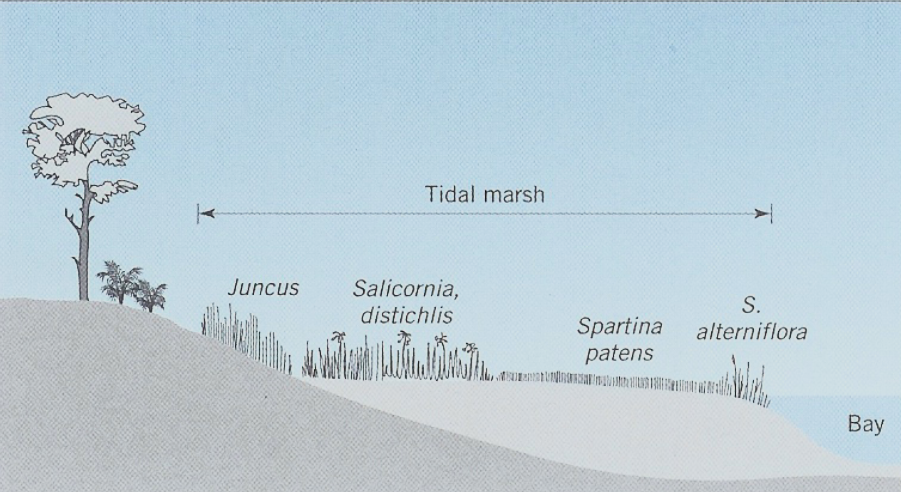
Marsh Plants
- Two genera of substrates:
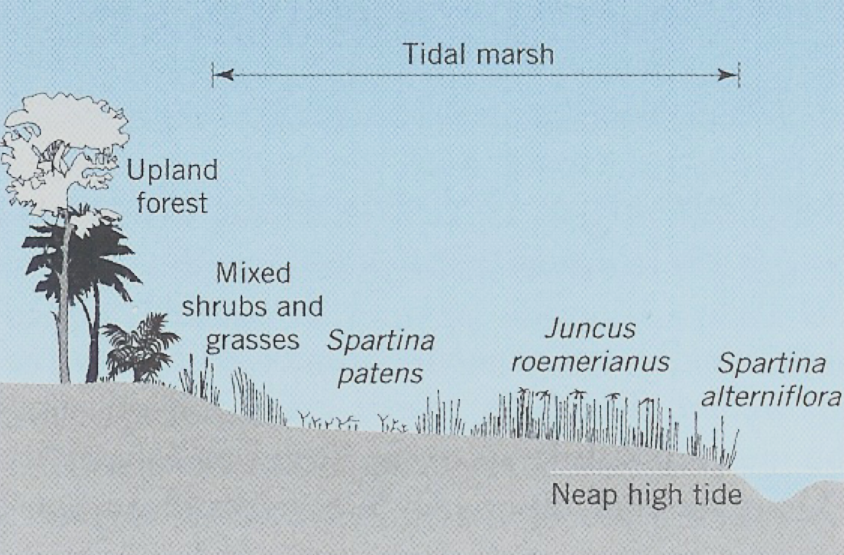
1. Juncus
- Grasslike perennial with flowering stems reddish brown to 1m found in tidal marshes.
- Primary high-marsh species in many N America Marshes: FL-GA-SC

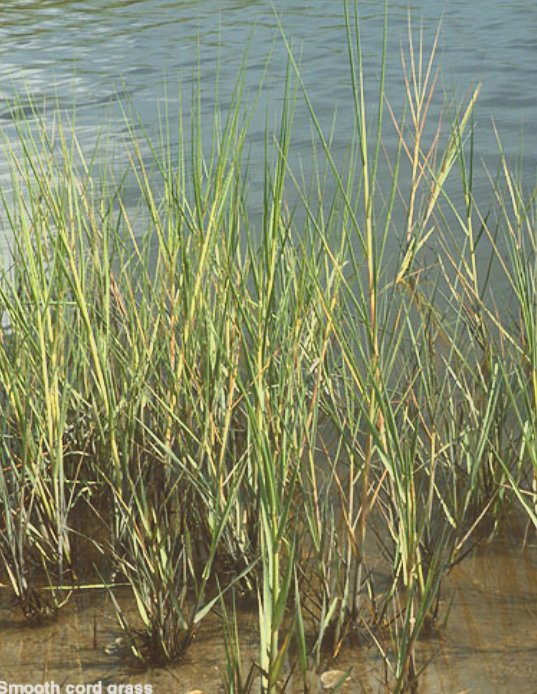
2. Spartina
- In the middle and southern coasts of N. America, Spartina alterniflora is the typical low marsh grass. It colonizes near the neap tide level.
- Smooth cordgrass, grows in very dense populations; more than 1 m
- High marsh: Spartina patens
- Fine and small in contrast to S. alterniflora
- It grows best on the upper flat surface
- High marsh: Spartina patens
Other high marsh plants
- Distichlis: looks like Spartina patens and occupy the same part of marsh
- Salicornia: Also called: Salt wort, A fleshy plan rises only 20-30 cm
Marsh Characteristics
- Wave action;
- Tidal range;
- The rate of sea-level rise;
- The topography of the coast area;
- The sediment supply;
- The nature of substrate
Marsh Zonation
- The low marsh: the part of the marsh from the beginning of vegetation up to at least mean high tide;
- Dominated by Spartina alterniflora;
- The high marsh: extends from about the mean high tide up to the limit of tidal activity.
- Dominated by Juncus roemerianis and/or Salicornia
- The low marsh: the part of the marsh from the beginning of vegetation up to at least mean high tide;
New England
Georgia or Florida
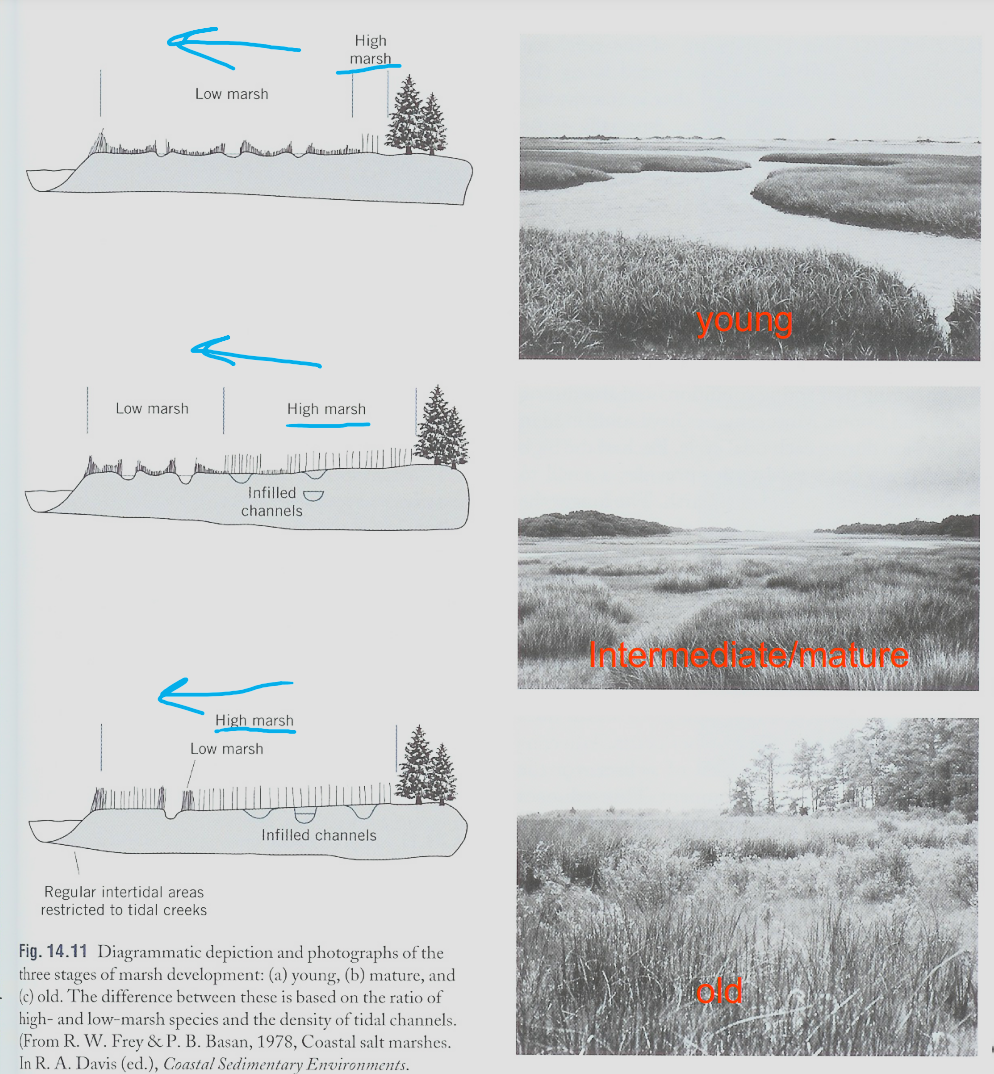
- Young marsh:
- Mostly low marsh (Spartina alterniflora)
- Many tidal channels Good drainage and sediment supply
- Intermediate/Mature Marsh
- The difference between these based on the ratio of high- and low-marsh species and the density of tidal channels
- Near-equal distribution
- Fewer tidal channels
- Old Marsh
- All high marsh with only fringe of low marsh
- Complete infilling of the intertidal zone up to high tide
- Young marsh:
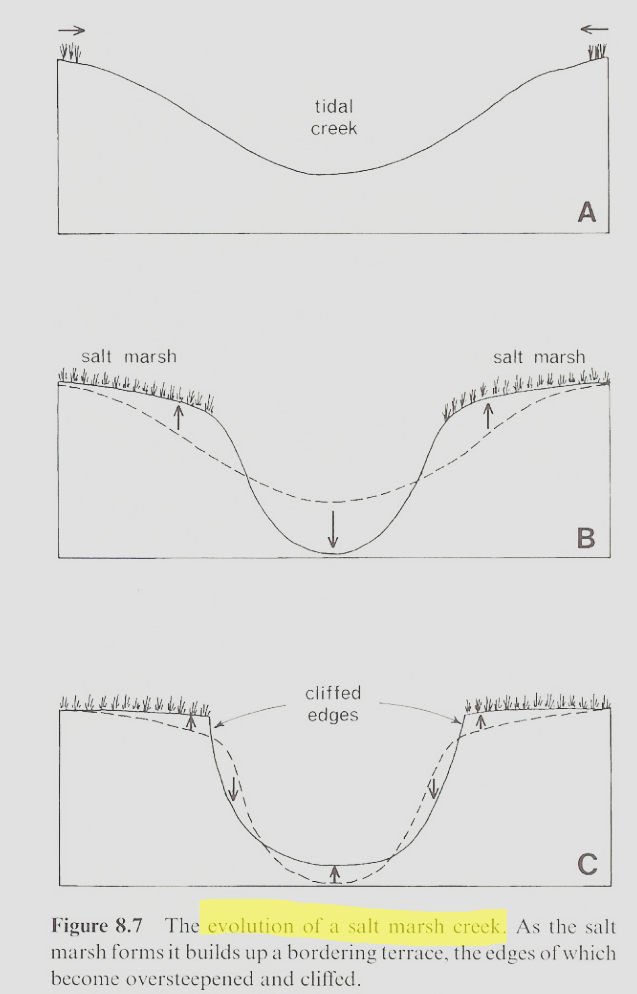
Marsh Sedimentation
- How does the marsh grow?
- Settling land –scour lag mechanism for building up the tidal flat
- What are the mechanisms for delivering sediment to the marsh or potential marsh environment?
- Storms
- How does the marsh grow?
Sediments
- The coastal marsh accumulates a distinctive combination of sediment, structure, geometry, and biogenic features
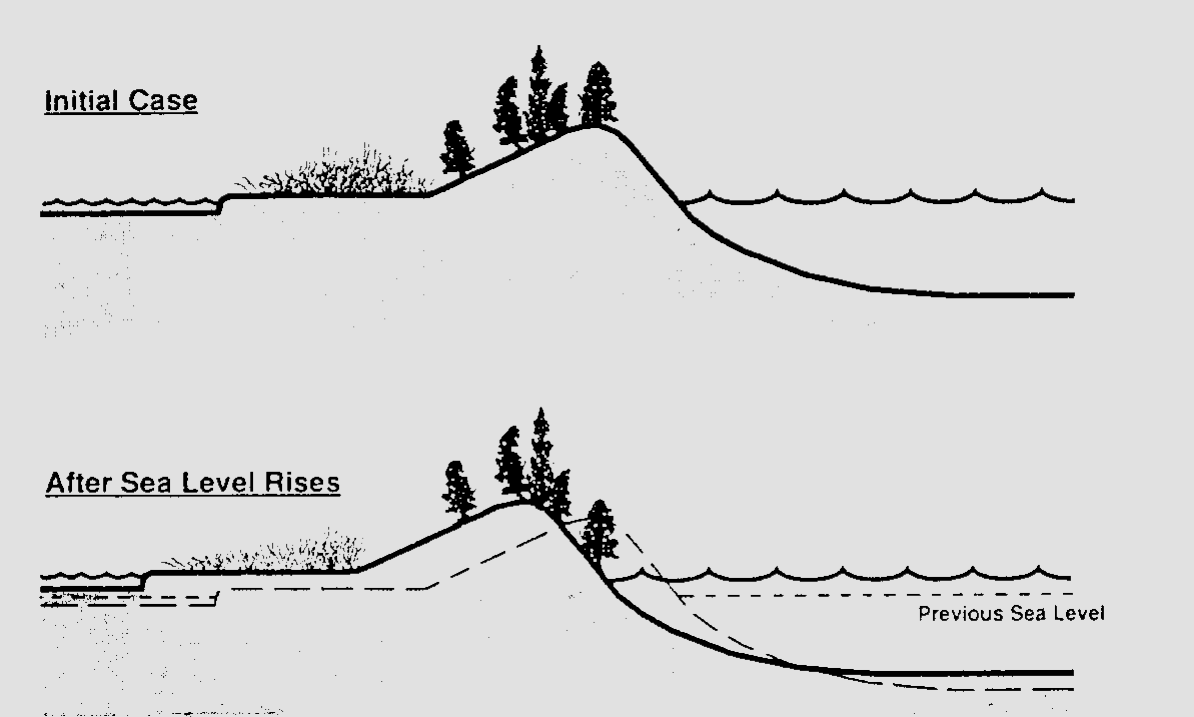
Impact of Sea Level Rise
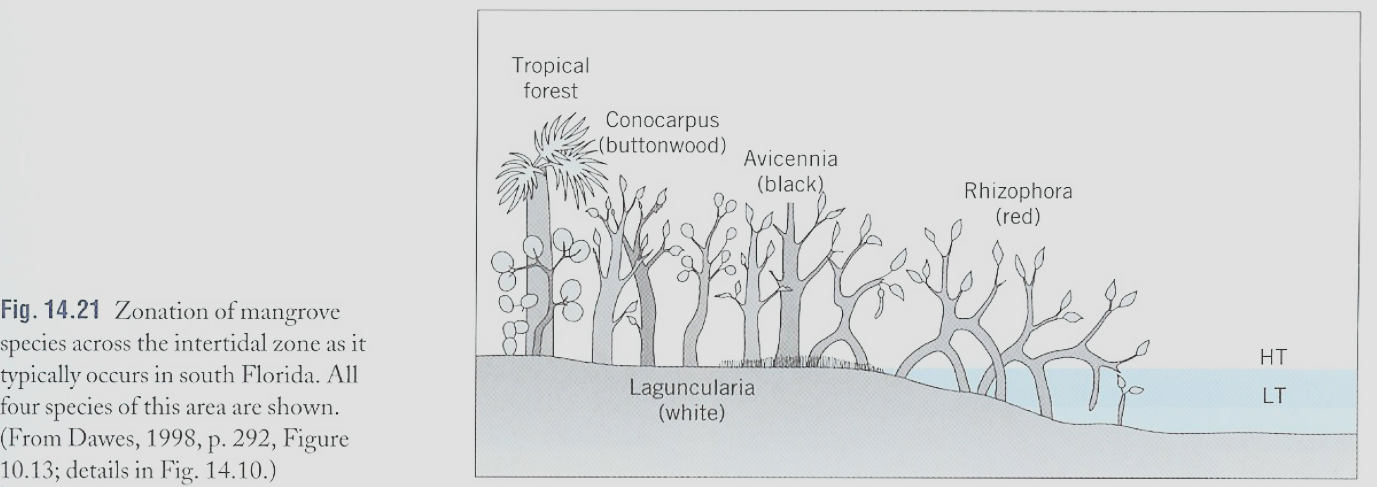
Marsh vs Mangrove
- Marshes are populated by grass and mangrove are dominated by trees and shrubs
- Mangroves occupy different position within the intertidal zone than do marshes
- Only in parts of Florida and Baja, CA, mangrove and marsh can live together
Mangroves
Local Distribution
- Mangroves are restricted to protected waters where currents are sluggish and waters are small.--à rather low-energy estuaries, lagoons, and backbarrier env.
Zonation
- Rhizophora mangle Red Mangrove has reddish-brown bark and dark green leathery leaves 5 to 15 centimeters (2 to 6 inches) long
- Most seaward
“Shored Up” Documentary- Tues, 4/2/24
- Documentary on how hurricane affected North Carolina and New Jersey
No class- Thurs, 4/4
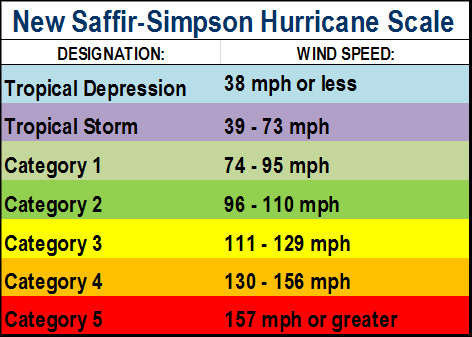
Chapter 17- Hurricanes
- Hurricane season in NC/Atlantic is from June 1st - November 30th
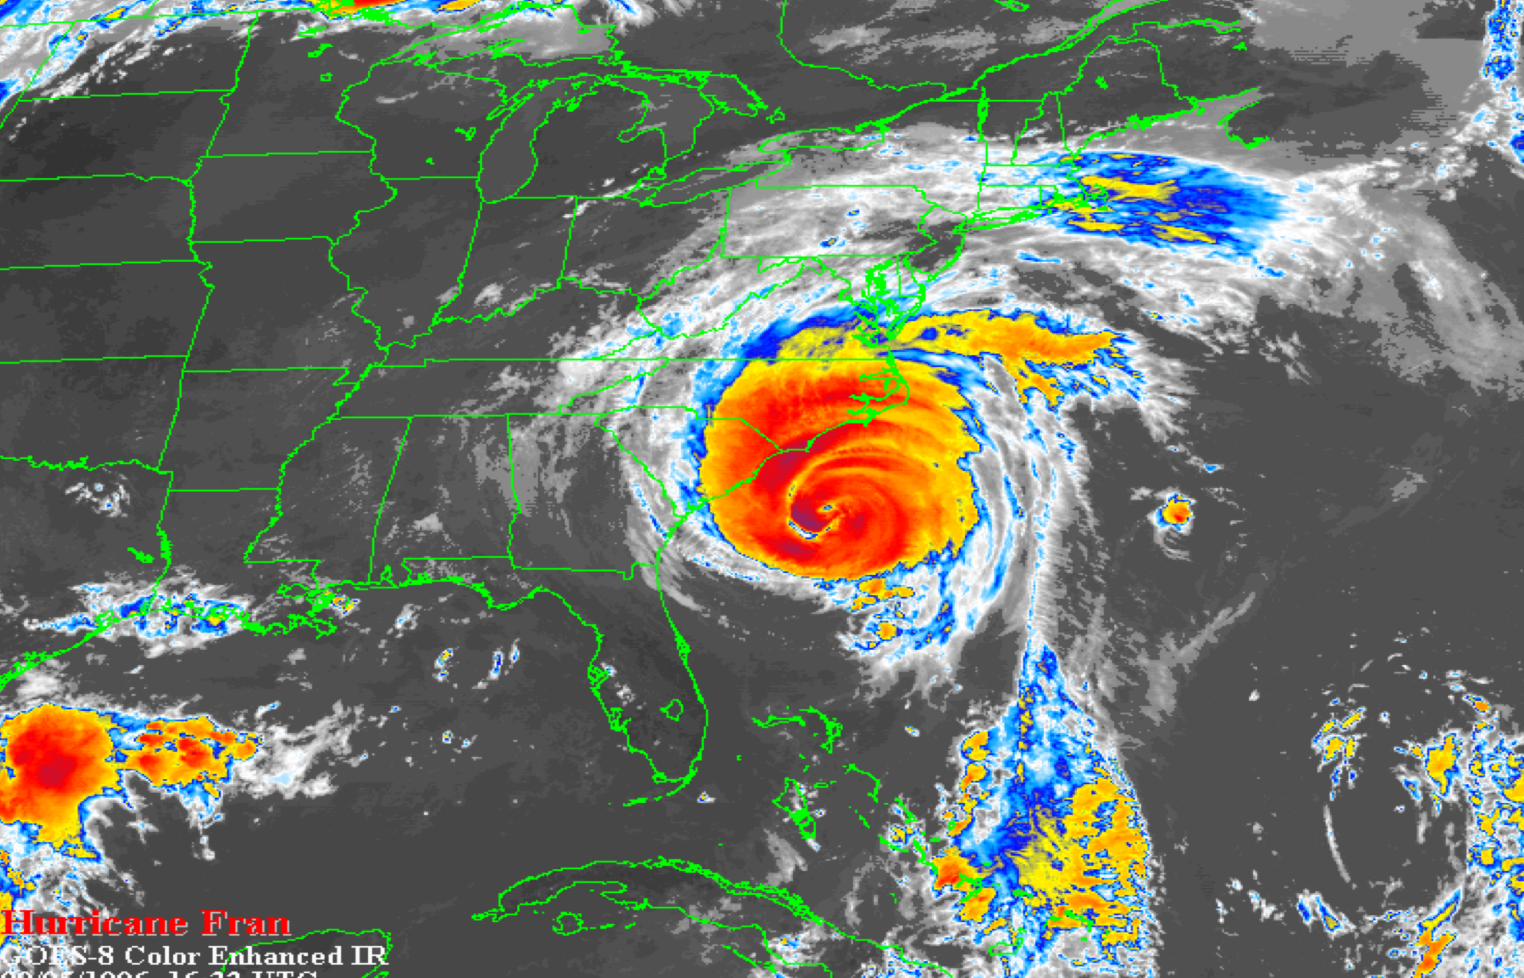
- Tropical cyclones affecting North Carolina usually take one of three tracks:
- Coastal Track: Largest threats are high winds and coastal flooding from storm surge
- Inland Track: Usually causes nearly statewide damage from flooding and high winds
- Gulf Track: Mostly likely to cause flooding in the mountains
- Hurricane Fran
USGS HAZARD SCALE: Levels 1, 2, 3, 4
Impact Level 1
- Swash Regime: During a storm, if wave runup is confined to the beach, the beach will typically erode and the sand will be stored offshore. However, over weeks to months following the storm, the sand naturally returns to the beach, restoring the beach to its original configuration.
No net change to the system
Impact Level 2
- Collision Regime: If wave runup exceeds the elevation of the base of the dune, the runup will collide with the dune causing erosion and dune retreat. Unlike the temporary changes of Level 1, this change is considered a net, or (semi-) permanent, change to the dune.
Net dune erosion
Impact Level 3
- Overwash Regime: If wave runup exceeds the elevation of the dune, or in the absence of a dune, the beach berm, the system will be overtopped, transporting sand landward. This is a net change contributing to the migration of the barrier island landward.
Net onshore transport order 100 meters
Impact Level 4
- Inundation Regime: If the storm surge is high and the elevation of the barrier island is low, the barrier can become completely subaqueous. Sand is transported landward over the island an order of magnitude farther than typical overwash of Level 3.
Net onshore transport order 1000 meters
- Hurricane Floyd: Slow moving hurricanes mean more rain and more wave/storm surge development
Chapter 18- Glaciated Coasts
- Onset of the Pleistocene glaciation started approximately 3 millions years ago with the formation of permanent ice sheets at high latitudes
- Over the past 800 ky, sea level has fluctuated by 120-140 meters which correlates to 50- 60 million cubic kilometers of ice
- Glaciations dominate 90% of the epoch and interglacials occur during the other 10%
Last Glacial Maximum (LGM)
- 30k yrs -19k yrs ago
- Sea-levels fall rapidly, 30-40 meters in 1000- 2000 years
- Ice volumes were 55 million cubic kilometers greater than present
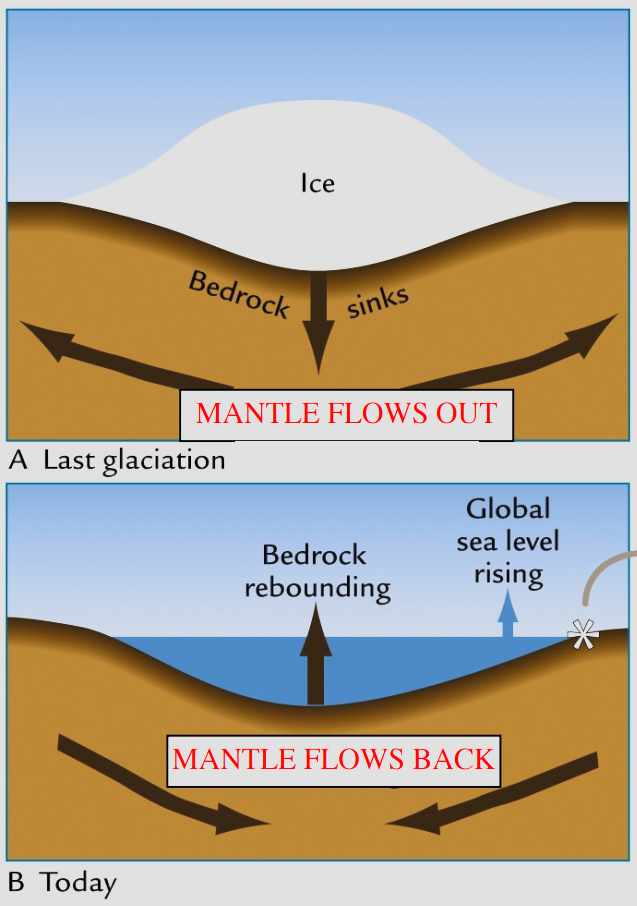
- Why motion today?
- Small motions resulting from post-glacial rebound (GPS can detect motions as small as 1 mm or 1/25 of an inch per year) stem from the fact that the mantle below the earth's crust flows like a super-viscous fluid -- much, much stickier than road tar or maple syrup.
- The mantle is still flowing to fill areas underneath the places where the heavy ice sheets pushed out the mantle 18,000 years ago.
- Raised beach- Successive beaches left as fossil shorelines, recording uplift history
- Over the past 15,000 years, the important climatic changes include: 1) Younger Dryas cold period; 2) Holocene maximum warm period; 3) Medieval warm period; 4) the Little Ice Age; and 5) human activities and global warming
Glacial effects on coastlines
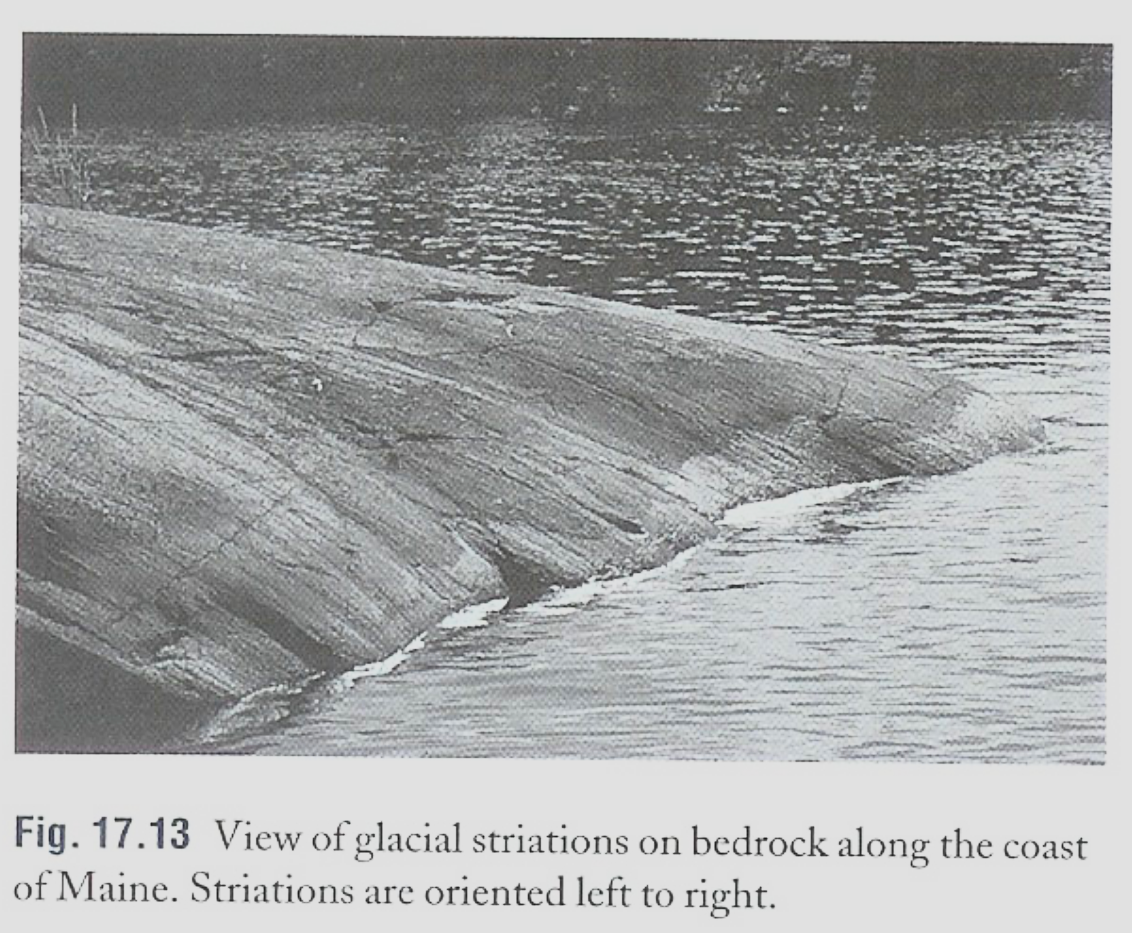
1. Erosion
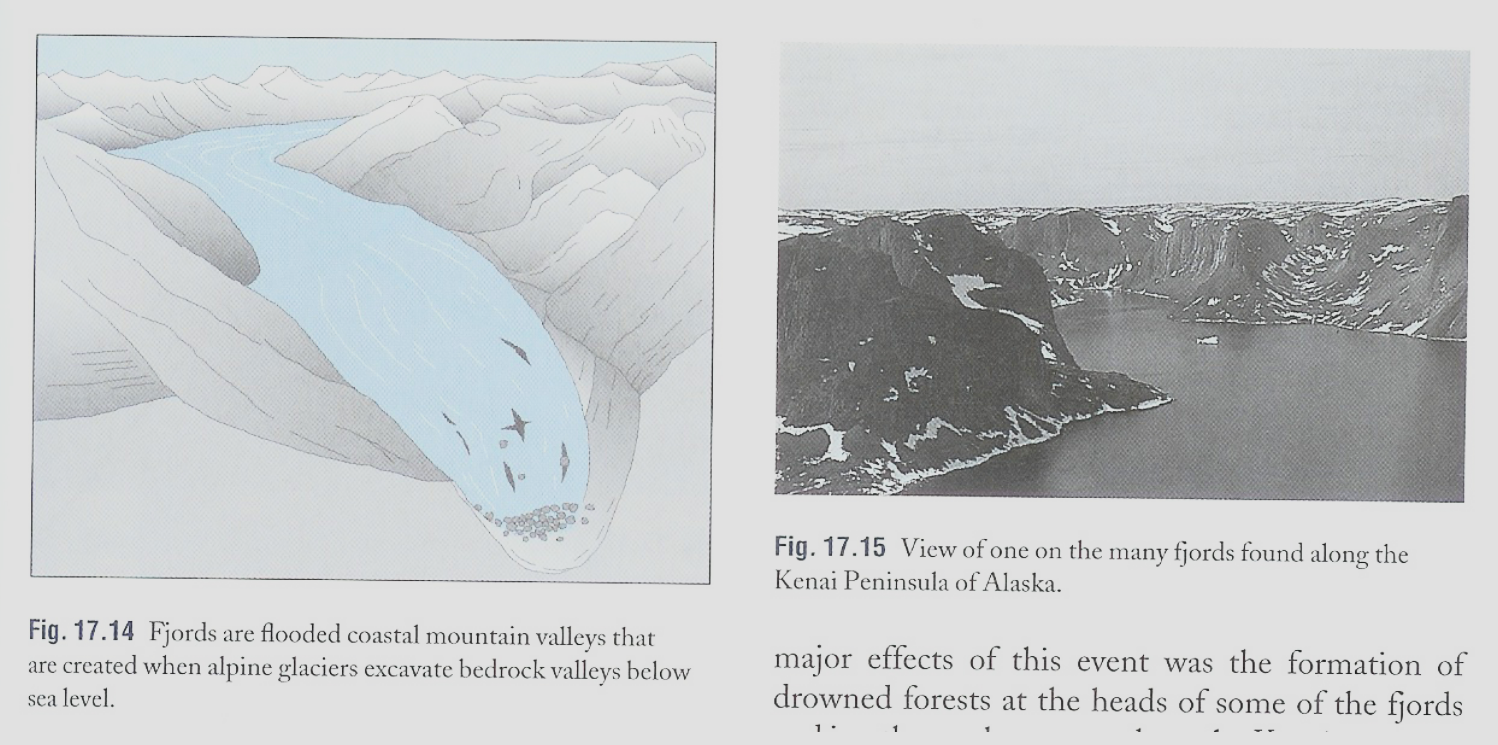
2. Fjords
3. Rocky Coasts
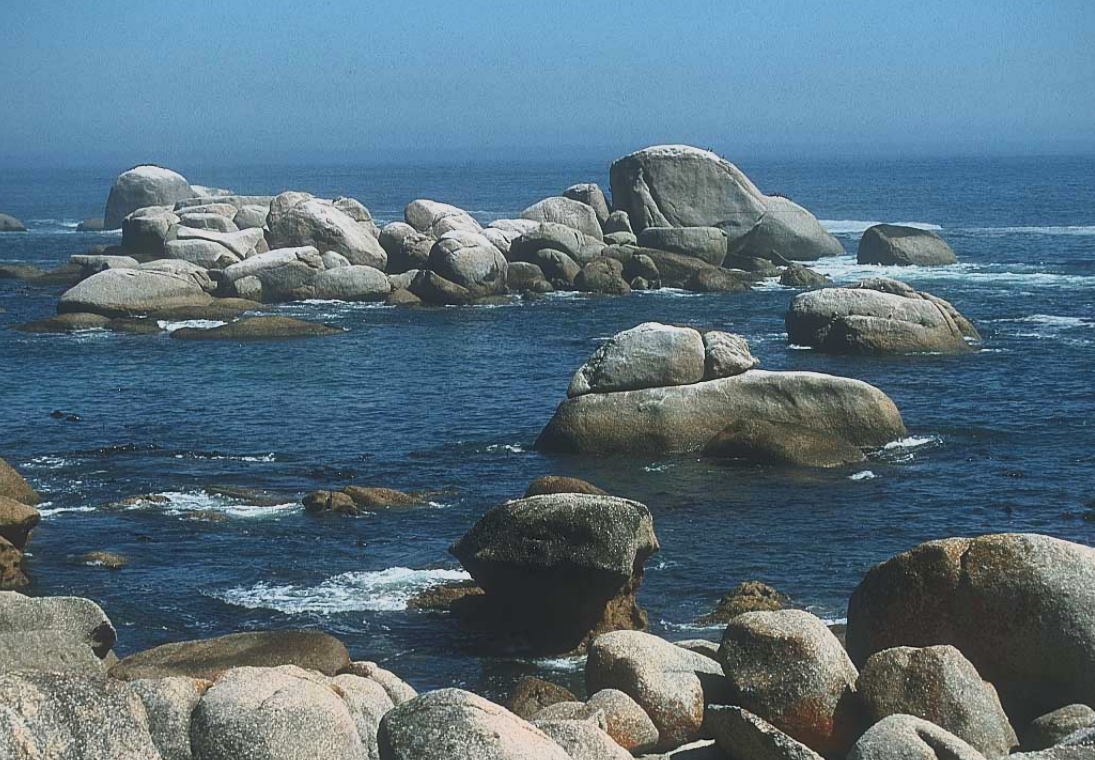
- Schematic cross section of the glacier margin in coastal Maine, showing deposition of a moraine where the edge of the ice sheet was in the sea.
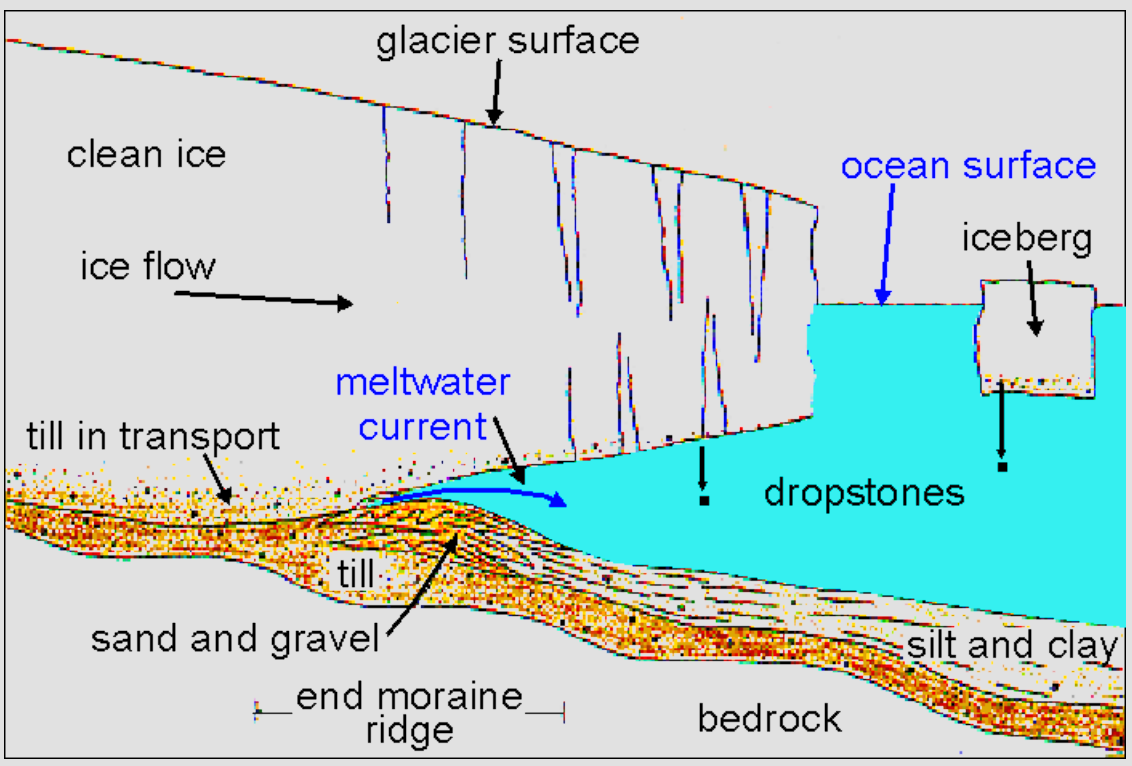
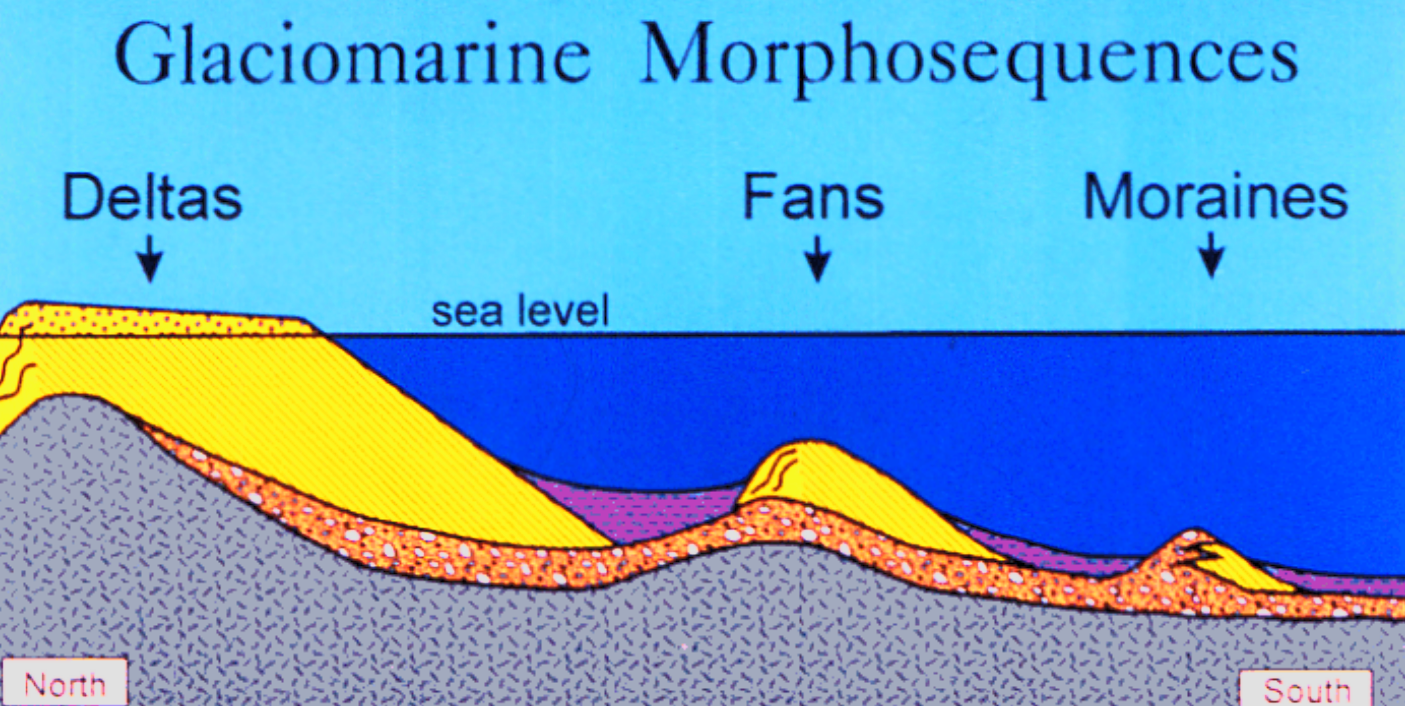
- Schematic diagram showing a moraine, submarine fan, and marine delta in relation to the late-glacial sea level in southern Maine. Gray: bedrock. Orange: till. Yellow: sand and gravel. Purple: glaciomarine mud (Presumpscot Formation).
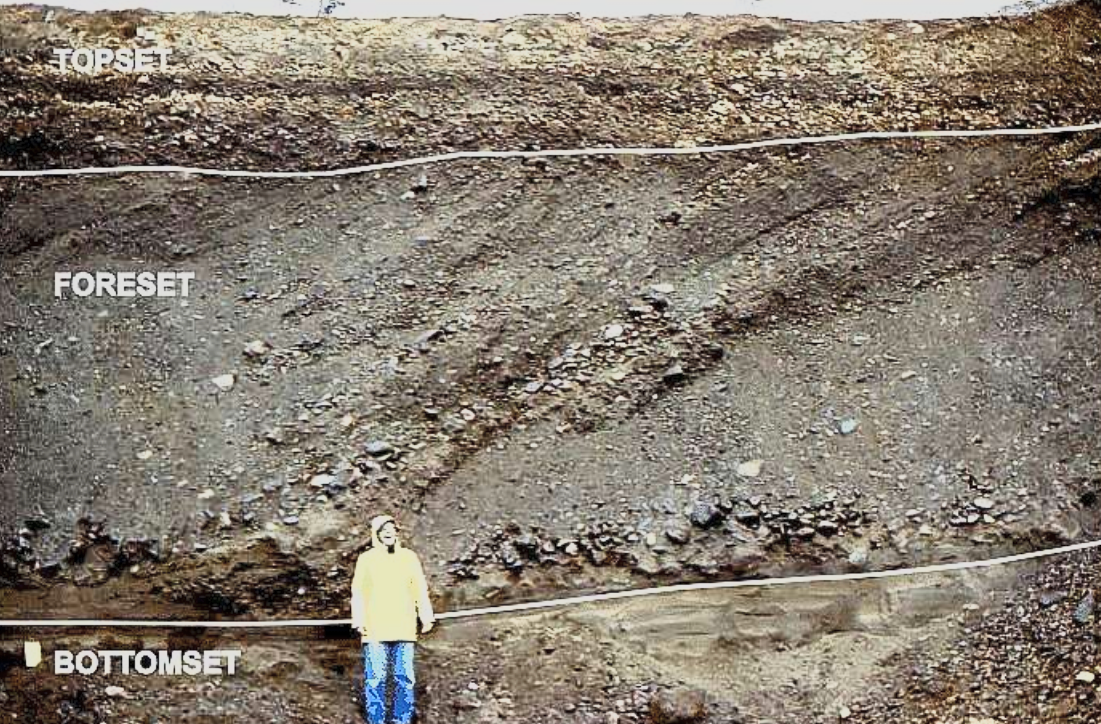
- Delta built into glacial lake, southeast of Kennebago Lake, western Maine. Boundaries between topset, foreset, and bottomset beds are marked.
- Peru’s Quelccaya ice cap is the largest in the tropics. If it continues to melt at its current rate – contracting more than 600 feet a year in some places – it will be gone by the year 2100, leaving thousands who rely on its water for drinking and electricity high, dry, and in the dark.
Ice Shelf
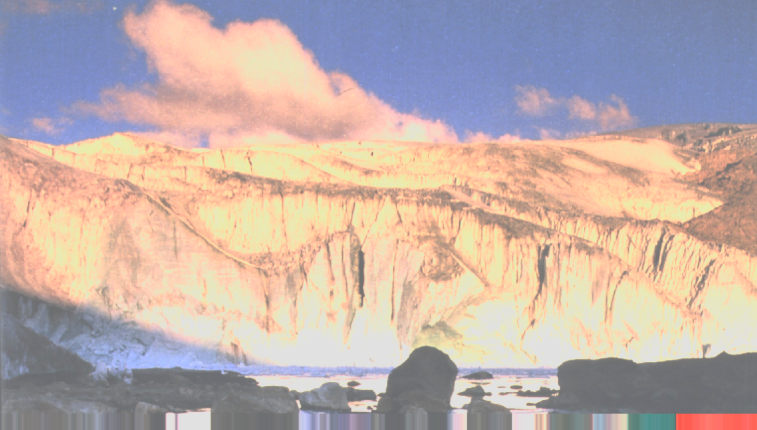
- The epic collapse of a 1,250- square mile section of the Larsen Ice Shelf took just over a month in early 2002. Scientists are monitoring what effect the further disintegration of the Larsen, and other Antarctic ice shelves, might have on the continental glaciers. Without ice shelves to act as dams, those glaciers might migrate faster toward the coast, ultimately contributing to rising sea level.
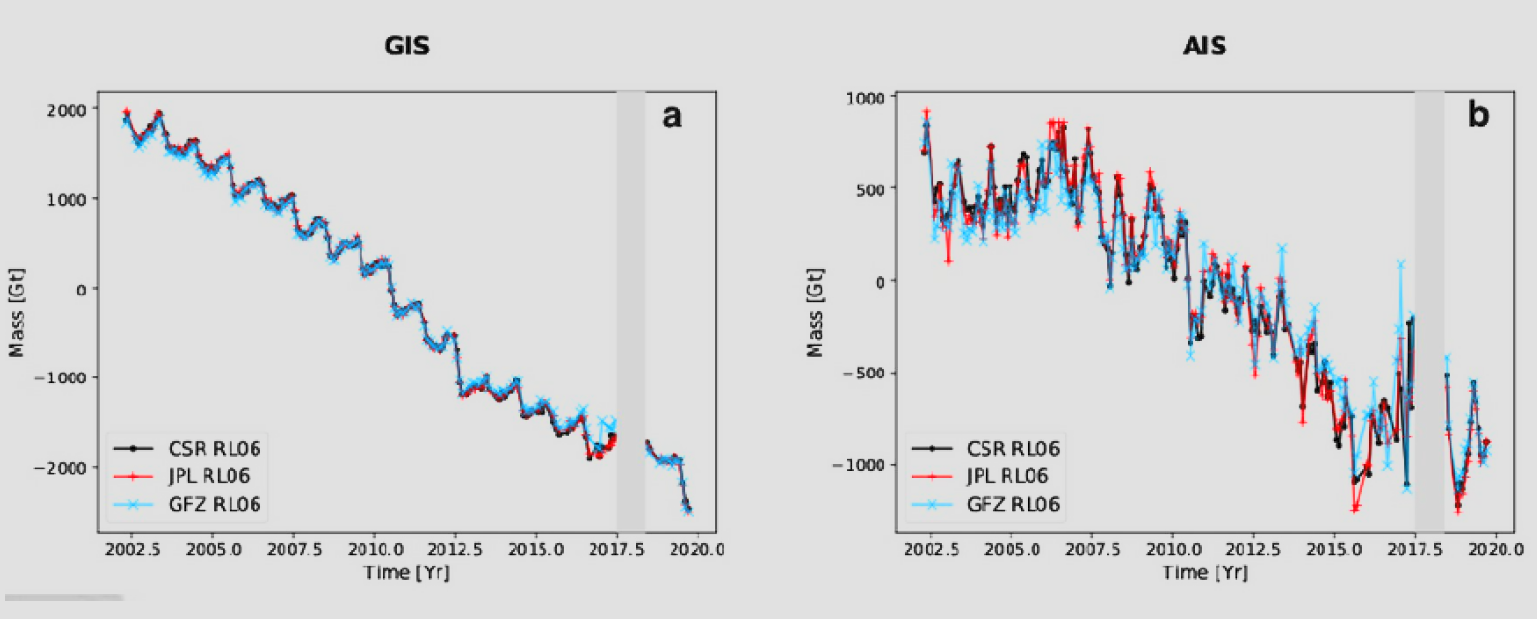
- During the exceptionally warm Arctic summer of 2019, Greenland lost 600 billion tons of ice—enough to raise global sea levels by nearly a tenth of an inch (2.2 millimeters) in just two months.
Chapter 19- Coral Reefs
Introduction
- Calcium carbonate
- Limestone is left over when animals grow and die
- This carbon containing molecule is the basis for coral formation
- As we will see, coral production exhibits huge impacts on ecosystem diversity and success
Requirements for reef formation
- High light levels
- High water transparency
- Clean water
- No mud or cloudy conditions
- Water temperatures > 20 degrees C (68 degrees F)
- Low nutrient waters
- Hard substrate for attachment
- Need something to ground them for them to build off of
- Good water circulation
- Good oxygen and water circulation
Coral types
- Hard (stony, scleractinian “true”) corals build the reef by extracting calcium carbonate from the ocean water
- They create a home in which primary producers can live
- They crase diverse 3-D space in which mah other organisms can find homes
What is coral? Animal, vegetable mineral?
- Coral are actually a special group of cnidarians, the same family of jellyfish
Hermatypic vs. non hermatypic corals
- Hermatypic corals: corals that form large colonies called reefs
- Brain corals (diploria)
- Ahermatypic corals: corals that are solitary or form small colonies (often lack zooxanthellae and do not help build reefs)
- Mushroom coral (fungia)
Larva
- Coral larva are called planula, since they don't like soft sea floors, they often metamorphose into a polyp which establishes a founder colony in a new location
- Medusa’s are a mobile polyp
- Cannot build themselves in the water column
- Coral remain closely connected
- Zooxanthellae, single celled photosynthetic algae work within the coral to help feed it through photosynthesis
- As a result of this symbiotic relationship, many corals don't need to seek food
- This added nutrition also helps corals to build reefs much faster
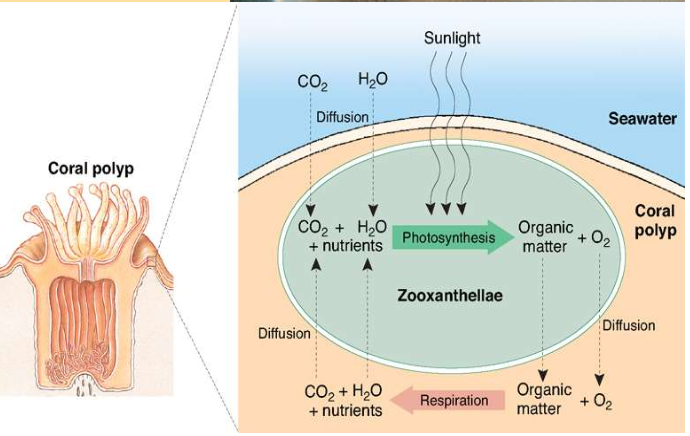
Mutualism between corals and zooxanthellae
- Coral polyp
- Provides a home for the zooxanthellae
- Provides nitrates and phosphates
- Give off CO2
Coral takes many shapes
- Plate- like
- Foliaceous
- Leaf like
- Columnar
- Massive
- Branching
- Free living
- Encrusting
Reefs grow when calcium containing sediments are deposited in spaces between coral
- As encrusting coralline algae “glues" the sediments together, new “live rock” is formed.
Corals benefit from the death of other organisms
- Once this Halimeda (calcareous green algae) dies, 95% of what remains will be sediment and real estate for new coral colonies
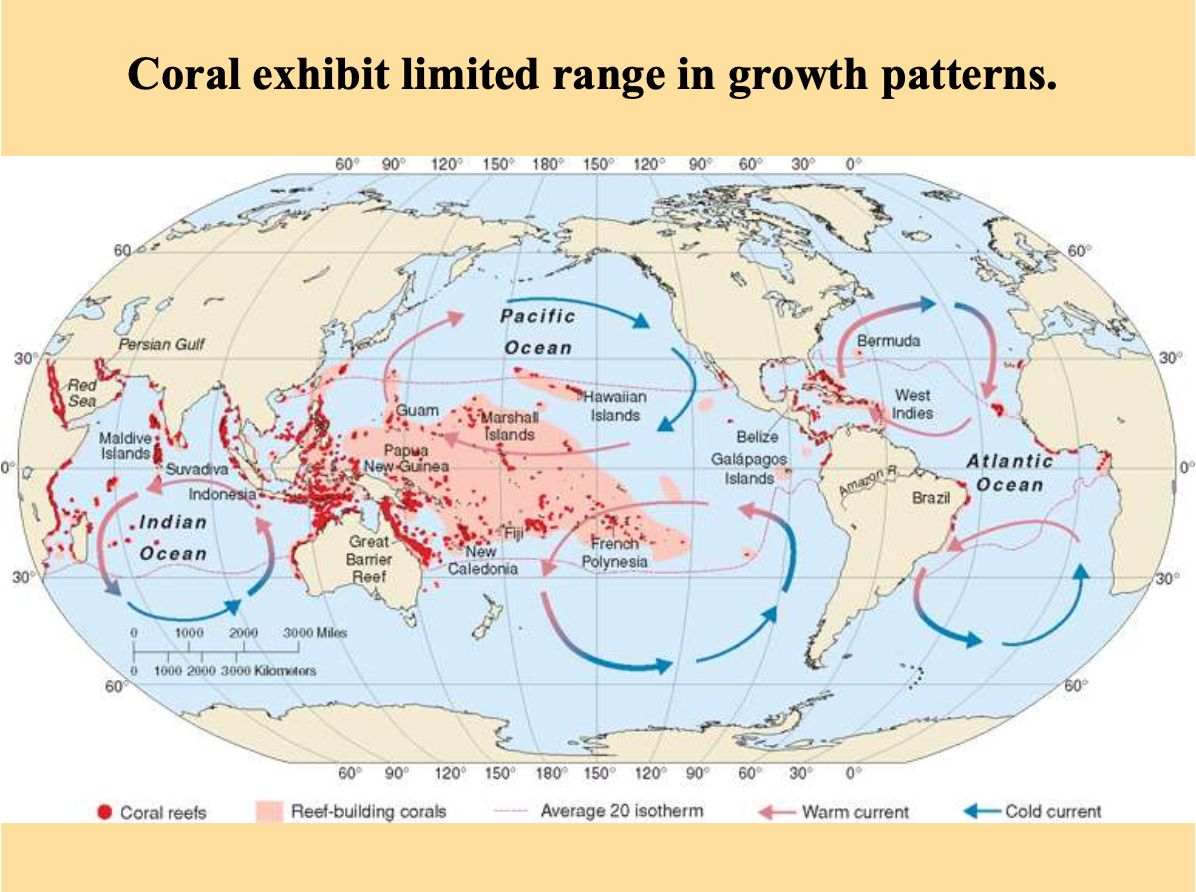
- Reefs primarily in central pacific ocean
- Marshall islands
- Paupa new guinea
- Great barrier reef
- Dominate indonesia, australia, and extends down towards madagascar, india and the red sea
- Warm water areas are hot spots for coral
- Without proper light and temperature, coral dies
- Bleaches
- It only takes 1-2 degrees in some cases
- How does global warming affect this trend?
- Kills a large number of coral and makes it very difficult to rebuild the reefs
- Temperature increases and competition from red algae have killed much of this coral reef
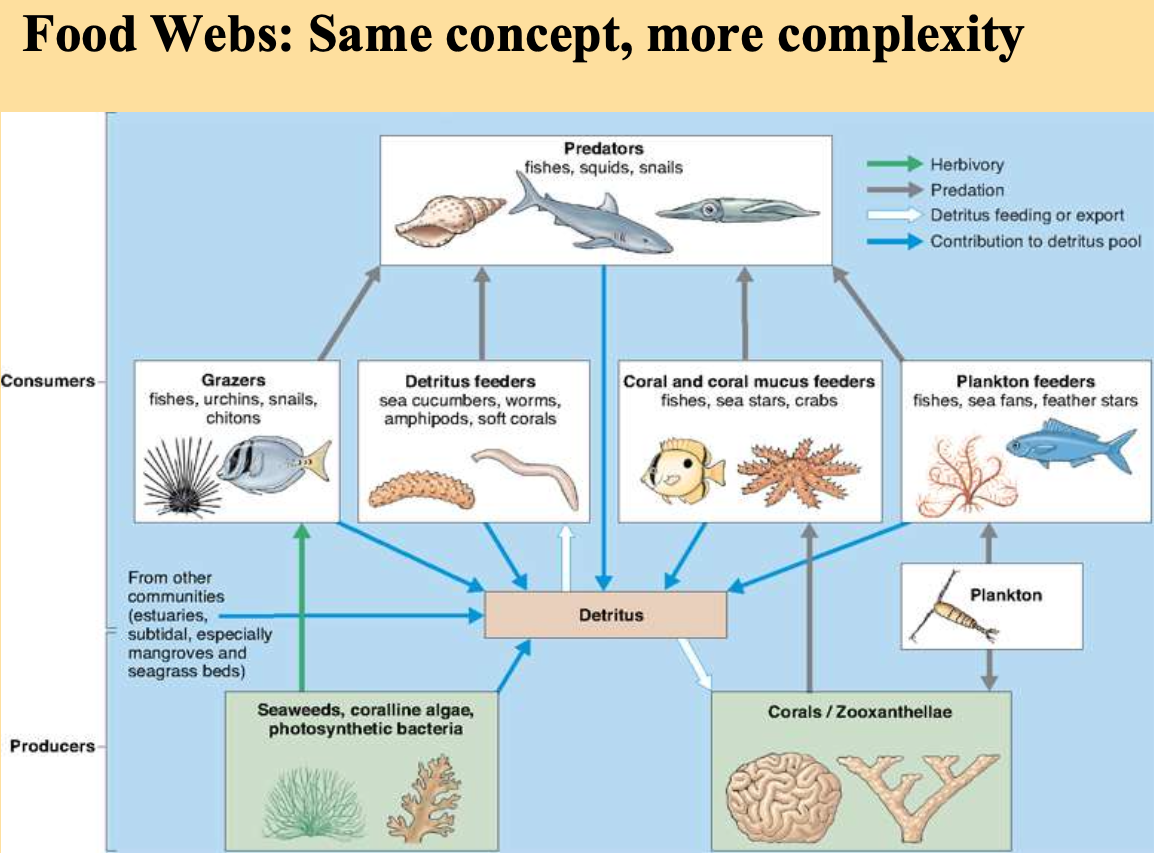
Coral reefs have high primary productivity
- Coral reef primary production ranges from 1500 to 3700 g of C/m2/yr
- This makes coral reefs one of the most productive communities on earth
- Rapid nutrient cycling between zooxanthellae and corals may be partially responsible for this
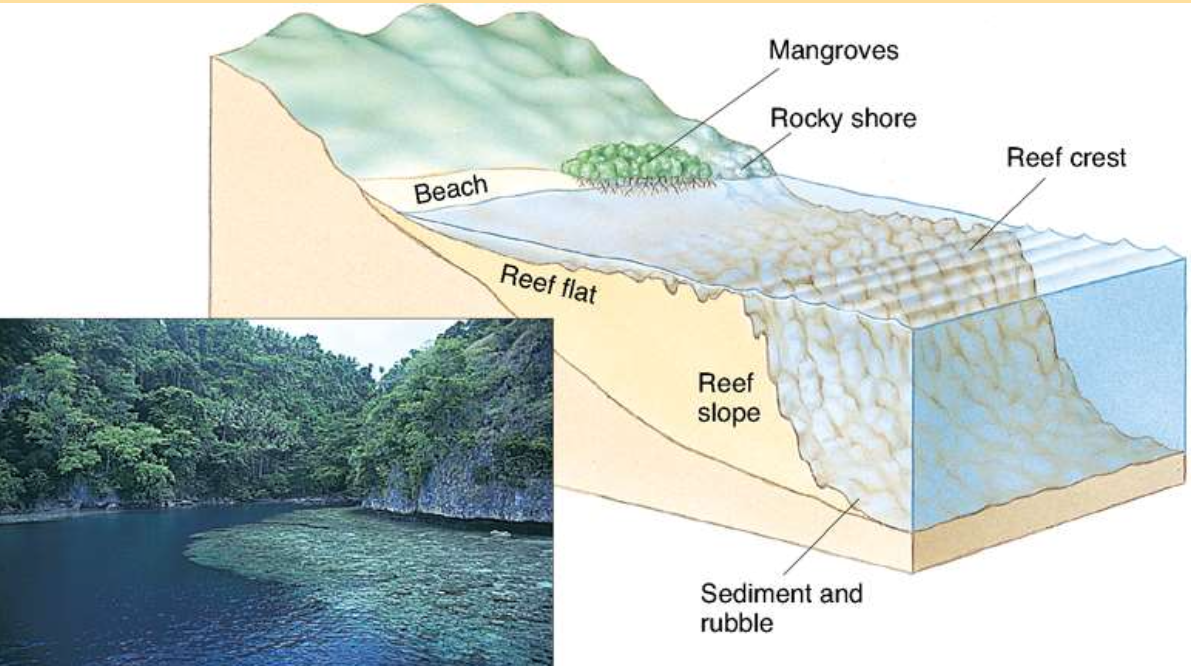
Fringe reefs
Diving reefs
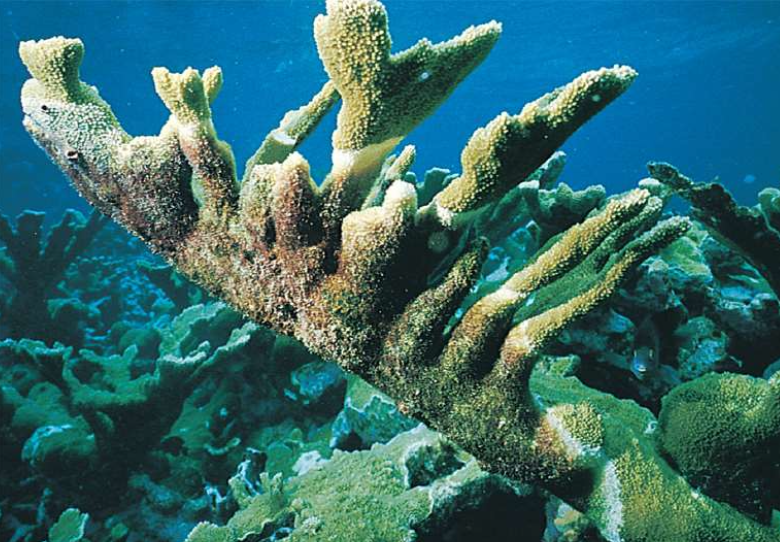
Growth on reefs
- Limited by tidal action
- Disease is another major factor of limiting growth. Here is an example of elkhorn coral (Acropora palmata) infested by “white band disease”
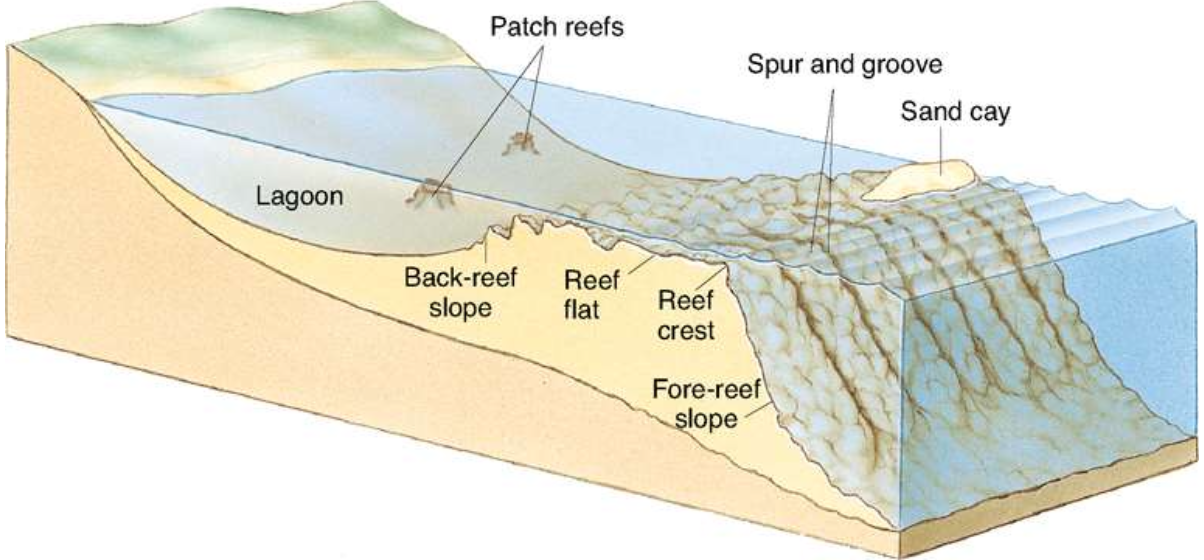
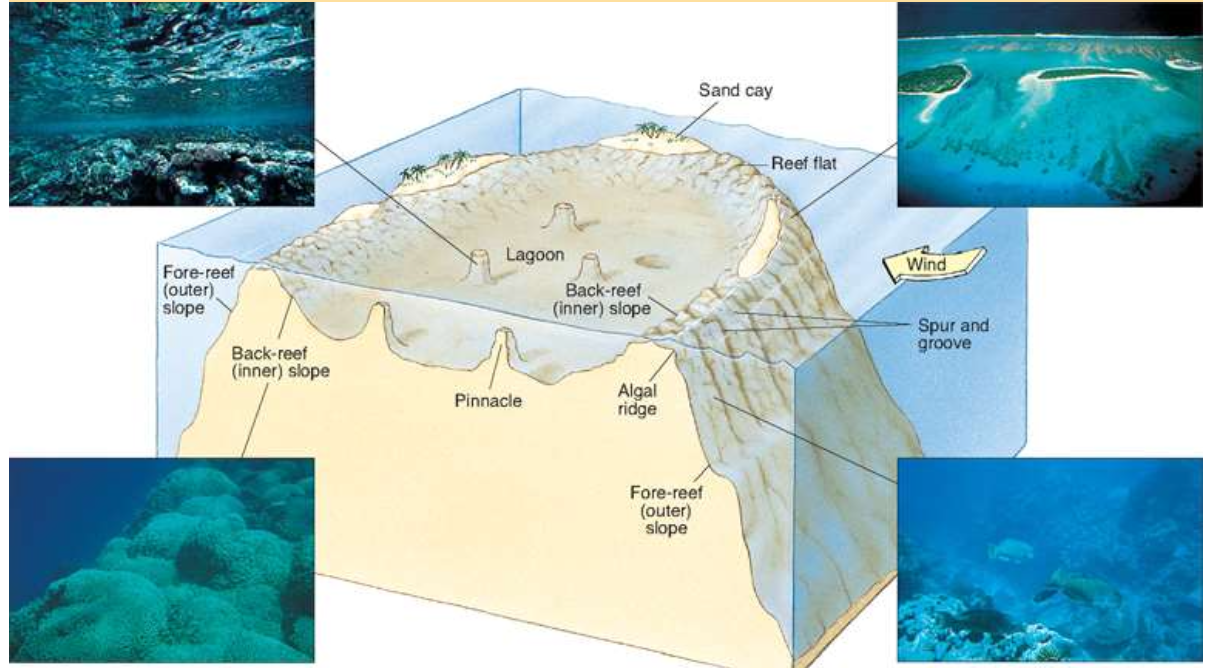
Barrier reefs
- Off shore and behind reef there is a lagoon environment
- Barrier reef structure can be influenced by spur and groove formations
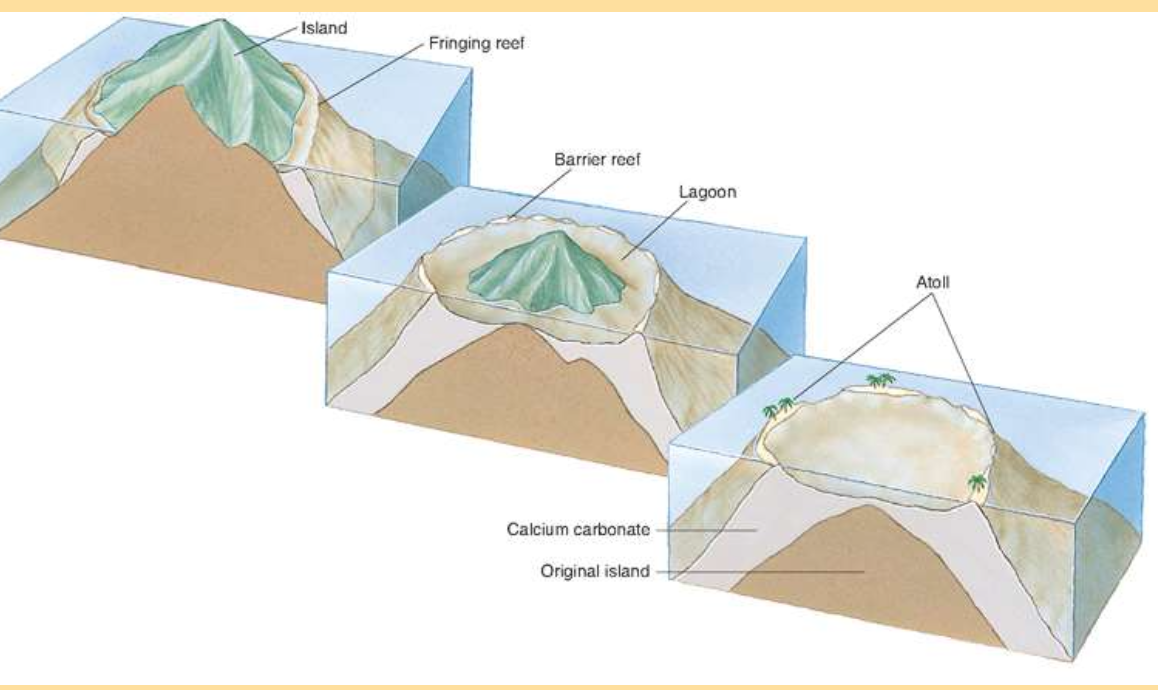
Atoll reefs: volcanic leftovers
Formation:
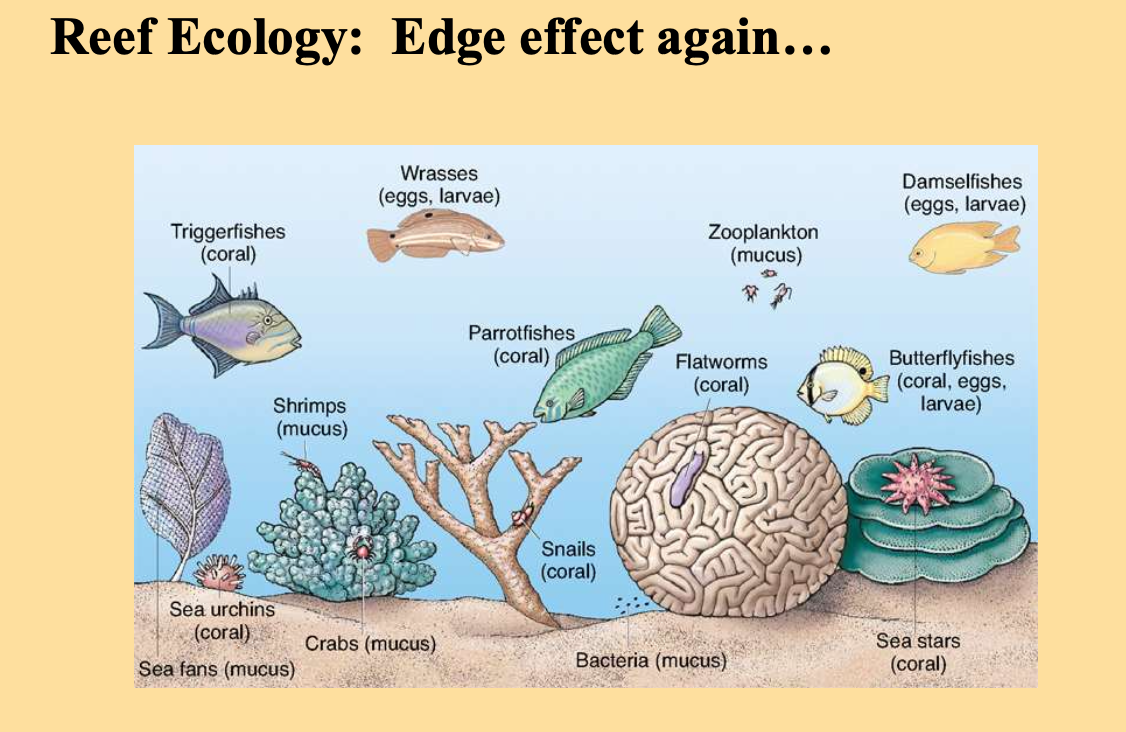
Coral fights? Yes
- Just like other animals competing for space, coral attack each other if they come into close contact
- Usually they just grow over one another, but some actually poison the others out
- Real Estate is at a premium with soft corals. Soft corals are fast growers, making them excellent competitors
- Most animals on reefs compete daily for everything, from food to mating opportunities.
Chapter 20- NC Coasts
The NC Coastal Plain
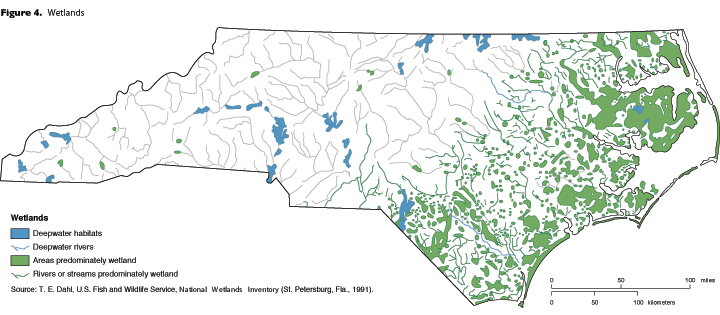
- North:
- More freshwater input
- Barrier islands
- Higher productivity due to freshwater input
- Estuaries
- More recently formed land
- South:
- Older formed land
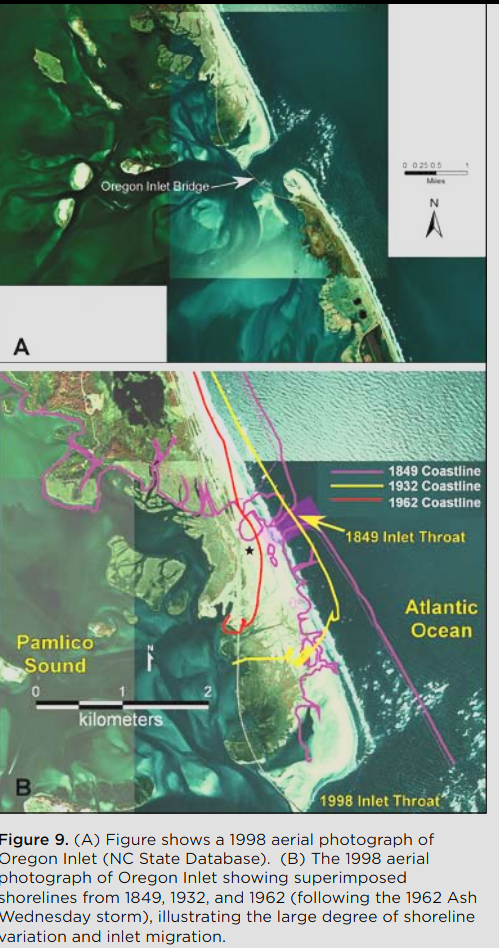
Oregon Inlet
- Oregon Inlet (Figs. 9 and 10) opened by a hurricane in 1846 near the site of a previous inlet (Gun or Gunt Inlet) which closed in 1798. Between 1846 and 1989, the inlet migrated approximately 2 miles south of its original location (Fig. 9B). In 1962-1963 the Oregon Inlet Bridge was built (Fig. 10), but the inlet continued to migrate causing the throat channel to migrate from under the fixed navigation span and Pea Island to be almost severed from the bridge. Consequently, inlet dredging was increased to preserve the navigation channel, a rock jetty was emplaced on the south bank in 1989-1991, and a rock revetment was emplaced around the south base of the bridge to prevent further migration. However, the constrained location of the south bank, and the continued southward spit growth on the north bank caused Oregon Inlet to narrow and deepen. The narrower throat channel resulted in rapid scour beneath the central bridge pilings. As a result, rocks were emplaced beneath the free-hanging pilings.
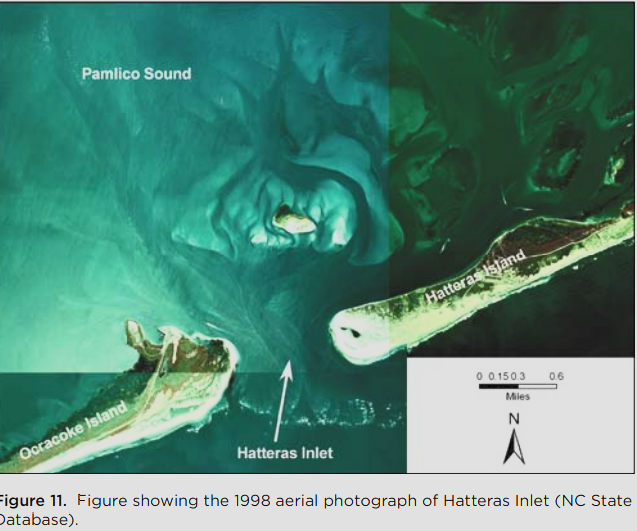
Hatteras Inlet
- Hatteras Inlet (Fig. 11) opened during the same hurricane that opened Oregon Inlet in September of 1846. During the Civil War, this inlet was used extensively since it was more navigable than Ocracoke Inlet (Stick, 1958). In fact, it was used by the Federal fleet that captured two Confederate forts near Hatteras Village in 1861, and again in 1862 when Roanoke Island was attacked.Today, Hatteras Inlet is used only by small craft as the inlet shoals and channels are subject to continual change. Transportation between Hatteras Island and Ocracoke Island is maintained via the state-run ferry system.
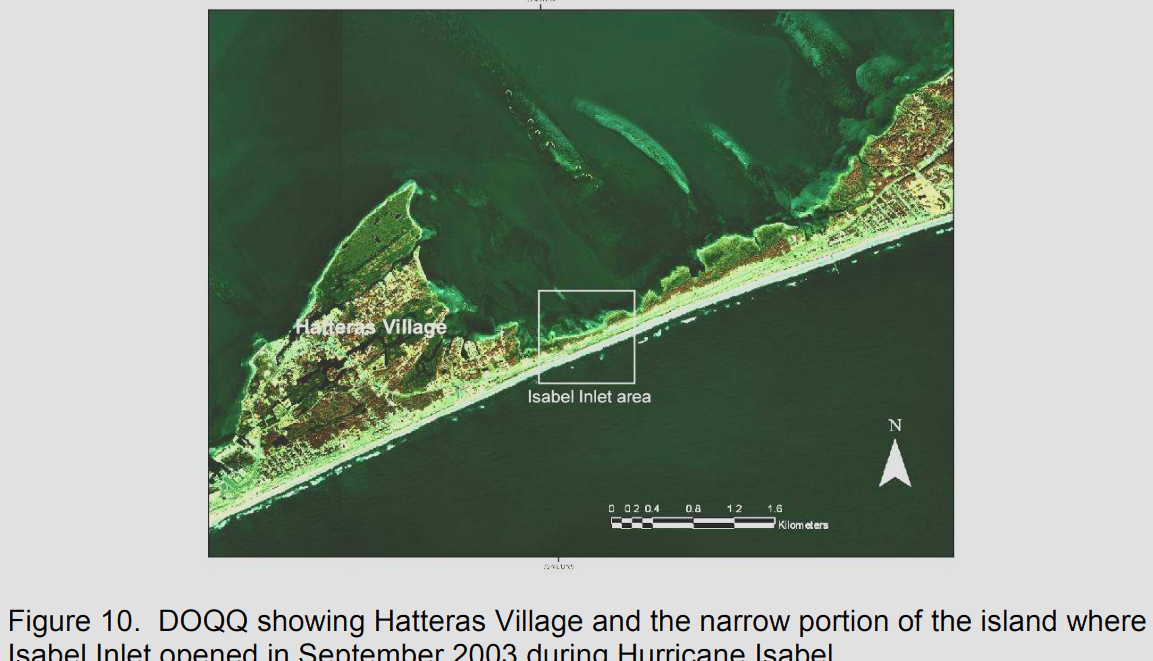
Isabel Inlet
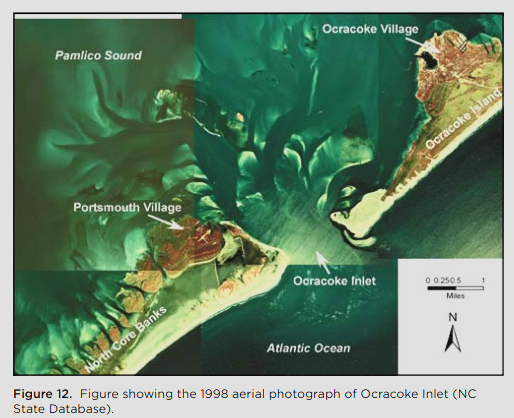
Ocracoke Inlet
- Ocracoke Inlet (Fig. 12) occurs on all of the 16th and 17th century maps of coastal NC. New data indicate that Ocracoke Inlet is located within a former river valley (Pamlico Creek) that drained the Pamlico Sound basin during the Last Glacial Maximum approximately 20,000 years ago (Mallinson et al., in review) (Fig. 13). It is likely that the occurrence of this river valley beneath the inlet accounts for its stability and longevity.
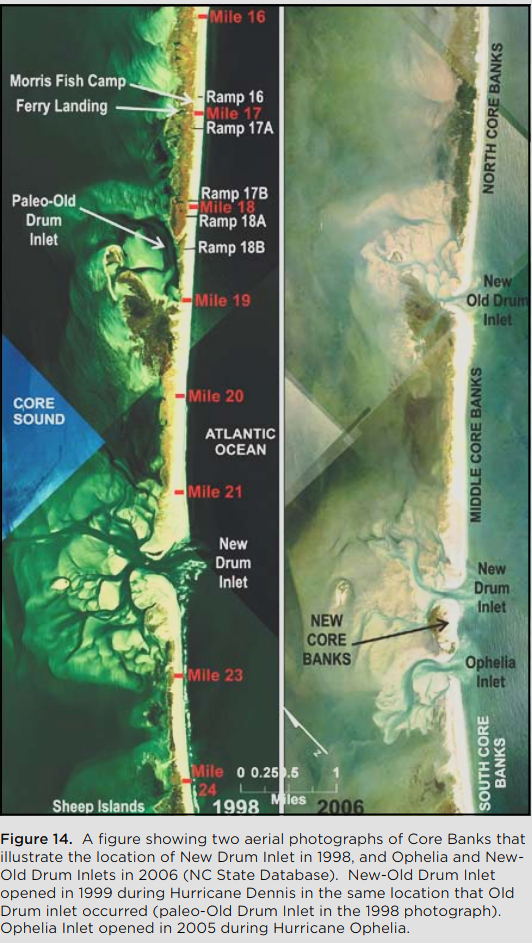
Drum and Ophelia Inlets
- Drum Inlet (Fig. 14) initially opened in about 1899, but then closed naturally by 1919. It was then reopened during a major hurricane in 1933. Early attempts (beginning in 1938) at dredging by the U.S. Army Corps of Engineers did little to maintain a navigable channel for commercial fisherman (Stick, 1958; Riggs and Ames, 2007). By 1971, the inlet was nearly closed, and the U.S. Army Corps of Engineers proceeded to open New Drum Inlet several miles to the southwest. A channel was dredged and blasted through the island to create New Drum Inlet in 1971. The purpose of New Drum Inlet was to allow commercial fishing vessels to transit between the ocean and several small coastal communities. However, due to rapid shoaling, no commercial vessels have ever used the inlet (Riggs and Ames, 2007). In 1999, Hurricane Dennis reopened Drum Inlet, which is now referred to as New-Old Drum Inlet. In 2005, Hurricane Ophelia opened an inlet southwest of New Drum Inlet. Currently Ophelia Inlet is expanding, and has nearly merged with New Drum Inlet.