knowt logo

Unit 4 test

  • multiple choice

  • short answer

  • carbon cycle

  • draw a diagram of the carbon cycle

  • the precautionary principle and explain it

  • draw a food web and chain

  • understand how to classify trophic levels

  • analyze data (what type of correlation)

  • how peat is formed

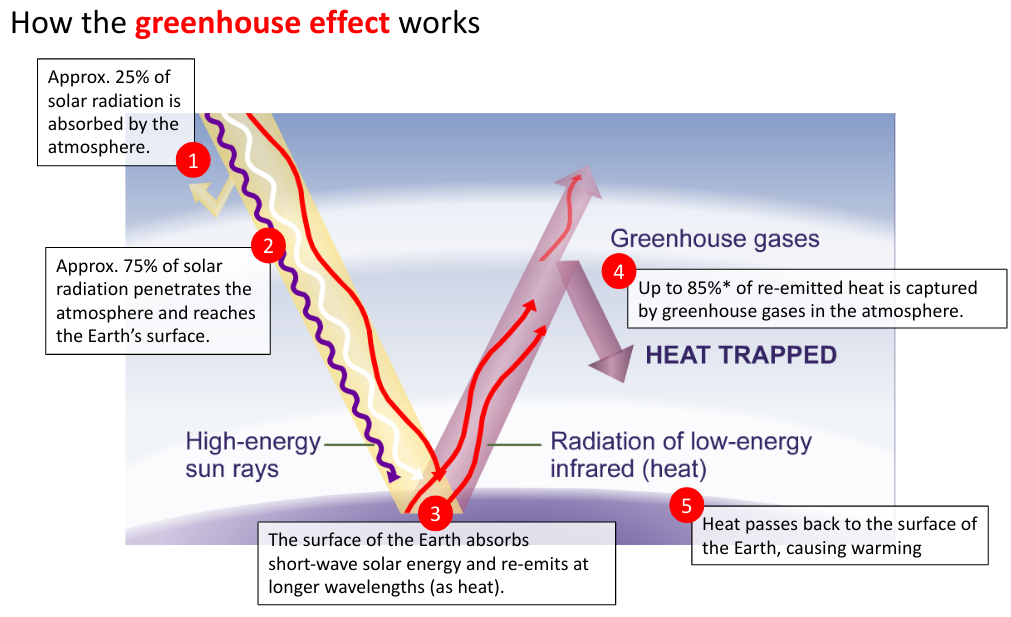
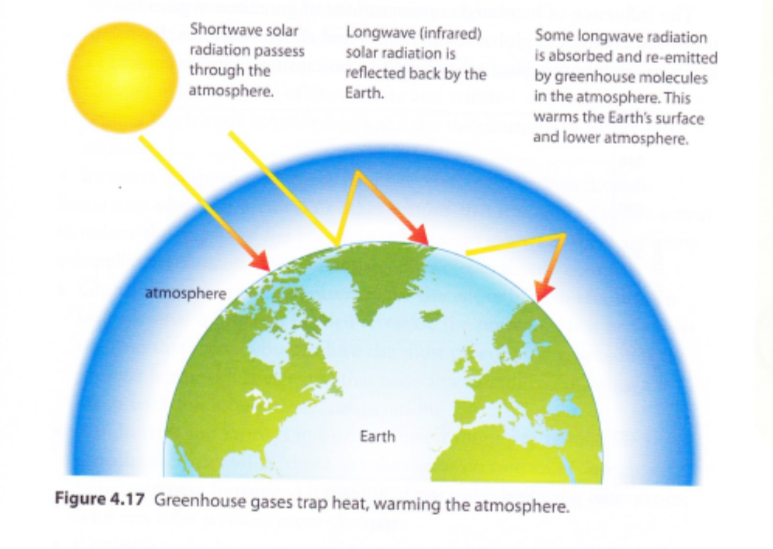
  • annotate a diagram of greenhouse gases (slide 13, 4.4)

Son lo q va salir en el examen.

4.4

Precautionary principle

  • Precautionary principle: the idea that it's better to act cautiously and prevent harm before it happens, rather than waiting for proof of harm that may come too late.

    • The precautionary principle encourages taking protective measures even when there is a lack of scientific certainty.

    • GMOs (Genetically Modified Organisms): Even though GMOs may be proven safe in the future, some countries have taken a cautious approach by restricting their use until more research is done.

    • Pesticides: Before using new chemicals on crops, some governments require safety testing and restrict their use if there is uncertainty about their long-term effects on health or the environment.

    • Climate Change: In response to rising concerns about global warming, many nations are reducing carbon emissions even though the full impacts of climate change are still not completely understood, to prevent possible future harm.

Diagram of greenhouse gases (slide 13, 4.4)
Carbon Cycle

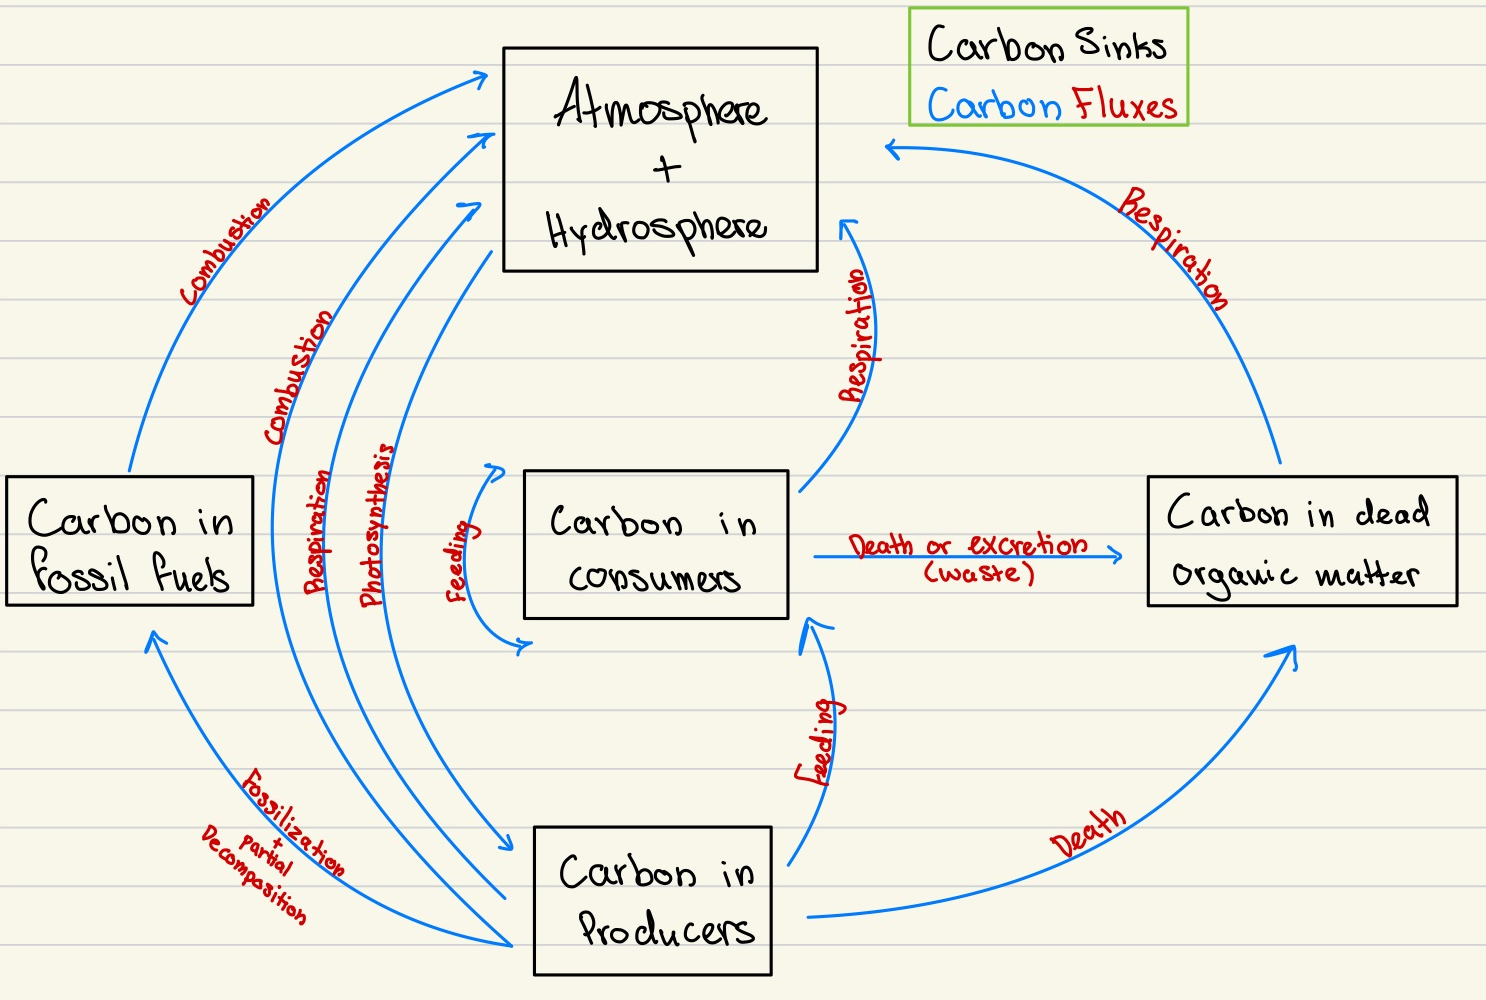
  • Carbon cycle: the natural process where carbon moves between the atmosphere, plants, animals, oceans, and soil, supporting life and regulating Earth's climate.

  • Carbon sinks:

    • CO2 in the atmosphere/hydrosphere: A greenhouse gas that contributes to global warming and is essential for photosynthesis in plants. CO2 is in the air (atmosphere) and dissolved in water (hydrosphere).

    • Carbon in Consumers: Consumers are organisms that gain carbon by eating producers or other consumers. They store carbon in their bodies as part of organic compounds such as fats and proteins.

    • Carbon in Fossil Fuels: Fossil fuels are nonrenewable and formed from the remains of ancient plants and animals. They store carbon captured from the atmosphere and release it as CO2 when burned for energy.

    • Carbon in Producers: Producers get carbon from the atmosphere through photosynthesis and convert it into organic compounds like glucose. They are a primary carbon source for other organisms in the food chain.

    • Carbon in Dead Organic Matter: Dead organic matter includes the remains of plants and animals that store carbon. When microorganisms decompose the dead organic matter, the carbon is released back into the soil or atmosphere.

  • Carbon Flux: Carbon flux refers to the movement of carbon between different parts of the Earth, such as the atmosphere, oceans, plants, and soil. It's like the flow of carbon in the carbon cycle. Examples include photosynthesis, respiration, and fossil fuel burning.

  • Carbon Sinks: Carbon sinks are natural systems that absorb and store more carbon than they release. Examples are forests, oceans, and soil, which help reduce the amount of carbon dioxide in the atmosphere.

    • Carbon is added to the Earth’s atmosphere by:

      • Deforestation

      • Decomposition

      • Cell respiration

      • The burning of fossil fuels

    • Carbon is removed from the Earth’s atmosphere by:

      • Photosynthesis

      • Mineral formations

      • Dissolving in the ocean

  • Carbon Cycling

    • Atmospheric CO₂: Measured in parts per million (ppm).

      • Example: Current atmospheric CO₂ levels are around 420 ppm.

    • Carbon stores (sinks) are measured in: GT (gigatons)

    • Carbon fluxes are measured in: GTPR (gigatons per year)

      • Carbon stores (sinks): are the total amount of carbon held in areas like forests or oceans, which are measured in GT (gigatons).

      • Carbon fluxes: on the other hand, measure how fast carbon moves in and out of the stores like the forests or oceans. They are shown in gigatons per year.

      • The difference in how carbon stores and carbon fluxes are measured allows us to understand how much carbon is stored over time compared to how quickly it moves.

  • Carbon in the atmosphere is measured using two different instruments:

    • AIRS: Atmospheric infrared sounder

    • OCO: Orbiting carbon observatory

  • In Figure 4.15 above, the dotted line shows the trend of increasing carbon dioxide in the atmosphere, but what do the peaks and troughs along the line indicate?

    • The dotted line shows the trend of increasing CO2 in the atmosphere, with the peaks and troughs indicating when the CO2 was at its highest and lowest points on the graph. They also show the difference in seasons, as in winter, they would be higher as they burn more coal.

  • In Figure 4.16 above, the graph shows carbon dioxide data from different sources. What are the two sources? Describe the trend shown by the data.

    • From source one they are from ice-core samples, and from source two they are from instrument reading. The graph shows a positive linear relationship with the ice-core samples until they start using the instrument reading, at which the graph grows at an exponential rate.

Peat

  • Peat: a dense, waterlogged material made up of partially decomposed plant matter. It accumulates in wetlands like bogs and serves as a significant carbon store.

  • How is Peat Formed?

    • Plant Growth: Plants like mosses and grasses grow in waterlogged, acidic, and oxygen-poor environments.

    • Slow Decomposition: In these conditions, microorganisms can't fully break down plant material.

    • Accumulation: Over time, layers of partially decayed plants build up, forming peat.

    • This process takes thousands of years and plays a key role in carbon storage.

  • Formation of peat and its eventual transformation into coal:

    • Waterlogging: Plants grow and die in wetlands where waterlogging creates low oxygen levels, slowing decomposition and allowing organic matter to accumulate.

    • Compression: Layers of peat build up over time, and the weight of new layers compresses the older material, removing water and increasing density.

    • Heat and Pressure: Over millions of years, buried peat is exposed to intense heat and pressure, transforming it into coal through a process called calcification.

4.2

Trophic levels

  • Food chain: shows the exact linear sequence of which organisms eat who, from producers to the apex predators.

  • Food web: shows all the feeding relationships within the habitat and has multiple food chains within it.

  • Trophic level: a group of organisms that obtain their food from the same part of a food web and which all have the same number of energy transfers from the source of energy.

    • Plants: which are producers are in the first trophic level because they make their food through photosynthesis.

    • Rabbits: which are primary consumers, are in the second trophic level because they eat plants that are in the first trophic level.

    • Foxes: which are secondary consumers are in the third trophic level as they eat the rabbits which are in the second trophic level.

  • Why do food chains only contain 4 or 5 trophic levels maximum?

    • There are only 4 to 5 trophic levels max because in every step in the food chain energy is lost from the chain from not being consumed, leaving the food chain as waste, when organisms die, and when living organisms breathe it in. Due to the loss of energy, there won't be enough passed down through the trophic levels to have anymore, as energy is essential for the organisms to stay alive.

    • Reasons for why the amount of energy decreases at higher trophic levels:

      • A body part not being consumed

      • Cell respiration

      • When organisms die

      • Waste

  • The function of ATP, and how it is formed in heterotrophs:

    • ATP is adenosine triphosphate, and it provides energy to organisms for movements like growth and chemical reactions. It is formed in heterotrophs through cellular respiration, which is the process that all living things use to convert glucose into energy. In this case, heterotrophs ingest other living organisms to obtain glucose, which is then converted into energy.

  • Why, energy as heat is lost from ecosystems, but we can recycle nutrients:

    • Energy as heat is lost from ecosystems because it flows in one direction and dissipates during energy transfers, primarily through metabolic processes. On the other hand, nutrients can be recycled through biogeochemical cycles, allowing them to move between organisms and the environment repeatedly.

  • What percentage of energy gets passed to the above trophic level?

    • The energy transfer is around 10 - 20% due to the accounted energy loss through the trophic levels.

    • Only about 10 to 20% of the energy is passed between the trophic levels because the rest is lost due to body parts not being consumed, leaving as waste when organisms die, and when living organisms breathe it in.

  • Biomass: Biomass is a way to measure the total mass of living organisms in an area or ecosystem at a specific time. Biomass measures everything including plants, animals, and microorganisms is considered when measuring biomass.

    • The unit used for communicating the energy in each trophic level of a food chain is 𝑘𝐽𝑚-2𝑦𝑟-1

10% is lost moving up each trophic level

  • voy a add un food web y un food chain.

4.1

  • What is a positive correlation?

    • A positive correlation is when there is an upward trend in the data we are analyzing. There is normally an increase in the independent variables, which means that the dependent variable generally increases.

  • What is a negative correlation?

    • A negative correlation is when there is a downward trend in the data that is being analyzed. There's normally an increase in the independent variable which causes the dependent variable to decrease.

  • What does a weak versus strong correlation look like?

    • A strong correlation is when the data is close together on the chart which allows for easy identification if it is a positive, negative, or no correlation chart. A weak correlation on the other hand is when the data is spread out and makes it harder to determine whether it's positive, negative, or no correlation.

  • What does a weak versus strong correlation mean about the data set?

    • In the strong correlation, the independent variable affects the dependent variable more than the weak correlation, which is why the data is more concentrated together. In the weak correlation, the independent variable affects the dependent variable less, which is why the data is more spread out.

  • What would you do if you saw an outlier in a data set?

    • If the outlier data was a graphing or recording error then I would get rid of it, but if it was an actual data set then I would keep it in my data set.

  • What can the correlation coefficient r tell you about a data set?

    • The correlation coefficient r can tell us if the data set is a positive or negative correlation and if the correlation is strong or weak depending on if r is a positive number and if r is closer to +1, -1, or closer to zero.

  • What can the coefficient of determination r2 tell you about a data set?

    • The coefficient of determination r2 can tell us the degree to which change in the independent variable explains the change in the dependent variable.

Vocab

4.3

  • Methanogenic bacteria: Archaebacteria that metabolize nutrients without needing oxygen, and produce methane as a byproduct (instead of CO2).

  • Methane: A powerful greenhouse gas.

  • Peat: an organic substance made up of partially decomposed plant material found in wetlands such as swamps and bogs.

  • Fossil Fuels: Deposits of coal, oil and natural gas, made from partially decomposed organic materials being compressed and fossilized over millions of years.

4.1

  • Ecosystem: the organisms of a particular habitat together with the physical environment in which they live - for example, a tropical rainforest.

  • Species: a group of individuals of common ancestry that closely resemble each other and are normally capable of interbreeding to produce fertile offspring.

  • Population: a group of organisms of the same species that live in the same area at the same time.

  • Community: a group of populations of organisms living and interacting within a habitat.

  • Abiotic factors: aspect of the environment that is not living - for example, humidity, temperature, salinity, wind, soil particles.

  • Biotic factors: the biological influences and factors on organisms in an ecosystem

  • Ecology: the study of the relationships between living organisms and their environment, including both the physical environment and the other organisms that live in it.

  • Autotrophs: organism able to make its own food from simple inorganic materials and an energy source.

  • Heterotrophs: an organism that feeds on organic molecules.

  • Consumers: an organism that feeds on another organism.

  • Detritivores: an organism that feeds on dead organic matter through ingestion.

  • Saprotrophs: organism that feeds on dead organic matter through absorption.

  • Decomposers: organism that feeds on dead plant and animal matter so that it can be recycled; most decomposers are microorganisms.

  • Mesocosm: A small-scale, self-sustaining natural system that can be used to study part of an ecosystem under controlled conditions.

  • Symbiotic relationship: ‘living together’ - includes commensalism, mutualism and parasitism.

4.2

  • Food Chain: a sequence of organisms in a habitat, beginning with a producer, in which each obtains nutrients by eating the organism preceding it.

  • Producer: an autotrophic organism.

  • Consumer: an organism that feeds on another organism.

  • Trophic Level: a group of organisms that obtain their food from the same part of a food web and which are all the same number of energy transfers from the source of energy (photosynthesis).

  • Primary Consumer: an organism that feeds on a primary producer.

  • Food Web: a series of interconnected food chains.

  • Energy pyramids: a diagram that shows the total energy content at different trophic levels in an ecosystem.

4.4

  • Greenhouse Effect: Natural phenomenon which traps the sun's warmth in a planet's lower atmosphere

  • Shortwave radiation: Solar energy (light) from the sun

  • Longwave radiation: Infrared energy (heat) from the sun

  • Chlorofluorocarbons (CFCs): Chemicals found in aerosol bottles that damage the ozone layer in the atmosphere.

  • Hydrofluorocarbons (HFC’s): Chemicals that replaced CFC’s role in society, that actually is a greenhouse gas.

  • Global warming: Rise in the average global temperature.

  • Climate change: Change in the earth’s weather patterns and climate as a results of global warming.

  • Coral Bleaching: a process whereby the coral colonies lose their color, either due to the loss of pigments by microscopic algae living in symbiosis with their host organisms, coral polyps.

  • Coral Polyps: tiny, soft-bodied organisms related to sea anemones and jellyfish. At their base is a hard, protective limestone skeleton, which forms the structure of coral reefs. Reefs begin when a polyp attaches itself to a rock on the seafloor, then divides, or buds, into thousands of clones.

  • Ocean Acidification: term used to describe significant changes to the chemistry of the ocean. It occurs when carbon dioxide gas (or CO2) is absorbed by the ocean and reacts with seawater to produce acid.

  • Arctic Ecosystem: Includes the tundra, permafrost and the sea ice, a huge floating mass surrounding the North Pole.

  • Detritus: Organic matter produced by the decomposition of organisms

  • Precautionary Principle: An approach to a problem that takes preventative measures, even if there may not be sufficient data to prove that the activity will cause harm.

AA

Unit 4 test

  • multiple choice

  • short answer

  • carbon cycle

  • draw a diagram of the carbon cycle

  • the precautionary principle and explain it

  • draw a food web and chain

  • understand how to classify trophic levels

  • analyze data (what type of correlation)

  • how peat is formed

  • annotate a diagram of greenhouse gases (slide 13, 4.4)

Son lo q va salir en el examen.

4.4

Precautionary principle

  • Precautionary principle: the idea that it's better to act cautiously and prevent harm before it happens, rather than waiting for proof of harm that may come too late.

    • The precautionary principle encourages taking protective measures even when there is a lack of scientific certainty.

    • GMOs (Genetically Modified Organisms): Even though GMOs may be proven safe in the future, some countries have taken a cautious approach by restricting their use until more research is done.

    • Pesticides: Before using new chemicals on crops, some governments require safety testing and restrict their use if there is uncertainty about their long-term effects on health or the environment.

    • Climate Change: In response to rising concerns about global warming, many nations are reducing carbon emissions even though the full impacts of climate change are still not completely understood, to prevent possible future harm.

Diagram of greenhouse gases (slide 13, 4.4)
Carbon Cycle

  • Carbon cycle: the natural process where carbon moves between the atmosphere, plants, animals, oceans, and soil, supporting life and regulating Earth's climate.

  • Carbon sinks:

    • CO2 in the atmosphere/hydrosphere: A greenhouse gas that contributes to global warming and is essential for photosynthesis in plants. CO2 is in the air (atmosphere) and dissolved in water (hydrosphere).

    • Carbon in Consumers: Consumers are organisms that gain carbon by eating producers or other consumers. They store carbon in their bodies as part of organic compounds such as fats and proteins.

    • Carbon in Fossil Fuels: Fossil fuels are nonrenewable and formed from the remains of ancient plants and animals. They store carbon captured from the atmosphere and release it as CO2 when burned for energy.

    • Carbon in Producers: Producers get carbon from the atmosphere through photosynthesis and convert it into organic compounds like glucose. They are a primary carbon source for other organisms in the food chain.

    • Carbon in Dead Organic Matter: Dead organic matter includes the remains of plants and animals that store carbon. When microorganisms decompose the dead organic matter, the carbon is released back into the soil or atmosphere.
  • Carbon Flux: Carbon flux refers to the movement of carbon between different parts of the Earth, such as the atmosphere, oceans, plants, and soil. It's like the flow of carbon in the carbon cycle. Examples include photosynthesis, respiration, and fossil fuel burning.

  • Carbon Sinks: Carbon sinks are natural systems that absorb and store more carbon than they release. Examples are forests, oceans, and soil, which help reduce the amount of carbon dioxide in the atmosphere.

    • Carbon is added to the Earth’s atmosphere by:

      • Deforestation

      • Decomposition

      • Cell respiration

      • The burning of fossil fuels

    • Carbon is removed from the Earth’s atmosphere by:

      • Photosynthesis

      • Mineral formations

      • Dissolving in the ocean

  • Carbon Cycling

    • Atmospheric CO₂: Measured in parts per million (ppm).

      • Example: Current atmospheric CO₂ levels are around 420 ppm.

    • Carbon stores (sinks) are measured in: GT (gigatons)

    • Carbon fluxes are measured in: GTPR (gigatons per year)

      • Carbon stores (sinks): are the total amount of carbon held in areas like forests or oceans, which are measured in GT (gigatons).

      • Carbon fluxes: on the other hand, measure how fast carbon moves in and out of the stores like the forests or oceans. They are shown in gigatons per year.

      • The difference in how carbon stores and carbon fluxes are measured allows us to understand how much carbon is stored over time compared to how quickly it moves.

  • Carbon in the atmosphere is measured using two different instruments:

    • AIRS: Atmospheric infrared sounder

    • OCO: Orbiting carbon observatory

  • In Figure 4.15 above, the dotted line shows the trend of increasing carbon dioxide in the atmosphere, but what do the peaks and troughs along the line indicate?

    • The dotted line shows the trend of increasing CO2 in the atmosphere, with the peaks and troughs indicating when the CO2 was at its highest and lowest points on the graph. They also show the difference in seasons, as in winter, they would be higher as they burn more coal.

  • In Figure 4.16 above, the graph shows carbon dioxide data from different sources. What are the two sources? Describe the trend shown by the data.

    • From source one they are from ice-core samples, and from source two they are from instrument reading. The graph shows a positive linear relationship with the ice-core samples until they start using the instrument reading, at which the graph grows at an exponential rate.

Peat

  • Peat: a dense, waterlogged material made up of partially decomposed plant matter. It accumulates in wetlands like bogs and serves as a significant carbon store.

  • How is Peat Formed?

    • Plant Growth: Plants like mosses and grasses grow in waterlogged, acidic, and oxygen-poor environments.

    • Slow Decomposition: In these conditions, microorganisms can't fully break down plant material.

    • Accumulation: Over time, layers of partially decayed plants build up, forming peat.

    • This process takes thousands of years and plays a key role in carbon storage.

  • Formation of peat and its eventual transformation into coal:

    • Waterlogging: Plants grow and die in wetlands where waterlogging creates low oxygen levels, slowing decomposition and allowing organic matter to accumulate.

    • Compression: Layers of peat build up over time, and the weight of new layers compresses the older material, removing water and increasing density.

    • Heat and Pressure: Over millions of years, buried peat is exposed to intense heat and pressure, transforming it into coal through a process called calcification.

4.2

Trophic levels

  • Food chain: shows the exact linear sequence of which organisms eat who, from producers to the apex predators.

  • Food web: shows all the feeding relationships within the habitat and has multiple food chains within it.

  • Trophic level: a group of organisms that obtain their food from the same part of a food web and which all have the same number of energy transfers from the source of energy.

    • Plants: which are producers are in the first trophic level because they make their food through photosynthesis.

    • Rabbits: which are primary consumers, are in the second trophic level because they eat plants that are in the first trophic level.

    • Foxes: which are secondary consumers are in the third trophic level as they eat the rabbits which are in the second trophic level.

  • Why do food chains only contain 4 or 5 trophic levels maximum?

    • There are only 4 to 5 trophic levels max because in every step in the food chain energy is lost from the chain from not being consumed, leaving the food chain as waste, when organisms die, and when living organisms breathe it in. Due to the loss of energy, there won't be enough passed down through the trophic levels to have anymore, as energy is essential for the organisms to stay alive.

    • Reasons for why the amount of energy decreases at higher trophic levels:

      • A body part not being consumed

      • Cell respiration

      • When organisms die

      • Waste

  • The function of ATP, and how it is formed in heterotrophs:

    • ATP is adenosine triphosphate, and it provides energy to organisms for movements like growth and chemical reactions. It is formed in heterotrophs through cellular respiration, which is the process that all living things use to convert glucose into energy. In this case, heterotrophs ingest other living organisms to obtain glucose, which is then converted into energy.

  • Why, energy as heat is lost from ecosystems, but we can recycle nutrients:

    • Energy as heat is lost from ecosystems because it flows in one direction and dissipates during energy transfers, primarily through metabolic processes. On the other hand, nutrients can be recycled through biogeochemical cycles, allowing them to move between organisms and the environment repeatedly.

  • What percentage of energy gets passed to the above trophic level?

    • The energy transfer is around 10 - 20% due to the accounted energy loss through the trophic levels.

    • Only about 10 to 20% of the energy is passed between the trophic levels because the rest is lost due to body parts not being consumed, leaving as waste when organisms die, and when living organisms breathe it in.

  • Biomass: Biomass is a way to measure the total mass of living organisms in an area or ecosystem at a specific time. Biomass measures everything including plants, animals, and microorganisms is considered when measuring biomass.

    • The unit used for communicating the energy in each trophic level of a food chain is 𝑘𝐽𝑚-2𝑦𝑟-1

10% is lost moving up each trophic level

  • voy a add un food web y un food chain.

4.1

  • What is a positive correlation?

    • A positive correlation is when there is an upward trend in the data we are analyzing. There is normally an increase in the independent variables, which means that the dependent variable generally increases.

  • What is a negative correlation?

    • A negative correlation is when there is a downward trend in the data that is being analyzed. There's normally an increase in the independent variable which causes the dependent variable to decrease.

  • What does a weak versus strong correlation look like?

    • A strong correlation is when the data is close together on the chart which allows for easy identification if it is a positive, negative, or no correlation chart. A weak correlation on the other hand is when the data is spread out and makes it harder to determine whether it's positive, negative, or no correlation.

  • What does a weak versus strong correlation mean about the data set?

    • In the strong correlation, the independent variable affects the dependent variable more than the weak correlation, which is why the data is more concentrated together. In the weak correlation, the independent variable affects the dependent variable less, which is why the data is more spread out.

  • What would you do if you saw an outlier in a data set?

    • If the outlier data was a graphing or recording error then I would get rid of it, but if it was an actual data set then I would keep it in my data set.

  • What can the correlation coefficient r tell you about a data set?

    • The correlation coefficient r can tell us if the data set is a positive or negative correlation and if the correlation is strong or weak depending on if r is a positive number and if r is closer to +1, -1, or closer to zero.

  • What can the coefficient of determination r2 tell you about a data set?

    • The coefficient of determination r2 can tell us the degree to which change in the independent variable explains the change in the dependent variable.

Vocab

4.3

  • Methanogenic bacteria: Archaebacteria that metabolize nutrients without needing oxygen, and produce methane as a byproduct (instead of CO2).

  • Methane: A powerful greenhouse gas.

  • Peat: an organic substance made up of partially decomposed plant material found in wetlands such as swamps and bogs.

  • Fossil Fuels: Deposits of coal, oil and natural gas, made from partially decomposed organic materials being compressed and fossilized over millions of years.

4.1

  • Ecosystem: the organisms of a particular habitat together with the physical environment in which they live - for example, a tropical rainforest.

  • Species: a group of individuals of common ancestry that closely resemble each other and are normally capable of interbreeding to produce fertile offspring.

  • Population: a group of organisms of the same species that live in the same area at the same time.

  • Community: a group of populations of organisms living and interacting within a habitat.

  • Abiotic factors: aspect of the environment that is not living - for example, humidity, temperature, salinity, wind, soil particles.

  • Biotic factors: the biological influences and factors on organisms in an ecosystem

  • Ecology: the study of the relationships between living organisms and their environment, including both the physical environment and the other organisms that live in it.

  • Autotrophs: organism able to make its own food from simple inorganic materials and an energy source.

  • Heterotrophs: an organism that feeds on organic molecules.

  • Consumers: an organism that feeds on another organism.

  • Detritivores: an organism that feeds on dead organic matter through ingestion.

  • Saprotrophs: organism that feeds on dead organic matter through absorption.

  • Decomposers: organism that feeds on dead plant and animal matter so that it can be recycled; most decomposers are microorganisms.

  • Mesocosm: A small-scale, self-sustaining natural system that can be used to study part of an ecosystem under controlled conditions.

  • Symbiotic relationship: ‘living together’ - includes commensalism, mutualism and parasitism.

4.2

  • Food Chain: a sequence of organisms in a habitat, beginning with a producer, in which each obtains nutrients by eating the organism preceding it.

  • Producer: an autotrophic organism.

  • Consumer: an organism that feeds on another organism.

  • Trophic Level: a group of organisms that obtain their food from the same part of a food web and which are all the same number of energy transfers from the source of energy (photosynthesis).

  • Primary Consumer: an organism that feeds on a primary producer.

  • Food Web: a series of interconnected food chains.

  • Energy pyramids: a diagram that shows the total energy content at different trophic levels in an ecosystem.

4.4

  • Greenhouse Effect: Natural phenomenon which traps the sun's warmth in a planet's lower atmosphere

  • Shortwave radiation: Solar energy (light) from the sun

  • Longwave radiation: Infrared energy (heat) from the sun

  • Chlorofluorocarbons (CFCs): Chemicals found in aerosol bottles that damage the ozone layer in the atmosphere.

  • Hydrofluorocarbons (HFC’s): Chemicals that replaced CFC’s role in society, that actually is a greenhouse gas.

  • Global warming: Rise in the average global temperature.

  • Climate change: Change in the earth’s weather patterns and climate as a results of global warming.

  • Coral Bleaching: a process whereby the coral colonies lose their color, either due to the loss of pigments by microscopic algae living in symbiosis with their host organisms, coral polyps.

  • Coral Polyps: tiny, soft-bodied organisms related to sea anemones and jellyfish. At their base is a hard, protective limestone skeleton, which forms the structure of coral reefs. Reefs begin when a polyp attaches itself to a rock on the seafloor, then divides, or buds, into thousands of clones.

  • Ocean Acidification: term used to describe significant changes to the chemistry of the ocean. It occurs when carbon dioxide gas (or CO2) is absorbed by the ocean and reacts with seawater to produce acid.

  • Arctic Ecosystem: Includes the tundra, permafrost and the sea ice, a huge floating mass surrounding the North Pole.

  • Detritus: Organic matter produced by the decomposition of organisms

  • Precautionary Principle: An approach to a problem that takes preventative measures, even if there may not be sufficient data to prove that the activity will cause harm.

robot